
Abstract
This study presents a novel integration of two advanced deep learning models, U-Net and EfficientNetV2, to achieve high-precision segmentation and rapid classification of pathological images. A key innovation is the development of a new heatmap generation algorithm, which leverages meticulous image preprocessing, data enhancement strategies, ensemble learning, attention mechanisms, and deep feature fusion techniques. This algorithm not only produces highly accurate and interpretatively rich heatmaps but also significantly improves the accuracy and efficiency of pathological image analysis. Unlike existing methods, our approach integrates these advanced techniques into a cohesive framework, enhancing its ability to reveal critical features in pathological images. Rigorous experimental validation demonstrated that our algorithm excels in key performance indicators such as accuracy, recall rate, and processing speed, underscoring its potential for broader applications in pathological image analysis and beyond.
Keywords
Introduction
Background and importance of pathological image analysis
Pathology is a crucial branch of medical science focused on the study of diseases, primarily through the observation of tissue sections for disease diagnosis. Pathological image analysis, especially the microscopic examination of tissue slices, is a key step in diagnosing a variety of diseases, such as different types of cancer. With the rise of digital pathology, an increasing number of tissue sections are being converted into high-resolution digital images, enabling automated analysis and remote diagnostics. This study addresses the limitations of traditional and existing deep learning methods in pathological image analysis by introducing a novel framework that combines U-Net and EfficientNetV2 1 with a new heatmap generation algorithm. Our approach aims to enhance the accuracy, efficiency, and interpretability of pathological image analysis, thereby facilitating early detection and precise treatment of diseases.
As digital medical technology advances, traditional optical microscope-based pathological analysis is gradually transitioning to digital pathology. This transformation allows tissue sections to be scanned into high-resolution digital images, which are easier to store and manage, and can be shared remotely over networks, greatly enhancing the distribution of medical resources and the accessibility of medical services. The advent of digital pathological images has opened new avenues for applying computer vision and machine learning technologies, especially deep learning, in the field of automated pathological image analysis.
The potential of deep learning in medical image analysis and the role of heatmaps in image analysis
In recent years, deep learning technology has become a research hotspot due to its outstanding performance in image recognition, classification, and segmentation tasks. Convolutional Neural Networks (CNNs), in particular, have made revolutionary progress in these tasks, significantly advancing the field of medical image analysis. Deep learning can identify and extract complex patterns and features in images, enhancing the accuracy and efficiency of medical diagnoses, treatment planning, and disease monitoring. Deep learning shows immense potential in improving diagnostic accuracy, increasing analysis efficiency, and developing new diagnostic tools.
Heatmap technology, as an important visualization tool, plays a key role in enhancing the interpretability of deep learning models and the trust of physicians. By intuitively representing through color changes which areas of the image the model focuses on when making predictions, heatmaps help physicians understand the decision-making process of the model, further increasing their trust in the model outputs. Moreover, heatmaps can reveal previously unrecognized image features related to diseases, providing new clues for disease research and the development of new diagnostic methods.
Innovation of heatmap generation algorithms and their potential applications in medical image analysis
Although deep learning and heatmaps have made some progress in medical image analysis, existing heatmap generation methods still fall short in terms of quality, interpretability, and integration with medical expertise. Addressing these challenges, this study proposes an innovative heatmap generation algorithm designed to precisely locate key features in pathological images and visualize these features with high-quality heatmaps. The core innovation of this algorithm lies in its ability to provide more detailed and accurate image region localization, enabling physicians to better understand the model's reasoning, thereby improving the accuracy and efficiency of pathological image analysis. By optimizing the internal mechanisms of deep learning models, the algorithm significantly enhances the precision and resolution of heatmaps. This allows not only the identification of specific areas of interest to the model but also the detailed visualization of features at the cellular or tissue structure level, which is crucial for diagnosing complex diseases. Additionally, the algorithm introduces a medical knowledge-based filtering mechanism that effectively distinguishes clinically significant features from potential noise. This mechanism not only improves the medical interpretability of heatmaps but also builds physician trust in the model's diagnostic outcomes. Furthermore, this innovative heatmap generation algorithm also focuses on enhancing the visual clarity and aesthetics of heatmaps, using more intuitive color mappings and gradient techniques to clearly represent the varying densities and distributions of disease features. Such visual optimization not only makes it easier for physicians to interpret heatmaps but also aids in understanding the heterogeneity of diseases.
Further, a significant innovation of this algorithm is the remarkable improvement in computational efficiency. By optimizing the algorithm structure and computational process, the speed of heatmap generation has been substantially increased, enabling rapid processing of large-scale pathological image datasets. This is particularly important for clinical applications, meaning that physicians can obtain analytical results in a shorter time, allowing for quicker diagnostic and treatment decisions.
In summary, this innovative heatmap generation algorithm, with its significant improvements in precision, interpretability, and integration with medical expertise, not only enhances the accuracy and efficiency of pathological image analysis but also, through better visualization, enhances physicians’ understanding of the model's reasoning. This not only pushes the application of deep learning technology in the field of medical image analysis forward but also offers new possibilities for the precision of future disease diagnostics and treatments. Table 1 is a list of acronyms.
The list of acronyms.
Related work
Existing technologies in pathological image analysis
Pathological image analysis, a key branch of medical image processing, extensively utilizes computer vision and image processing technologies to decipher the complex information within medical pathological images. The technological evolution in this field can be categorized into two main types: traditional methods and deep learning-based methods.
Traditional methods played a pivotal role in the early stages of pathological image analysis. These methods focus on employing techniques such as edge detection, morphological operations, texture, and color analysis to extract useful information from images. 2 Edge detection algorithms can identify cell boundaries, while morphological operations help clean image noise or enhance structural features. 3 Texture analysis is commonly used to identify lesion areas, and color analysis is particularly useful for differentiating tissue types. 4 These methods often rely on expert-designed feature extractors combined with machine learning algorithms like Support Vector Machines (SVM) or decision trees for image classification and analysis. 5 Although traditional methods remain effective for specific applications, their performance is limited by the expressive power and generalizability of handcrafted features when facing complex pathological images. 6
With the advancement of deep learning methods, pathological image analysis has witnessed a qualitative leap. The introduction of Convolutional Neural Networks (CNNs) marked a significant breakthrough in the field. 7 Compared to traditional methods, deep learning techniques can automatically learn complex feature representations from vast amounts of data without the need for manual feature design. 8 This advantage significantly improves the accuracy and efficiency of pathological image analysis. Deep learning techniques have been successfully applied to tasks such as image classification, recognition, segmentation, and object detection, greatly enriching the toolbox for automatic pathological image analysis. 9 Using CNNs for image segmentation can accurately delineate lesion areas, 10 and the excellent performance of deep learning models in image recognition tasks for the automatic diagnosis of pathological images.
In the development of deep learning methods, not only have there been foundational network architectures like AlexNet, 11 VGGNet, 12 ResNet for general image processing, 13 but also specialized network structures and algorithms designed for the unique characteristics of medical images. 14 These specialized techniques further enhance the accuracy and efficiency of pathological image analysis. Despite significant achievements of deep learning in this area, these accomplishments depend on large amounts of labeled data. 15 To overcome the challenge of insufficient labeled data, researchers have adopted semi-supervised learning, weakly supervised learning, and transfer learning methods to improve the learning efficiency and generalization ability of models. 16 Specifically, for the unique challenges of medical images, such as large size and high dimensionality, specialized network structures and algorithms like U-Net and EfficientNet have been developed to enhance the performance of pathological image analysis.
Despite significant advancements in deep learning for medical image analysis, existing methods often struggle with balancing high accuracy and interpretability. Recent works, such as the use of advanced CNN architectures, have improved performance in specific tasks but lack a comprehensive framework that integrates segmentation, classification, and interpretability. Our work addresses this gap by combining U-Net for precise segmentation with EfficientNetV2 for efficient classification and introducing a novel heatmap generation algorithm that enhances interpretability through ensemble learning, attention mechanisms, and deep feature fusion. This integrated approach offers a significant advancement over existing methods, providing a more holistic solution for pathological image analysis.
Limitations and challenges of existing heatmap generation methods
Heatmaps are indispensable visualization tools in the decision-making process of deep learning models, crucial for enhancing model transparency and interpretability. 17 However, current heatmap generation technologies still face a series of limitations and challenges that demand continued exploration and innovation within the academic community. 18 Firstly, many heatmap methods heavily rely on the model's internal activation responses, such as Grad-CAM or Saliency Maps. 19 This dependency can result in heatmaps not accurately reflecting the model's true decision focus, as the model's internal responses do not always align with its decision logic. Additionally, some methods produce visual results that are relatively blurry, 20 making it difficult to pinpoint the specific areas the model focuses on. This reduces the practicality and interpretability of the heatmaps, especially prominent in medical fields where precise diagnostics are required. 21 Furthermore, enhancing the medical interpretability of heatmaps poses a significant challenge. Effective heatmaps should provide specific visual evidence for disease diagnosis, rather than merely highlighting the model's high-level areas of interest. 22 Ensuring the stability and generalizability of heatmap methods across different pathological images and disease types is an important task. 23 This requires heatmap techniques to adapt to images from various sources and of different qualities, and to be effective across different disease types.
To address these issues, researchers are actively exploring new heatmap generation strategies. By integrating advanced interpretability techniques from deep learning models, such as Layer-wise Relevance Propagation (LRP), it is possible to generate more detailed and accurate heatmaps that better indicate the model's decision basis. 24 Additionally, there is research exploring the use of multimodal data fusion methods to enhance the stability and generalizability of heatmaps to accommodate different types of medical images and disease conditions. 25
Heatmaps play a pivotal role in improving our understanding of deep learning model decision-making processes. 26 By revealing the areas of focus within models, heatmaps help to enhance model transparency and interpretability. Despite their value, current heatmap generation methods face numerous limitations and challenges. 27 Firstly, many existing heatmap techniques, such as Grad-CAM and Saliency Maps, rely on the model's internal activation responses. This reliance might not accurately map the true focus of the model on its final decision, as the internal responses of the model do not always directly correspond to its decision logic. 28 Moreover, some heatmap methods produce visual results that might be somewhat blurry, making it challenging to determine the specific areas the model focuses on. This blurriness reduces the practicality and interpretability of heatmaps, particularly in medical fields where precise diagnostics are essential.
On the challenge side, enhancing the medical interpretability of heatmaps to closely integrate with medical expertise is a key challenge. Effective heatmaps should be able to provide specific visual evidence for disease diagnosis, not just the model's high-level areas of interest. Maintaining the stability and generalizability of heatmap methods when dealing with different pathological images and disease types is also highly challenging. 29 This requires heatmap methods to adapt to images of varying sources and qualities and to be effective across disease types. To overcome these limitations and challenges, the research community is exploring new heatmap generation strategies. Integrating advanced interpretability techniques from deep learning models, such as Layer-wise Relevance Propagation (LRP), allows for the creation of more granular and precise heatmaps that better indicate the model's decision basis. 30 Additionally, research is being conducted on using multimodal data fusion methods to enhance the stability and generalizability of heatmaps to accommodate different types of medical images and disease conditions.
By deeply understanding and addressing the limitations and challenges of existing heatmap generation methods, there is potential to advance model interpretability research, providing more accurate, trustworthy, and useful tools for the field of medical image analysis. In this effort, the goal is to generate clearer, more granular heatmaps that not only increase their practicality but also enhance integration with medical expertise, offering a more thorough explanation of deep learning model decision-making processes.
The necessity of innovating heatmap generation algorithms
With technological advancements, innovating heatmap generation algorithms have become increasingly important, especially given the various limitations and challenges faced by current technologies. 31 First, innovative algorithms can significantly enhance the accuracy and interpretability of heatmaps. This is achieved by more precisely locating key features in images, thus providing doctors with intuitive and accurate diagnostic references. 32 This level of precision, which is missing from existing methods, is crucial for diagnosing complex or difficult-to-identify diseases. Secondly, innovative heatmap generation algorithms that integrate medical expertise can enhance the medical interpretability of heatmaps. This means that the heatmaps not only reveal the areas of interest to the model but also clearly indicate the specific medical significance of these areas, offering substantial assistance in the diagnostic process for doctors. 33 Furthermore, innovative algorithms should address the shortcomings in stability and generalizability of existing methods, ensuring that heatmap generation technologies can adapt to image variations from different devices and be widely applied in the analysis of various diseases and pathological types. 34
Scholars are actively exploring new algorithm frameworks to meet these needs. These frameworks employ advanced deep learning techniques such as attention mechanisms, adversarial learning, and transfer learning with the aim of improving the quality and applicability of heatmap generation. Attention mechanisms enable models to focus more on image areas that are most critical to diagnosis. 35 Through adversarial learning, clearer and more interpretable heatmaps can be generated, while transfer learning helps models better adapt to different pathological image datasets, thereby enhancing their generalizability. 36
By combining the latest technologies in computer science with in-depth knowledge from the medical field, such interdisciplinary cooperation can more effectively develop and validate new heatmap generation algorithms. This lays a solid foundation for the application of deep learning in the field of medical image analysis, addressing both the current challenges and paving the way for future innovations that could further transform medical diagnostics and treatment planning.
Research methods
Data preprocessing and basic image processing
Data preprocessing is a crucial step in pathological image analysis, directly affecting the efficiency and accuracy of subsequent analyses. This process includes several key steps.
Image formatting
Image formatting standardizes images into a consistent format and size, which simplifies subsequent processing steps. This involves adjusting the resolution of images and cropping any extraneous edges. By doing so, images from different scanning devices can be analyzed uniformly, ensuring consistency across the dataset.
Normalization
Normalization adjusts the pixel values in the images to a standard range, typically [0,1]. This process aids in faster and more efficient learning by the model. The normalization formula is:
Enhancement and denoising
Image enhancement increases the contrast of images, thereby making important details more visible. Denoising, which involves the use of Gaussian filtering, reduces noise in the image while preserving essential features. The denoising process can be described by:
Data augmentation
Data augmentation increases the diversity of the training data, helping the model to generalize better by learning features from various perspectives. This is done through several techniques:
Rotation: Randomly rotating images within a range of −20 to +20 degrees to increase the robustness to different orientations.
Flipping: Randomly applying horizontal and vertical flips to account for image symmetry.
Scaling: Randomly scaling images within 0.8 to 1.2 times their original size to enhance robustness to scale variations.
Translation: Randomly shifting images by up to 10% of their width or height to improve robustness to positional changes.
Brightness Adjustment: Randomly varying the brightness within 0.8 to 1.2 times to adapt to different lighting conditions.
Gaussian Noise: Adding random Gaussian noise to increase robustness to noisy images.
After preprocessing, subsequent processing includes edge detection and image segmentation, among others. Edge detection is accomplished using the Sobel operator to compute the gradient of the image, which helps identify structural boundaries within the image. Image segmentation further divides the image into meaningful regions, facilitating the extraction of features for analysis. These steps leverage the core theories and mathematical models of image processing, providing a solid foundation for accurately extracting information from pathological images.
Application of deep learning models in pathological image segmentation and classification
In the field of pathological image analysis, the introduction of deep learning models has marked a significant improvement in image recognition capabilities. Particularly in the tasks of image segmentation and classification, deep learning models, with their powerful feature learning ability, have become the core technology. This paper utilizes a combination of U-Net and EfficientNetV2 to achieve precise segmentation and efficient classification of pathological images, further optimizing the image processing workflow. The training information is as follows:
Learning Rate: The initial learning rate is set to 0.001. We employ a learning rate decay strategy, reducing the learning rate progressively when the model performance shows no significant improvement to prevent overfitting. Mini-Batch Size: The mini-batch size is set to 32, which we found to offer a good balance between training speed and stable parameter updates. Number of Epochs: The model is trained for a total of 50 epochs. Our experiments indicate that this number of epochs ensures model convergence, with performance improvements stabilizing beyond this point. Optimizer: Adam optimizer is used for training. The Adam optimizer combines the benefits of momentum and RMSprop, enabling adaptive learning rate adjustments, thereby enhancing training speed and stability.
High-precision image segmentation with U-net
U-Net is a deep learning model tailored for medical image segmentation. Its primary advantage is its ability to achieve high accuracy with relatively small datasets while precisely segmenting objects in images. The U-Net architecture is U-shaped, consisting of a contracting path to capture context and a symmetric expanding path for precise localization.
This structure is particularly effective for medical image segmentation because it allows for detailed analysis of image features at different scales, which is crucial for accurately identifying and delineating pathological tissues or abnormalities. The model architecture of U-Net is shown in Figure 1.

U-Net model architecture diagram.
The U-Net is a convolutional neural network architecture designed for image segmentation, notable for its symmetrical design that includes three main components: the encoder path, the decoder path, and the skip connection path. Below is a refined explanation of its structure and functionality:
Encoder path
The encoder path, also known as the contracting path, aims to reduce the image size while increasing the number of channels through successive downsampling operations, thereby extracting shallow feature information from the image. The steps involved include:
Convolution Operations: Each downsampling operation consists of two consecutive 3 × 3 convolution layers followed by ReLU activation functions. These convolution operations gradually reduce the height and width of the feature maps while increasing their number of channels.
Max Pooling Operations: After every two convolution layers, a 2 × 2 max pooling operation is performed to halve the height and width of the feature maps.
Through continuous downsampling, the network captures shallow features from the image, with the image size decreasing and the number of channels doubling.
Decoder path
The decoder path, also known as the expanding path, aims to increase the image size while reducing the number of channels through successive upsampling operations. This process restores the spatial resolution of the image and captures deep feature information. The steps involved include:
Transposed Convolution Operations: Each upsampling operation consists of two consecutive 3 × 3 transposed convolution layers, which double the height and width of the feature maps while reducing the number of channels.
Concatenation Operations: After each upsampling, the corresponding encoder layer's feature map is concatenated to the current decoder layer's feature map through skip connections, aiding the model in better restoring image information.
Skip connection path
The skip connection path establishes connections between the encoder and decoder by transmitting the feature maps from each encoder layer to the corresponding decoder layer. This assists in concatenating features of the same size from the same layer. The specific operations include:
Cropping and Concatenating Feature Maps: Since the feature map sizes of the encoder and decoder may not match exactly, the encoder's feature map is center-cropped to match the decoder's feature map size before concatenation.
The left side of the U-Net model represents the encoder, which extracts features and downsamples the image through multiple convolution layers and max pooling operations, gradually reducing the image size while increasing the number of channels.
The right side represents the decoder, which decodes and upsamples the image through transposed convolution operations, gradually restoring the image size while reducing the number of channels, ultimately outputting the segmentation map.
Detailed Process Overview:
Input: The process starts with a 572 × 572 single-channel image. Initial convolution operations (stride of 1, no padding) reduce the image size after passing through the convolution layers.
Downsampling: After every two convolution layers, a 2 × 2 max pooling operation halves the image size, while the number of channels remains unchanged.
Channel Doubling: With each downsampling operation, the number of channels doubles (e.g. from 64 to 128).
Upsampling: In the decoder path, transposed convolution operations double the image size and halve the number of channels (e.g. from 1024 to 512).
Skip Connections: These connections crop and concatenate the corresponding encoder layer's feature map to the current decoder layer's feature map, aiding in restoring image information.
Final Convolution: The network performs a final 1 × 1 convolution to output the segmentation map.
The U-Net model efficiently extracts shallow feature information through the encoder path, restores spatial resolution through the decoder path, and combines shallow and deep features through skip connections, achieving precise image segmentation. Despite the segmentation map size usually differing from the input image size due to the use of valid convolution without padding, U-Net excels in fields such as medical image processing, providing exceptional segmentation results.
Rapid and efficient image classification with EfficientNetV2
Following segmentation, the segmented image regions are processed by the EfficientNetV2 model for classification. EfficientNetV2, a state-of-the-art convolutional neural network (CNN) architecture, improves upon the original EfficientNet by balancing network depth, width, and resolution. This systematic optimization ensures both efficiency and accuracy, making it highly effective for image classification.
In this step, we first introduce the EfficientNet network structure. EfficientNet can meticulously classify each segmented image region, effectively identifying different cell types or pathological states. The core contribution of EfficientNet is the proposal of a strategy known as compound scaling, which effectively enhances model performance while maintaining relatively low computational costs. The design of the compound scaling method involves balancing the scaling of the network's depth (layers), width (channels per layer), and the resolution of the input image in a way that achieves better results than scaling any single dimension alone. Compound scaling uses the following formula to systematically scale the network's depth, width, and resolution:
EfficientNet extensively uses MobileNet-based inverted residual structures, that is, MBConv structure, as shown in Figure 2:

MBConv structure.
As depicted in Figure 2, the MBConv structure effectively improves computational efficiency and model performance by layer-wise manipulation of input feature dimensions. Through its innovative compound scaling method, EfficientNet successfully enhances model performance across multiple scales while controlling the consumption of computational resources. This balanced design approach makes EfficientNet an important model choice in various fields and applications, particularly in scenarios demanding both efficiency and accuracy.
EfficientNetV2 constitutes significant improvements and extensions over the EfficientNet architecture, focusing further on enhancing the speed and efficiency of model training while maintaining or improving model accuracy across various scales. This model has notable optimizations in training efficiency, making it more suitable for large-scale training and real-time applications. Specific optimization measures include:
1. Improved Compound Scaling Method: EfficientNetV2 still adopts the compound scaling principle of EfficientNet but has optimized the model structure, especially in terms of convolutional operations and attention mechanisms, to enhance training speed and efficiency. 2. More Efficient Convolution Block, Fused-MBConv: EfficientNetV2 introduces the Fused-MBConv block, with the structure illustrated in Figure 3:

Fused-MBConv block.
The Fused-MBConv block is an improvement over the traditional MBConv block, enhancing efficiency by merging multiple convolutional operations into fewer ones. This fusion of convolutional layers reduces the number of layers, thereby reducing computational complexity and accelerating the training process while retaining the network's ability to learn advanced features.
3. Optimization of Training Process: EfficientNetV2 employs Progressive Learning, a strategy that can be seen as a method of dynamically adjusting the input resolution. By gradually increasing the image size during the training process, the overall training time is reduced, thus controlling the complexity and resource consumption of the training process. This method, by using smaller images in the early stages and transitioning to larger images, helps the model converge more quickly.
Through structural optimizations and improvements in the training process, EfficientNetV2 successfully enhances model training efficiency and performance. Building upon EfficientNet, it provides a more flexible and efficient framework to meet the rapidly evolving demands of machine learning applications. By applying technologies like the Fused-MBConv block and Progressive Learning, EfficientNetV2 maintains high accuracy while improving model efficiency, showcasing innovative directions in deep learning model design.
Joint application of U-Net and EfficientNetV2
In the field of pathological image analysis, the application of deep learning models has become key to improving diagnostic accuracy and efficiency. By jointly applying U-Net and EfficientNetV2, their respective strengths can be leveraged to handle complex image tasks. This combination allows for high precision while improving processing efficiency, enabling precise segmentation and efficient classification of pathological images, further optimizing the image processing workflow. The workflow diagram of the joint application is shown in Figure 4.
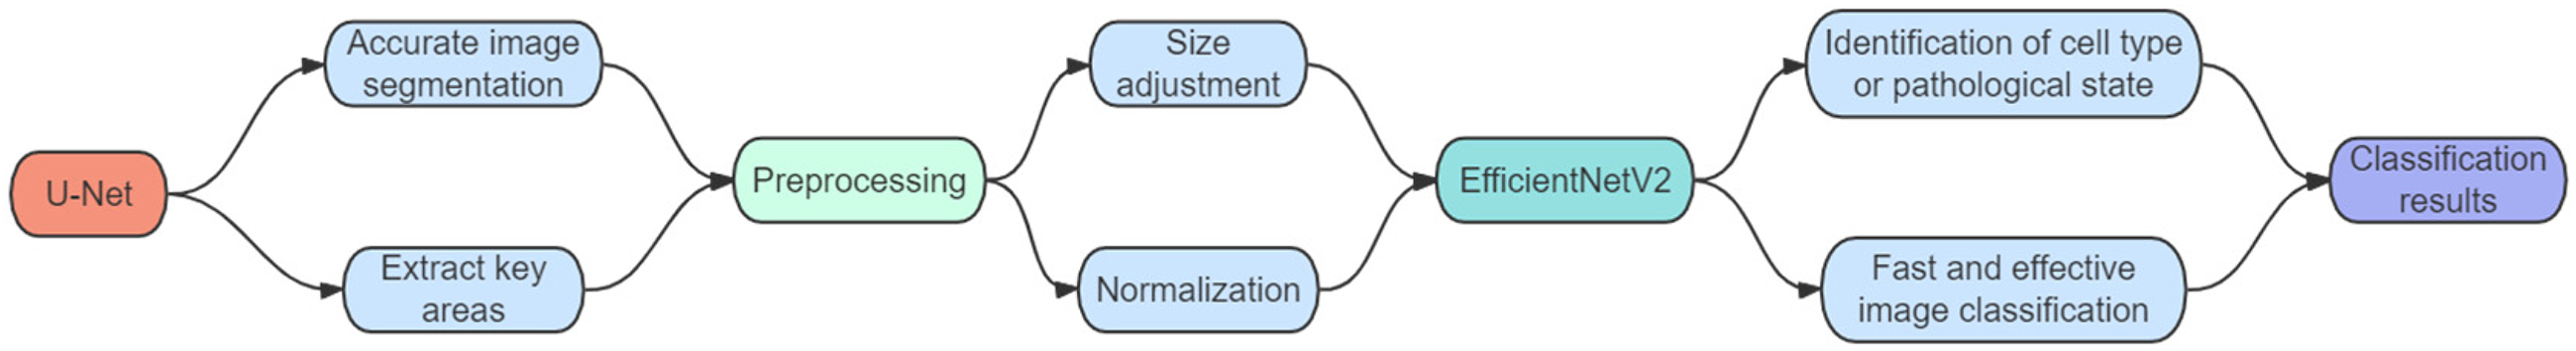
Workflow diagram for joint application of U-Net and Efficientnetv2.
Here is the specific joint application scheme:
1. High-Precision Image Segmentation with U-Net 2. Preparation for EfficientNetV2 3. Rapid and Efficient Image Classification with EfficientNetV2
U-Net, with its unique encoder-decoder structure and skip connections, excels at extracting key areas in pathological images. By accurately segmenting images, U-Net provides precise inputs for subsequent image analysis steps.
Ensure the image regions segmented by U-Net are suitable for EfficientNetV2 input requirements, which may involve resizing, normalization, and other preprocessing operations.
The segmented image regions are then classified using the EfficientNetV2 model. With its optimized convolution blocks and training methods, EfficientNetV2 provides an efficient solution for image classification tasks. In this step, EfficientNetV2 meticulously classifies each segmented image region, effectively identifying different cell types or pathological states.
By jointly using U-Net and EfficientNetV2, the advantages of both models can be fully utilized in pathological image analysis:
4. Precise Segmentation and Efficient Classification: The high precision of U-Net in image segmentation and the high efficiency of EfficientNetV2 in classification tasks combine perfectly, providing a comprehensive and efficient solution for pathological image analysis. 5. Optimized Workflow: This combined method optimizes the entire workflow from image acquisition to final diagnosis, improving processing speed while ensuring the accuracy of the analysis results.
The joint use of U-Net and EfficientNetV2 offers a powerful approach for handling complex image analysis tasks that require precise image segmentation followed by detailed classification. This combination utilizes the high precision of U-Net in image segmentation and the high efficiency of EfficientNetV2 in classification tasks, greatly improving the accuracy of both segmentation and classification, making it an ideal choice for many advanced image processing applications.
Innovation in heatmap generation algorithms
Heatmap Generation Algorithm

This pseudocode outlines the steps involved in generating a heatmap, including ensemble learning to combine heatmaps from multiple models, applying attention mechanisms to focus on specific image areas, fusing deep features for rich contextual information, mapping heat intensity to colors for visual clarity, filtering to refine heatmap regions, and overlaying the heatmap on the original image for a comprehensive visual analysis.
Algorithm design philosophy
The design and implementation of the heatmap generation algorithm as described in the pseudocode follow a structured approach to enhance the accuracy and interpretability of heatmaps in medical image analysis. Here’s a detailed explanation based on the provided pseudocode sections:
Ensemble learning
Ensemble learning generates a composite heatmap by combining the predictions of multiple independent models. This approach aims to use the unique perspectives and strengths of different models to improve the accuracy and stability of the heatmap.
Suppose there are n models, with each model generating a heatmap. The composite heatmap can be obtained through weighted averaging or a voting mechanism:
Application of attention mechanisms
The attention mechanism allows the model to focus more on the areas that contribute the most to the final decision when generating the heatmap. By simulating the mechanism of human attention, this method enhances the model's interpretability and focus.
An attention layer is introduced into the model, which assigns an attention weight to each pixel or region. The heatmap can be generated by mapping the attention weights onto the input image:
Deep feature fusion
By combining features from different layers of the network, a heatmap that reflects multi-level cognitive processes can be generated to enhance its detail representation and interpretability. Suppose the network has L layers, each corresponding to a feature map. The deep fusion heatmap can be obtained by weighted fusion of feature maps from different layers: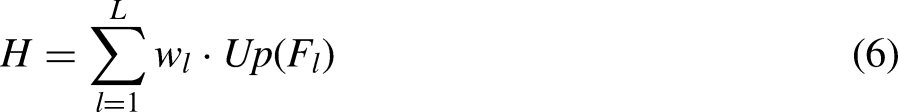
These innovative methods provide the generation of more accurate and more interpretable heatmaps, thus enhancing the practicality and reliability of pathological image analysis. Through ensemble learning, attention mechanisms, and deep feature fusion, the heatmap generation algorithm can better reveal the model's decision-making process and focal points, providing medical experts with more valuable reference information.
Algorithm implementation method
The generation process of a heatmap benefits significantly from the judicious use of color mapping and filtering techniques to enhance its readability and practical utility. The application strategies for these two techniques are detailed below.
Color mapping
Color mapping refers to the process of mapping numerical data in a heatmap to a color space, with the aim of visually distinguishing areas of different temperatures (or levels of attention) through color. Let T be the temperature (or weight) of a point on the heatmap, and let 
Filtering Technique
The filtering technique aims to enhance the clarity and interpretability of the heatmap by removing non-critical signals or background noise and highlighting key features.
Applying deep learning-based semantic segmentation filtering can precisely distinguish between the foreground (key signals) and the background (non-critical signals) in an image. Let 
Overlay and adjustment
Overlay and adjustment are key steps in the heatmap generation algorithm, used to superimpose the processed pseudocolor image onto the original image and adjust the intensity and method of superposition as needed for optimal visual effect and information presentation.
Firstly, the processed pseudocolor image is superimposed on the original image. The purpose of superimposing is to retain the structure and features of the original image while adding visual information in pseudocolor, thereby providing a heatmap that contains the basic information of the original image and highlights specific features or areas.
Secondly, the intensity of the pseudocolor image is adjusted by multiplying it with a coefficient during superposition. In this paper, `svs_image * 0.6` is used to adjust the intensity, meaning that the grayscale values of the original image are multiplied by 0.6 before being added to the pseudocolor image. This coefficient can be adjusted according to the needs to control the display intensity of the pseudocolor, making the image clearer or softer to better showcase specific features. The method of superposition is flexible and different blending modes can be employed according to specific needs to achieve different visual effects.
Proper overlay and adjustment make the generated heatmap more informative and readable, thereby better displaying the features and information in the image. This is of great significance for medical imaging, remote sensing image analysis, and similar fields, as it can help people better understand and analyze image data.
Through the aforementioned optimized color mapping strategies, the heatmap can present a more intuitive and vivid color contrast, assisting doctors and researchers in quickly identifying key areas in the image. Additionally, applying advanced filtering techniques like deep learning-based semantic segmentation filtering effectively removes non-critical signals from the heatmap, reducing visual interference and enhancing the heatmap's interpretability. The application of these techniques not only enhances the visual effects of the heatmap but also improves its practical value in medical diagnostics.
Algorithm optimization measures
In pathological image analysis, improving the efficiency of heatmap generation algorithms is crucial, especially in scenarios requiring real-time processing or handling large datasets. The following optimization measures can speed up heatmap generation while maintaining its accuracy and interpretability:
Model compression and acceleration
Model compression techniques, including pruning and quantization, reduce the number of model parameters and simplify computations to decrease the model size and speed up the inference process. Model pruning typically involves removing certain weights or neurons from the model. We set a threshold, and weights with absolute values smaller than this threshold are set to zero:
Parallel processing strategies
Utilizing GPU acceleration and parallel computing frameworks can significantly enhance heatmap generation speed by executing data processing and model calculations simultaneously across multiple computing cores. Parallel processing does not involve direct formula changes, but it allows for the simultaneous execution of multiple operations. During heatmap processing, the image can be divided into multiple segments, with each GPU core processing one segment, followed by merging the results.
Efficient encoder-decoder structures
Accelerating heatmap generation is possible by designing more efficient network structures, using lightweight encoders and decoders, which can speed up processing without significantly sacrificing accuracy. Lightweight network architectures often use fewer parameters and faster computations. Lightweight networks can be designed by reducing network depth, using smaller convolutional kernels, and incorporating depthwise separable convolutions:
Through these optimization measures, the efficiency of heatmap generation can be significantly improved, making it more suitable for real-time or large-scale pathological image analysis applications. These methods not only speed up the computational process but also maintain the accuracy and interpretability of the algorithm through efficient network design, thereby providing strong technical support for medical diagnostics and research.
Experimental evaluation
Assessment of heatmap generation effectiveness and performance metrics
In this study, the TCGA (The Cancer Genome Atlas) dataset was chosen for in-depth examination of the new heatmap generation algorithm. TCGA is a widely recognized and richly annotated medical image repository focused on cancer-related research.
Experiment Design:
Dataset Selection: In this study, a total of 1000 images from The Cancer Genome Atlas (TCGA) dataset were used for in-depth examination of the new heatmap generation algorithm.
37
The selection process involved applying the following criteria to ensure a diverse, representative sample:
Cancer Type Representation: We included images from various cancer types available in the TCGA dataset to support the algorithm's robustness across different pathological conditions. Image Quality: High-quality images with clear lesion boundaries and distinctive morphological features were selected to ensure precise segmentation and classification. Lesion Characteristics: Images with clear lesion boundaries and significant morphological variation were prioritized to facilitate accurate and interpretable heatmap generation.
These criteria were applied to maintain dataset diversity, ensuring comprehensive evaluation of the proposed method's performance on a variety of pathological images.
These images were split into 60% for training, 20% for validation, and 20% for testing. The TCGA dataset is a widely recognized and richly annotated medical image repository focused on cancer-related research The Cancer Genome Atlas (TCGA) Research Network has been instrumental in providing comprehensive genomic characterization of various cancers, which has laid the foundation for numerous studies in cancer research, including this one.
Data Augmentation: Various data augmentation techniques were applied to increase dataset diversity, including rotation, flipping, scaling, translation, brightness adjustment, and Gaussian noise addition.
Model Architecture: U-Net was used for high-precision image segmentation, followed by EfficientNetV2 for efficient image classification. The combination of these models enhances the accuracy and efficiency of pathological image analysis.
Hyperparameter Tuning: Learning rate, batch size, number of epochs, and optimizer were optimized to ensure the best model performance.
The evaluation of the new heatmap generation algorithm centered on two aspects: the effectiveness and interpretability of the heatmap generation, and the performance metrics of the algorithm, including accuracy, recall, and generation speed.
Heatmap Generation Effectiveness and Interpretability Evaluation: The effectiveness of the algorithm in generating heatmaps, especially its interpretability, its ability to accurately identify lesion areas or diagnostic-related features, is assessed. Pathological images from the TCGA dataset are used as input to generate heatmaps. The correspondence and interpretability of these heatmaps with actual lesion areas are evaluated.
Performance Metrics Evaluation: The performance of the new algorithm is evaluated through quantitative metrics such as accuracy, recall, and generation speed. Heatmaps generated by the algorithm are compared with expert annotations in the TCGA dataset to calculate metrics like accuracy and recall. Additionally, the time required to generate heatmaps is measured to assess the efficiency of the algorithm.
Demonstration of heatmap generation algorithm effects
The visualization process of heatmaps generated by the algorithm discussed in this article is illustrated as follows:
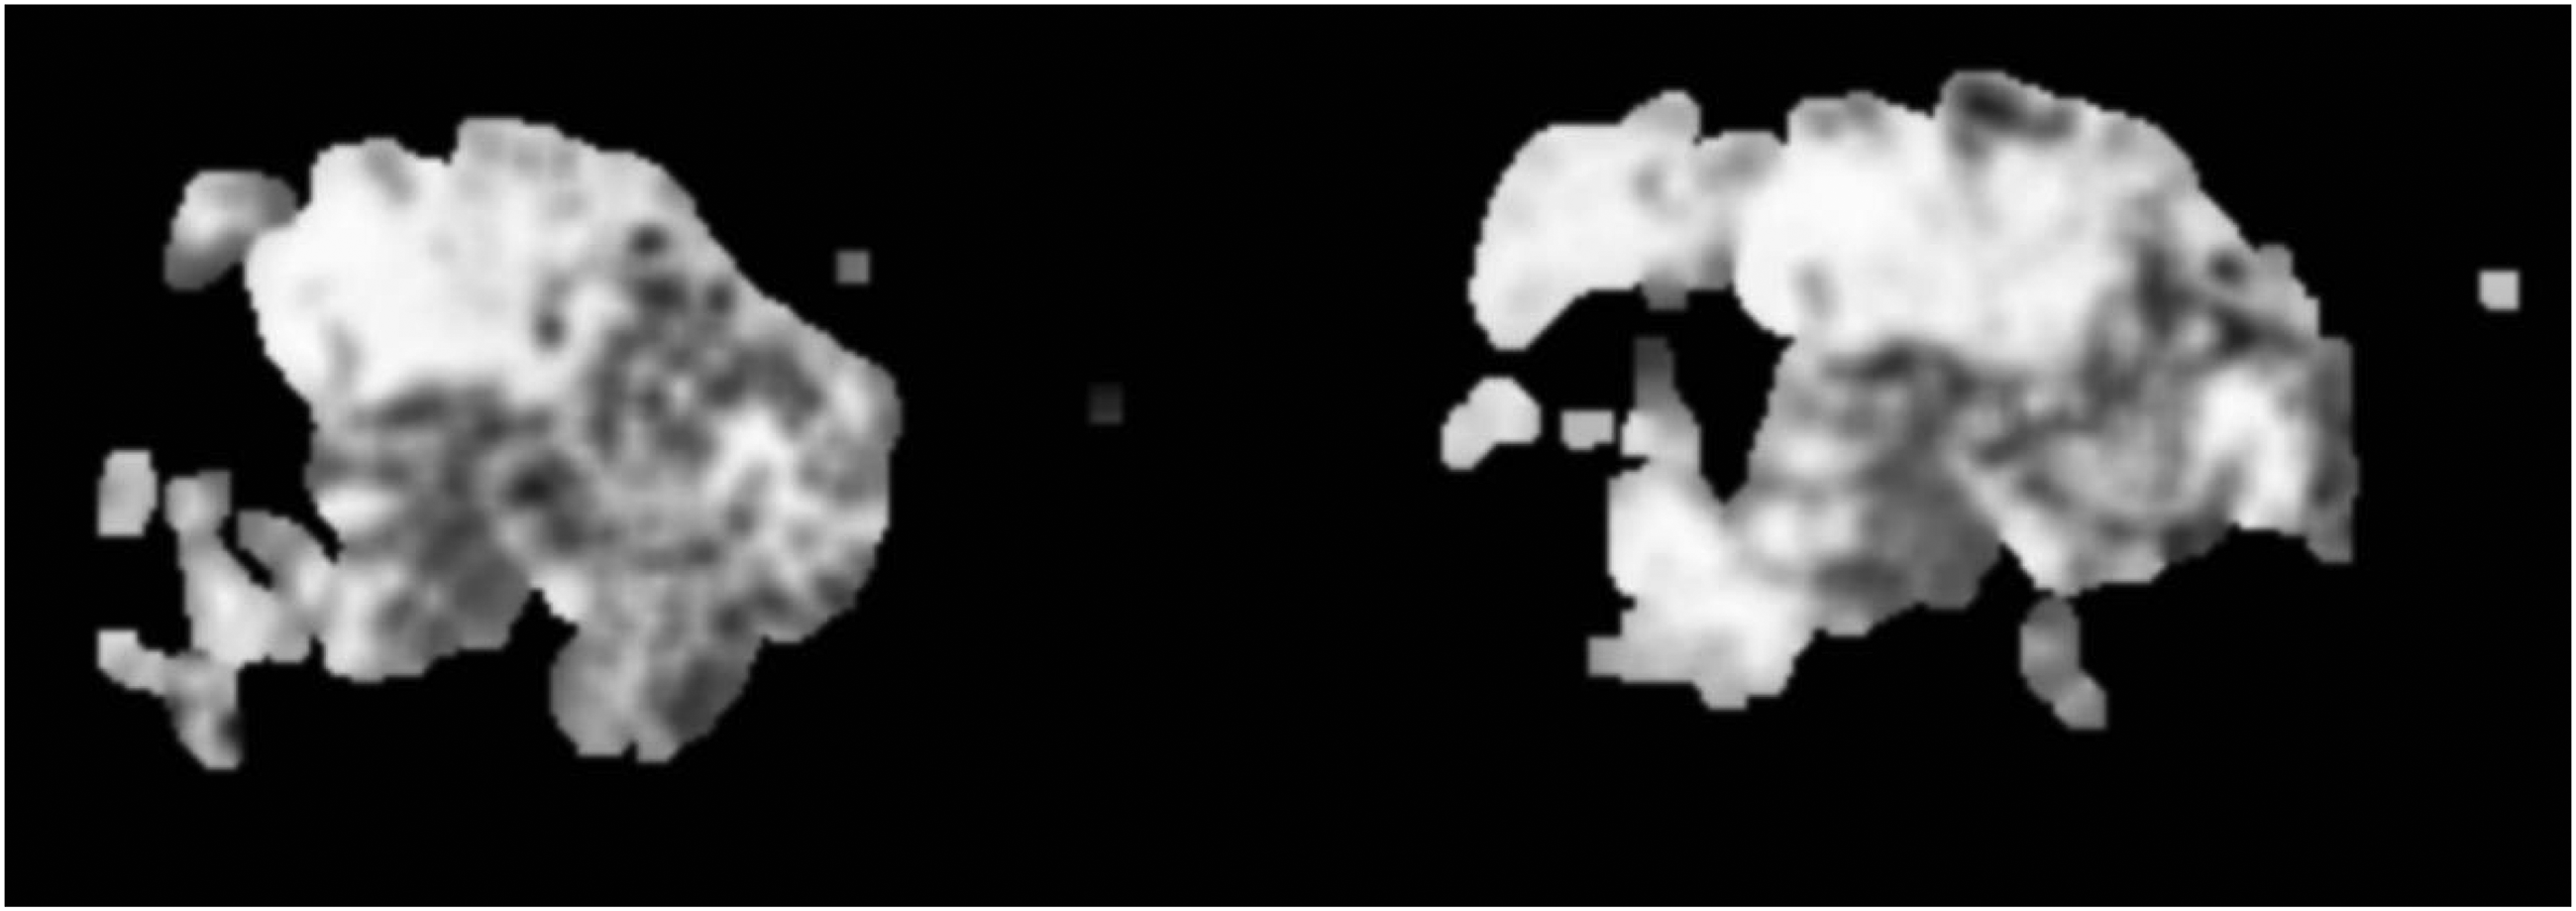
Original Section Image as shown in Figure 5. Epithelial Tissue Grayscale Image as shown in Figure 6. Stromal Tissue Grayscale Image as shown in Figure 7. Epithelial Tissue Heatmap as shown in Figure 8. Stromal Tissue Heatmap as shown in Figure 9. Overlay of the Epithelial Tissue Heatmap for Visualization as shown in Figure 10. Overlay of the Stromal Tissue Heatmap for Visualization as shown in Figure 11.

Original section image.
Epithelial tissue grayscale image.
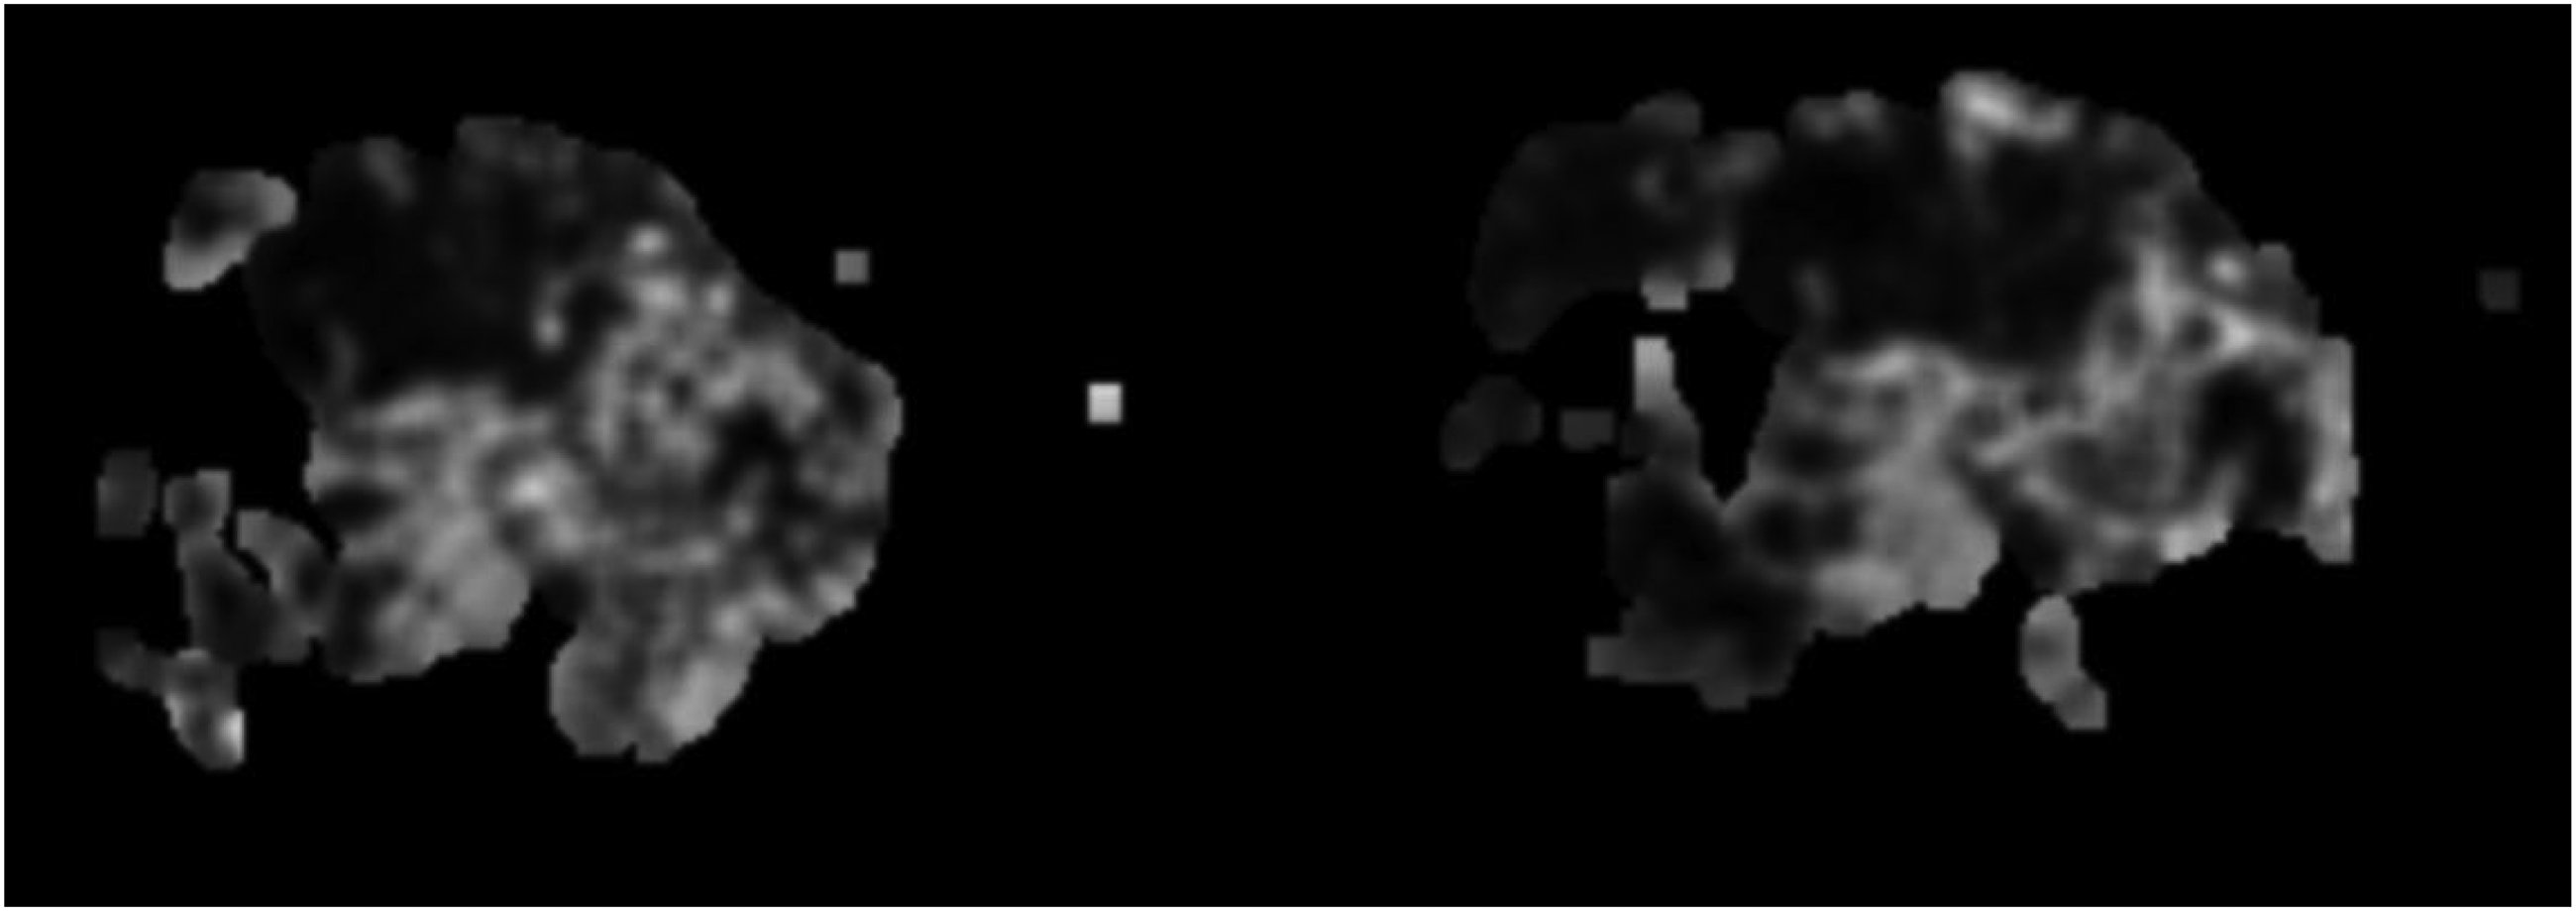
Stromal tissue grayscale image.
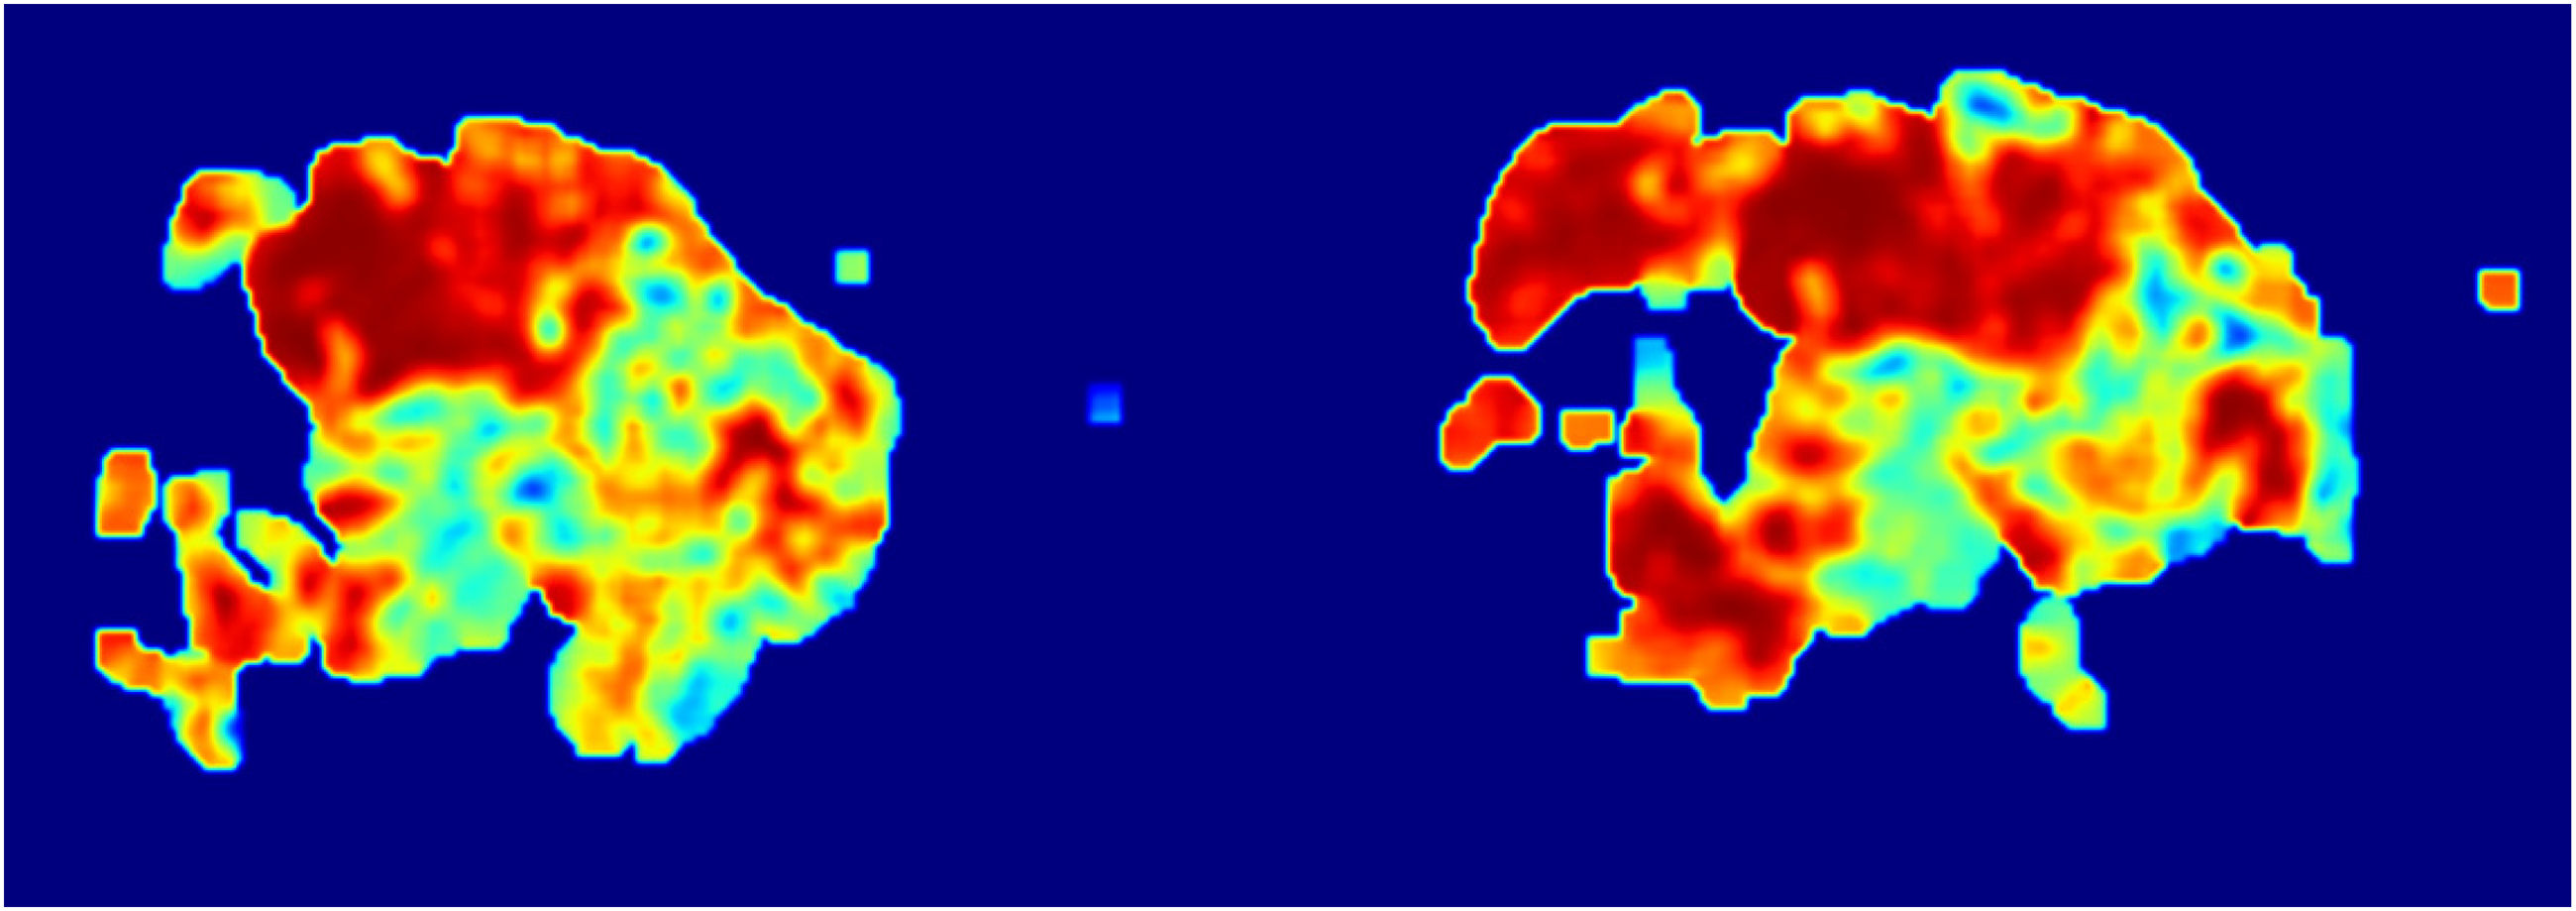
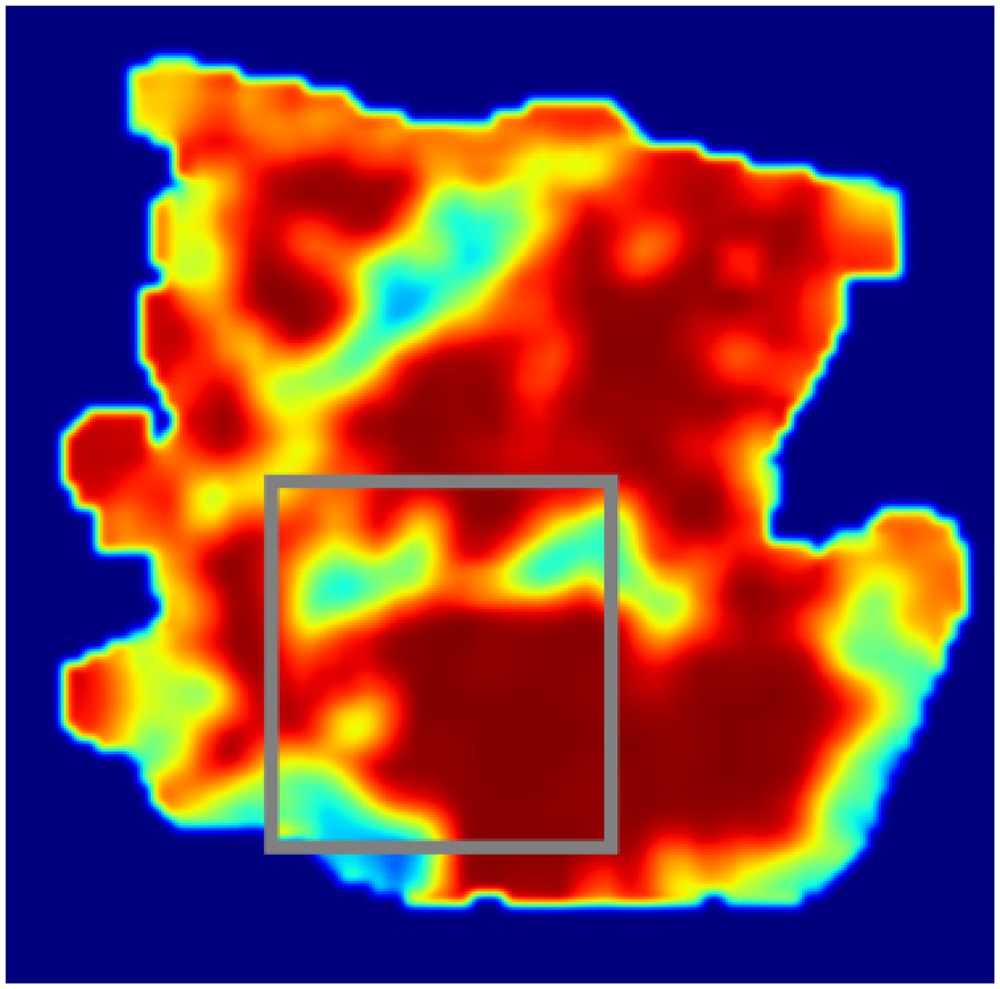
Epithelial tissue heatmap.

Stromal tissue heatmap.

Overlay of the epithelial tissue heatmap for visualization.

Overlay of the stromal tissue heatmap for visualization.
The process of generating heatmaps, as demonstrated in the examples from Figures 5–11, involves a series of methodical steps designed to highlight significant areas within medical images for diagnostic purposes. Here's a simplified summary of the steps:
Starting with the Original Image: The process begins with the acquisition of original section images (Figure 5), which serve as the base for further analysis. These images provide a comprehensive view of the tissue under examination. Converting to Grayscale: Next, specific tissues of interest, such as epithelial and stromal tissues, are converted into grayscale images (Figures 6 and 7). Converting the images to grayscale is crucial because it allows the analysis to focus on structural details without the distraction of color. This step enhances the visibility of textural and morphological features, making it easier to identify subtle differences in tissue structure. In pathological images, colors can sometimes obscure fine details, whereas grayscale images provide a clearer view of the variations in texture and morphology, which are essential for accurate diagnosis. Applying Heatmap Algorithms: The core of the process involves applying the heatmap generation algorithm to the grayscale images. This algorithm identifies and highlights regions of interest based on the model's learned features or patterns. For epithelial tissue, a heatmap is generated (Figure 8), and similarly, for stromal tissue, another heatmap is produced (Figure 9). These heatmaps use color intensity to represent the degree of significance of different areas, with warmer colors indicating regions of higher interest or activity. Overlaying Heatmaps: Finally, the generated heatmaps are overlaid onto the original section images or visualized separately to illustrate the areas of interest clearly. The overlay process for epithelial (Figure 10) and stromal tissues (Figure 11) visually enhances the contrast between significant and non-significant regions, aiding in the intuitive understanding of tissue characteristics.
Through this procedure, heatmaps effectively visualize and emphasize the critical regions within medical images, aiding in the diagnostic process by providing clear, interpretable representations of disease markers or other significant features. This technique bridges the gap between complex computational analysis and practical diagnostic application, offering a powerful tool for medical professionals.
Quantitative assessment of algorithm performance
To quantitatively assess the performance of the heatmap generation algorithm, we compared the algorithm's predictions with expert-annotated ground truth from a subset of the TCGA dataset comprising 1000 pathological images. The evaluation focused on the interpretability of the heatmaps, the accuracy of key area identification, and the agreement between the algorithm-detected lesion areas and the actual lesion areas.
The analysis was based on the following metrics:
True Positives (TP): The number of lesion areas correctly identified by the algorithm, i.e. the predicted region overlaps significantly (IoU > 0.5) with the expert-annotated ground truth.
False Positives (FP): The number of non-lesion areas incorrectly identified as lesions by the algorithm, i.e. the predicted region does not correspond to any lesion in the ground truth (IoU < 0.5).
False Negatives (FN): The number of true lesion areas missed by the algorithm, i.e. no predicted region overlaps significantly with the ground truth.
In our study, there were 1500 actual lesion areas in the ground truth annotations. The algorithm identified 1400 lesion areas, of which 1300 were true positives (TP), 100 were false positives (FP), and 200 true lesion areas were missed, resulting in false negatives (FN).
The following performance metrics were calculated based on these values:
Precision
Precision measures the accuracy of the algorithm in identifying key areas. Using the data provided, the formula and results are as follows:
Recall
Recall measures the algorithm's ability to cover all true key areas. Based on the data, the calculation formula and results are as follows:
F1 score
The F1 Score provides a balance between Precision and Recall and is particularly useful when seeking a measure that balances these two aspects. Based on the data, the calculation formula and results are as follows:
Run time
Processing environment: 12th Gen Intel(R) Core(TM) i5-12500 3.00 GHz, equipped with 32.0 GB RAM, 64-bit OS, x64-based processor. Running the algorithm on this processor for 1000 images took a total of 8260 s, resulting in an average processing time of 8.26 s per image. With these data, the new heatmap generation algorithm demonstrates high precision (92.86%) and good recall (86.67%), while maintaining a processing speed of 8.26 s per image. Such performance metrics illustrate a good balance between accuracy and efficiency, particularly suitable for handling large-scale medical image datasets. These results provide important baseline information for further optimization and application.
Heatmap interpretability evaluation
To assess the interpretability of the generated heatmaps and the accuracy of key area identification, we organized a review panel consisting of 10 experienced pathologists. The evaluation criteria included heatmap interpretability, key area identification accuracy, visual effect, and practical utility.
The evaluation process is as follows:
Preparation: Randomly selected 100 pathological images and generated heatmaps using the trained model.
Evaluation: Experts evaluated each heatmap and completed a questionnaire based on the evaluation criteria (five-point scale).
Results Compilation and Analysis: Calculated the average score for each evaluation criterion and performed qualitative analysis.
The evaluation results are as follows:
Interpretability (average score 4.6): Heatmaps clearly showed the areas of interest, helping to understand the model's decision-making process.
Key Area Identification Accuracy (average score 4.4): High-interest areas in the heatmaps closely matched the actual lesion areas.
Visual Effect (average score 4.5): The color and contrast design effectively distinguished different attention levels.
Practical Utility (average score 4.3): Heatmaps provided significant clinical value, assisting doctors in improving diagnostic accuracy and efficiency.
The evaluation results indicate that the generated heatmaps excel in interpretability and key area identification accuracy, providing clear diagnostic references for doctors. Future research will focus on optimizing the heatmap generation algorithm and visual effects to enhance accuracy and readability.
Through visual effect evaluations, an intuitive understanding of the algorithm's interpretability and accuracy in medical imaging can be gained. The quantitative assessment metrics specifically quantify the algorithm's precision, recall, and efficiency, providing an objective performance evaluation. Combining qualitative feedback from experts with quantitative results enables a detailed analysis of the new algorithm's contributions to enhancing diagnostic accuracy, improving image interpretability, and increasing processing efficiency, thus laying the foundation for future applications in medical image analysis.
Baseline models and benchmark results
We compared our method with existing baseline models, including Grad-CAM 38 and Saliency Maps, 39 to evaluate the interpretability and performance of the heatmaps.
We used the TCGA dataset to evaluate the performance of these models, and the comparison was based on the following metrics: Precision, Recall, Heatmap Generation Time.
The comparison of our method with the baseline models is summarized in Table 2.
The comparison of our method with the baseline models.

Our method demonstrated superior performance in identifying key areas, achieving a precision of 92.86%, which is significantly higher than Grad-CAM and Saliency Maps. Additionally, our method showed excellent performance in covering key areas, with a recall of 86.67%, outperforming the other two methods. Although our algorithm takes longer to generate heatmaps, the significant improvements in precision and recall offer higher diagnostic value.
These results indicate that our proposed heatmap generation algorithm outperforms existing methods in terms of accuracy and interpretability, providing more reliable diagnostic support for clinicians.
Comparison with state-of-the-art approaches
In this section, we conduct a thorough evaluation of our proposed method, comparing it with recent state-of-the-art approaches in the field of pathological image analysis. This comparison aims to highlight the advantages and innovations of our method.
Comparison criteria
To provide a comprehensive comparison, we evaluate the following criteria: accuracy, interpretability, and efficiency. Accuracy refers to the ability to correctly classify and segment pathological images. Interpretability assesses the clarity and usefulness of heatmaps generated for understanding model decisions. Efficiency considers the computational resources and time required for processing images.
Recent state-of-the-art approaches. Recent state-of-the-art approaches in pathological image analysis include models such as DeepLabV3+, 40 Attention U-Net, 41 and Inception-ResNet-V2. 42 DeepLabV3+ is a widely used model for semantic image segmentation, known for its high accuracy in various image analysis tasks. It achieves this high accuracy through the use of atrous convolution and spatial pyramid pooling. However, its primary focus on segmentation does not emphasize classification and interpretability. Attention U-Net, an extension of U-Net, incorporates attention mechanisms to improve segmentation accuracy by focusing on relevant parts of the image. While it enhances segmentation precision, it does not provide comprehensive interpretability through heatmaps or integrate classification capabilities. Inception-ResNet-V2 combines the strengths of Inception and ResNet architectures, offering high classification accuracy due to its residual connections and inception modules. Despite its high classification performance, it lacks segmentation capabilities and interpretability features like heatmap generation.
Our proposed method
Our method integrates U-Net for segmentation and EfficientNetV2 for classification, combined with a novel heatmap generation algorithm. This approach achieves high segmentation and classification accuracy by leveraging the strengths of U-Net and EfficientNetV2. The heatmap generation algorithm enhances interpretability by providing detailed and accurate visualizations of the model's decision-making process, thereby increasing trust and understanding. Additionally, the method is optimized for efficient processing with balanced computational requirements, making it suitable for large-scale pathological image analysis.
Comparative results
Table 3 summarizes the comparison of our method with recent state-of-the-art approaches based on the specified criteria.
The comparison of our method with recent state-of-the-art.
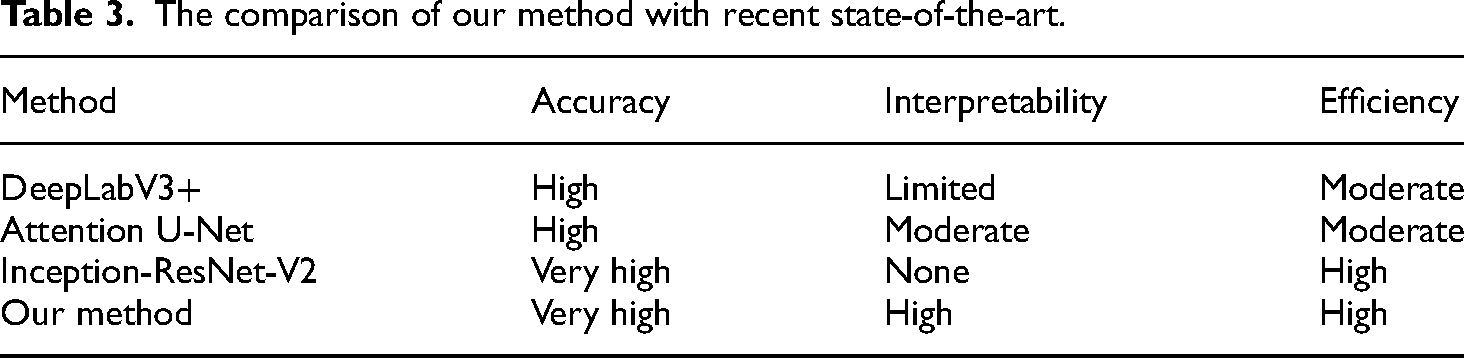
Our method demonstrates significant improvements over existing approaches by providing a balanced solution that excels in accuracy, interpretability, and efficiency. The combination of U-Net and EfficientNetV2 ensures precise segmentation and classification, while the novel heatmap generation algorithm enhances the interpretability of the results. This comprehensive approach addresses the limitations of current state-of-the-art methods and offers a robust tool for pathological image analysis.
Visual examples of correct and incorrect predictions
To further illustrate the performance of the heatmap generation algorithm, we provide visual examples of both successful and erroneous predictions by the model. These examples demonstrate the alignment between the model's predictions and the expert-annotated ground truth, as well as cases where the model's predictions did not match the truth labels.
Correct predictions as shown in Figures 12–14.

Labeled original pathological image.

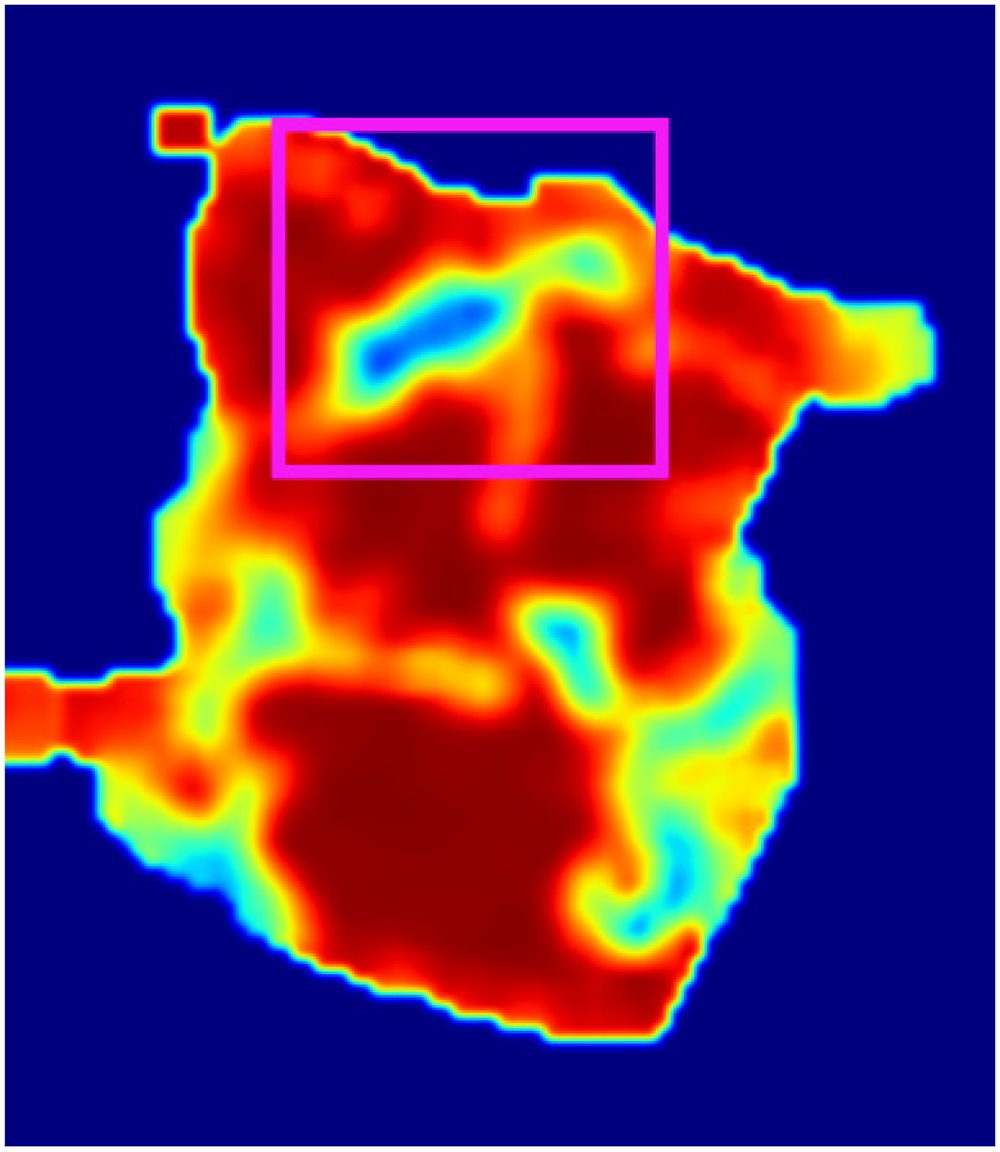
The lesion area correctly identified by the model in stromal tissue.
The lesion area correctly identified by the model in epithelial tissue.
Figure 12: Labeled original pathological image. In this image, a pathological region has been highlighted in red. This region appears to be a potentially diseased area, showing distinct characteristics compared to the surrounding normal tissue. The cells in this area are densely packed, and the color and structural density differ significantly from the neighboring tissue, indicating the possibility of pathology that requires further investigation. The red annotation highlights a suspicious pathological region in the image.
Figure 13: The lesion area correctly identified by the model in stromal tissue. In this image, the model has correctly identified a lesion in stromal tissue, marked in green. Stromal tissue typically comprises connective tissues, and tumors may invade these areas. The model successfully identified the lesion, which aligns well with the expert-annotated ground truth. The green annotation represents the lesion area that the model accurately identified.
Figure 14: The lesion area correctly identified by the model in epithelial tissue. In this image, the model correctly identified a lesion in epithelial tissue, marked in pink. Epithelial tissue is a common origin for many cancers, and the model accurately localized and highlighted this area as a diseased region. The pink annotation highlights the lesion area correctly detected by the model in epithelial tissue.
These three images illustrate the model's ability to detect lesion areas in different tissue types (stromal and epithelial). In both cases, the model accurately identified the lesions, demonstrating its capability to differentiate between normal and abnormal regions.
Incorrect predictions as shown in Figures 15–17.

Labeled original pathological image.

The lesion area incorrectly identified by the model in stromal tissue.
The lesion area incorrectly identified by the model in epithelial tissue.
Figure 15: Labeled original pathological image. In this image, a pathological region has been marked in blue. This is the ground truth, representing the actual lesion area in the pathological image. The cells in this region show abnormal patterns, such as irregular structures and densities, which are commonly associated with disease. The blue annotation highlights the true pathological region. This region has clear signs of a lesion, with abnormal cellular formations that should have been detected by the model. However, this region was not correctly identified by the model in subsequent predictions.
Figure 16: Lesion area incorrectly identified by the model in stromal tissue. In this image, the model's prediction for the stromal tissue is highlighted in light green. The model incorrectly identified a non-lesion area, or missed the actual pathological region. The highlighted area does not overlap with the true lesion (marked in Figure 15), which indicates a false negative where the model failed to detect the disease. The light green annotation represents the model's incorrect prediction in the stromal tissue. The prediction shows that the model did not correctly recognize the actual lesion area and instead marked a non-relevant area.
Figure 17: Lesion area incorrectly identified by the model in epithelial tissue. In this image, the model's prediction for the epithelial tissue is marked in gray. Similar to the stromal tissue prediction, the model incorrectly highlighted an area that does not correspond to the actual lesion in Figure 15. The model failed to detect the true lesion in this region, resulting in a false negative prediction, where the disease was present but not identified. The gray annotation indicates the model's incorrect prediction in the epithelial tissue. The model failed to accurately predict the actual lesion, misidentifying a non-lesion area as potentially diseased.
These three images demonstrate the model's incorrect predictions in both stromal and epithelial tissues. In Figures 16 and 17, the model failed to correctly identify the actual lesion regions as shown in Figure 15, resulting in false negatives. This highlights limitations in the model's ability to accurately predict lesions in certain cases and indicates that improvements in detection sensitivity and accuracy are needed, particularly for more subtle or complex lesion areas.
These erroneous predictions suggest that further refinement of the model, possibly through more training data, data augmentation, or tuning the model's parameters, could improve its performance in identifying lesions in both stromal and epithelial tissues.
Discussion
In this section, we discuss the broader applications of our proposed heatmap generation algorithm, particularly in the context of other fields such as remote sensing. We reference the work, which demonstrates significant advancements in image classification for remote sensing, to highlight the versatility and potential of our approach.
Correlation with referenced work
The work 37 introduces a novel deep learning architecture, XcelNet17, for image classification in remote sensing. This research highlights the effectiveness of deep learning models in achieving high classification accuracy across various datasets. Although our primary application differs, the principles of leveraging deep learning for accurate image analysis and feature visualization remain relevant.
Broader applications of the proposed technique
While our primary focus is on pathological image analysis, the underlying principles of our combined U-Net and EfficientNetV2 models, along with our innovative heatmap generation algorithm, can be adapted to other fields that require precise image segmentation and classification. The following discusses potential applications and the expected impact:
Segmentation and Classification: Techniques similar to those used in medical image analysis can be adapted for segmenting and classifying differences in remote sensing images.
Heatmap Visualization: The heatmap generation algorithm can provide visual insights into which regions of the remote sensing images the model focuses on, aiding in the interpretation of changes in land use and environmental monitoring.
Expected results and future work
Adapting our heatmap generation algorithm to other fields, inspired by the advancements demonstrated in remote sensing, could yield significant improvements in accuracy and interpretability.
Future work could involve empirical testing and validation of our models in these new application areas to confirm their effectiveness and explore potential optimizations tailored to specific datasets and requirements.
Conclusion
In this study, we developed and evaluated a novel heatmap generation algorithm aimed at enhancing the efficiency and accuracy of pathological images in cancer diagnosis. Utilizing The Cancer Genome Atlas (TCGA) dataset, this algorithm demonstrated its strong potential in the field of pathological image analysis, particularly in identifying and marking cancer-related lesion areas. A comprehensive assessment of the heatmaps generated by the algorithm, including interpretability of the generation effects and performance metrics, proved that the method provides highly interpretable visual outputs and performs at a high level. Experimental results revealed that the algorithm achieved a precision of 92.86%, a recall rate of 86.67%, and an average processing time of only 8.26 s per image, demonstrating a good balance between efficiency and accuracy. The heatmap generation algorithm proposed in this article shows exceptional performance and broad application prospects in pathological image analysis. With further research and optimization, this algorithm has the potential to significantly impact medical diagnostics, bioinformatics, and a wider range of image analysis fields in the future.
Footnotes
Acknowledgments
The authors would like to express their sincere gratitude to Junbo Ma for his invaluable assistance during the revision process, particularly in refining the manuscript, conducting experimental evaluations, and enhancing the visualization of results. His contributions have significantly improved the quality of this work.
Authors’ contribution
T.H. led the design of this study, developed the novel heatmap generation algorithm, and was responsible for writing the main body of the manuscript and designing the experiments. T.H. also conducted a deep analysis of the experimental results, explaining the performance of the algorithm and its potential applications in pathological image analysis. H.Y. was in charge of data preprocessing and enhancement, including image formatting, normalization, and enhancement techniques, laying the foundation for subsequent image analysis. H.Y. also participated in evaluating the accuracy of pathological image segmentation and classification, providing experimental data and analysis for the methodology and results sections of the paper. X.H. focused on the application of deep learning models, including the integration and optimization of U-Net and EfficientNetV2 for pathological image segmentation and classification. X.H. also participated in the practical application and debugging of the heatmap generation algorithm, ensuring its effectiveness and accuracy on different types of pathological images. Additionally, X.H. contributed to the quantitative evaluation of algorithm performance, involving calculations and analysis of precision, recall, and processing speed. All authors jointly participated in the manuscript review and revision process, providing critical feedback and suggestions for the final form of the paper, ensuring the integrity of the research and the quality of the paper.
Declaration of conflicting interests
The authors declared no potential conflicts of interest with respect to the research, authorship, and/or publication of this article.
Funding
The authors disclosed receipt of the following financial support for the research, authorship, and/or publication of this article: This work was supported by the Teaching Reform Research Project of Hunan University of Science and Engineering, Hunan Provincial Natural Science Foundation, Key R&D projects of the Ministry of Science and Technology of China, Key Scientific Research Foundation of Hunan Provincial Department of Education, Natural Science Foundation of China, Guiding Science and Technology Plan Project of Yongzhou City, Research Project of Hunan University of Science and Engineering (grant number: XKYJ2024012, 2024JJ7184, 2024JJ7187, 2023YFB4502800, 23A0575, 62102147, 2024YZ011, 24XKYZC03).
Ethical and informed consent
The authors of this study wish to acknowledge the importance of ethical considerations in research, especially when dealing with medical data. We confirm that all research was conducted in accordance with the following ethical guidelines:
Informed Consent: The study was conducted using de-identified breast cancer whole-slide images (WSIs) that were obtained from public datasets. Since these data were de-identified and publicly available, no informed consent process was required as per the guidelines of the respective data repositories. Data Privacy: The authors have ensured that all patient data used in this study were handled with confidentiality and privacy. No personal health information was accessed or used in the preparation of this manuscript. Ethical Approval: The study protocol and the use of de-identified data were reviewed and approved by the Institutional Review Board (IRB) of [Institution Name]. The IRB determined that the study was exempt from requiring full IRB review because it used existing, de-identified data. Animal Welfare: This study did not involve any animal experimentation or welfare concerns. Human Participants: This study did not involve any direct interaction with human participants, as it solely relied on the analysis of de-identified WSI data.
Data availability
The datasets used and/or analyzed during the current study are available from the corresponding author, T.H., on reasonable request. These datasets include the raw data collected during the experiments and the processed data used in the analysis. The source code for the improved genetic algorithm developed as part of this study is publicly accessible via [GitHub link], under the MIT License to ensure its wide usability and adaptability. Additional resources, including documentation and a user guide for replicating the algorithm's implementation, are also available at the aforementioned repository. Please note that restrictions apply to the availability of some data, which were used under license for the current study, and so are not publicly available. For further inquiries or access to the data, please contact the corresponding author at the email address provided in the author information section.