
Abstract
With the growing number of tram operation lines, tram-related traffic incidents, particularly train collisions, have become a major issue. Therefore, the ability to identify foreign objects on a track is critical to tram operational safety. Accurately identifying the rail edge is a critical technology for recognizing the track area and providing early warnings of potential threats. Therefore, this study proposes a self-adaptive rail-edge detection algorithm that uses mathematical morphology and computer vision technology to accurately extract rail edges. The performance of the proposed algorithm was compared to that of existing algorithms, including the Canny algorithm and two other methods described in publication. Three scenes in the level crossing area of trams were considered as the research objects, and the effects of two types of noise in the image were explored in terms of the investigated using mean square error (MSE), peak signal-to-noise ratio (PSNR), and computational time. The results showed that the proposed model exhibited strong robustness for different scenes, particularly in the presence of noise. This suggests that the proposed algorithm could be used in early warning systems of trams to identify rail edges.
Introduction
The operation line of a tram is parallel to the driving lane because it operates on a semi-independent right-of-way and differs significantly from other rail transit systems. Trams are primarily controlled by the driver, and operating safety is closely related to both the driver's experience and health condition. 1 In practice, it is impossible for the driver to maintain focus on the track area for a long time, particularly in level-crossing areas. Therefore, an early warning system for collisions is crucial for reducing tram traffic accidents.2–4
Current studies on train collision warnings are based on navigation, aviation, and road traffic. 5 Radar and image processing sensors are widely used in anti-collision systems. 6 A variety of radars, such as laser radar, millimeter-wave radar, and ultrasonic radar, are typically used to measure the distance between moving objects and barriers in real time. Real-time image collection is performed using image sensors.7,8 Pattern recognition techniques can be used to recognize cars and obstacles in front of a driver,9,10 as well as to provide collision warnings.11,12 The intelligent safety monitoring of tram foreign body intrusion is mainly based on visual technology and railway video real-time monitoring technology, which serve as the foundation for the intelligent operation of trams. Yao 13 introduced a system that combined camera-based video recognition with millimeter-wave radar and laser radar, enabling more accurate obstacle detection through the clustering of laser point cloud data. This approach significantly enhanced the safety of rail systems by improving obstacle detection precision. Based on the concept of multisensor fusion, Shi et al. 14 conducted a comprehensive survey of perimeter intrusion detection systems for high-speed railways. Their study emphasized the importance of combining vision systems with 4D millimeter-wave radars to enhance the detection capabilities. Using different radars, such as millimeter wave and laser radars, this study provided insights into how multisensor fusion could improve the reliability and accuracy of intrusion detection in railway environments. Ristić-Durrant et al. 15 focused on vision-based on-board obstacle detection and the distance estimation in railways. They highlighted the challenges of relying solely on vision sensors for collision avoidance and suggested integrating additional sensors, such as radar and ultrasonic sensors, to overcome these limitations. This integration was crucial to ensure that collision avoidance systems could detect obstacles at sufficient distances, thereby preventing accidents. The application of deep learning to radar signals is an important area of research. Abdu et al. 16 reviewed the application of deep-learning techniques to millimeter-wave radar signals for object detection and forward collision warning systems. The combination of radar and vision data enhanced the performance of collision-warning systems, particularly in complex environments in which traditional sensors may struggle.
The identification of rail edges is the foundation for precise calculation and division of border regions. The traditional edge detection methods often used the first derivative to determine the highest value, or the secondary derivative to determine zero point, to realize the edge detection. In these processes, the Roberts, Sobel, Prewitt, Laplacian, and Kirsch operators17,18 were widely used. Although these operators were widely used in traditional edge detection, separating the noise signal from the actual rail contour remains a significant issue. Moreover, these methods could yield false edges. To accomplish the goals of image analysis and target recognition, it is crucial to measure and extract the corresponding shape in an image using the structuring elements of a specific shape. 19 According to the results reported by Tang and Lu, 20 single-pixel edges were obtained by performing non-maximum suppression (NMS) along the gradient direction, which can reduce noise and preserve detailed features. Ge and Shi 21 used two structuring elements with different structures and sizes to filter an image; the structuring elements were applied in different directions to detect the edges of the image. Beyene 22 explored robust edge detection techniques by comparing various classical edge detectors, including Roberts, Sobel, and Prewitt operators, and emphasized the importance of NMS in refining edges in noisy environments. This study highlighted the limitations of traditional methods and the need to improve noise resistance in complex image scenarios. Liu et al. 23 proposed an adaptive edge detection algorithm that enhanced the Canny operator by integrating different structural elements. This approach improved the edge detection accuracy in noisy environments, demonstrating a significant improvement over traditional methods such as Sobel and Prewitt.
Azouz and Khan 24 provided a comprehensive review of edge detection techniques in structural crack analysis, focusing on the role of mathematical morphology in enhancing the edge detection accuracy. Their study emphasized the application of these techniques in real-world scenarios where noise and other disturbances are prevalent. Yang et al. 25 presented an overview of edge and object contour detection and discussed the effectiveness of classical operators such as Roberts and Sobel. They highlighted the critical role of NMS in producing precise edges and reducing noise interference, which are essential for accurate object contour detection.
Machine learning is widely used in edge detection. The dynamic threshold neural P system 26 was used to solve the problems of weak edges and edge discontinuities by applying the gradient direction and amplitude of the contour to the neurons. Baltierra et al. 27 used the ant colony algorithm in image edge detection to compensate for the negative effects of the Canny and Sobel algorithms in image noise processing. Nowozin et al. 28 employed a structured learning method for edge detection. Dollár et al. 29 proposed a fast edge-detection method using structured forests. Hallman et al. 30 employed a random forest classifier to detect the edges. In addition, deep learning40,41 including DeepEdge, 31 DeepContour, 32 HED, 33 and RCF, 34 has also been used for edge detection, which shows excellent performance in real-time detection and better detection accuracy.
In the aforementioned investigations, few studies focused on rail-edge detection for trams. During operation, the tram track is usually mixed with road transportation, which poses a huge challenge for operating safety. Therefore, this study proposes a self-adaptive rail-edge detection method for trams based on mathematical morphology to identify track areas. This is expected to provide an early warning of collisions. The traditional Canny edge detection algorithm is introduced in the next section 2, and the morphological edge detection method is presented in Section “Self-adaptive rail edge detection algorithm for trams based on morphology.” In Section “Results,” the self-adaptive rail-edge detection algorithm is proposed. The evaluation criteria and results are presented in Section “Conclusion and discussion.”
Traditional edge detection algorithm
Traditional Canny edge detection algorithm
Canny edge detection
35
has been widely used in the industry owing to its simple calculation, which includes the following four steps:
The Gaussian filtering is primarily used to reduce the noise and smoothen the image. The gradient magnitude and direction of each pixel in the image are calculated using gradient operators. The maximum value of the gradient amplitude is suppressed, and the local maxima are identified as possible edge points. Edges are detected and connected with high and low thresholds.
In the aforementioned method, the edge points are connected using a double-threshold screening method. This method could be subject to limitations, such as the fact that the Gaussian filter function can influence the smoothing and denoising effect, the Canny operator ignores the diagonal points, and the threshold in the Canny algorithm is highly dependent on the judgement of researchers, which could lead to lower detection accuracy.
36
Therefore, the morphology was used to overcome these limitations.
Traditional morphological edge detection algorithm
Morphological edge detection comprises of four fundamental operations: erosion, dilation, opening, and closing. These fundamental operations can be logically integrated based on their purpose. In this algorithm, the structuring elements significantly affect detection results. When small structuring elements are used to extract image contours, better edge positions and contour details can be achieved.
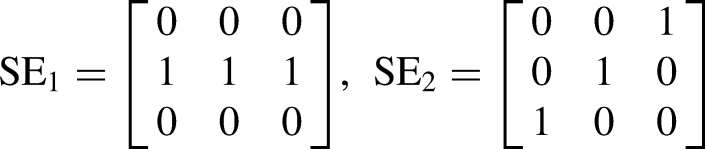
Corrosion and dilation operations
Let


Opening and closing operations


The opening operation uses the original image and structuring element to perform the erosion operation. The dilation operation is then used to filter out the brightness range area, which is smaller than the size of the structural element. However, during operation, the bright features of the large-scale brightness area remained unchanged. The closing operation uses the original image and structuring elements to perform the expansion and corrosion operations.
To filter out the dark range in which the area is smaller than the structuring element scale and retain the dark features of a large range area, a multi-scale and multi-direction self-adaptive weight morphological edge detection algorithm was suggested in.
37
This algorithm includes a weighted information entropy coefficient. Image noise was filtered using two structuring elements of various scales. Four structuring elements with equal scales in various directions were selected for edge extraction; therefore, edge images in various directions were obtained. The information entropy weighting coefficient was calculated by dividing the information entropy of the edge images in different directions by the sum of the information entropies of the four edge images. The final edge image was produced by adding the four edge images in the desired ratio. The edge detection operator proposed in
37
was shown in equation (5).

Guo et al.
38
studied the characteristics of rail images for rail edge detection of railway vehicles. The obtained morphology edge detection operators of the anti-noise corrosion-type


A comparison study of traditional edge detection algorithm for track of trams
In this section, a comparison study of traditional edge-detection algorithms is conducted, considering a photo obtained at the level crossing of trams. In these comparative studies, the Canny algorithm and the algorithms given in Refs.37,38 were considered.
Figure 1 shows the edge detection results. In the Canny algorithm, the lowest threshold was set to 100 and the highest threshold was set to 200. It can be observed that the rail edge obtained through the Canny is slightly indistinct. For the algorithm given in Ref., 37 there is significant internal adhesion in the detected rail profile, as well as superfluous guidelines without rail edge detection results in the distant view. The rail contour detected using the algorithm given in Ref. 38 was clear, and the adhesion phenomenon improved. However, the profile line was thicker, resulting in an inaccurate rail edge location. According to the aforementioned investigations, the drawbacks can be summarized as follows: The Canny algorithm and the edge detection algorithm in Ref. 37 are not specific to the edge detection of railway vehicles. In railways, sleepers and fasteners are buried beneath road surfaces, leaving only the railhead visible for identification. The algorithm in Ref. 38 cannot identify level-crossing scene features because it focuses on the edge identification of the ballast track and considers the influence of fasteners and sleepers on the detection of images.
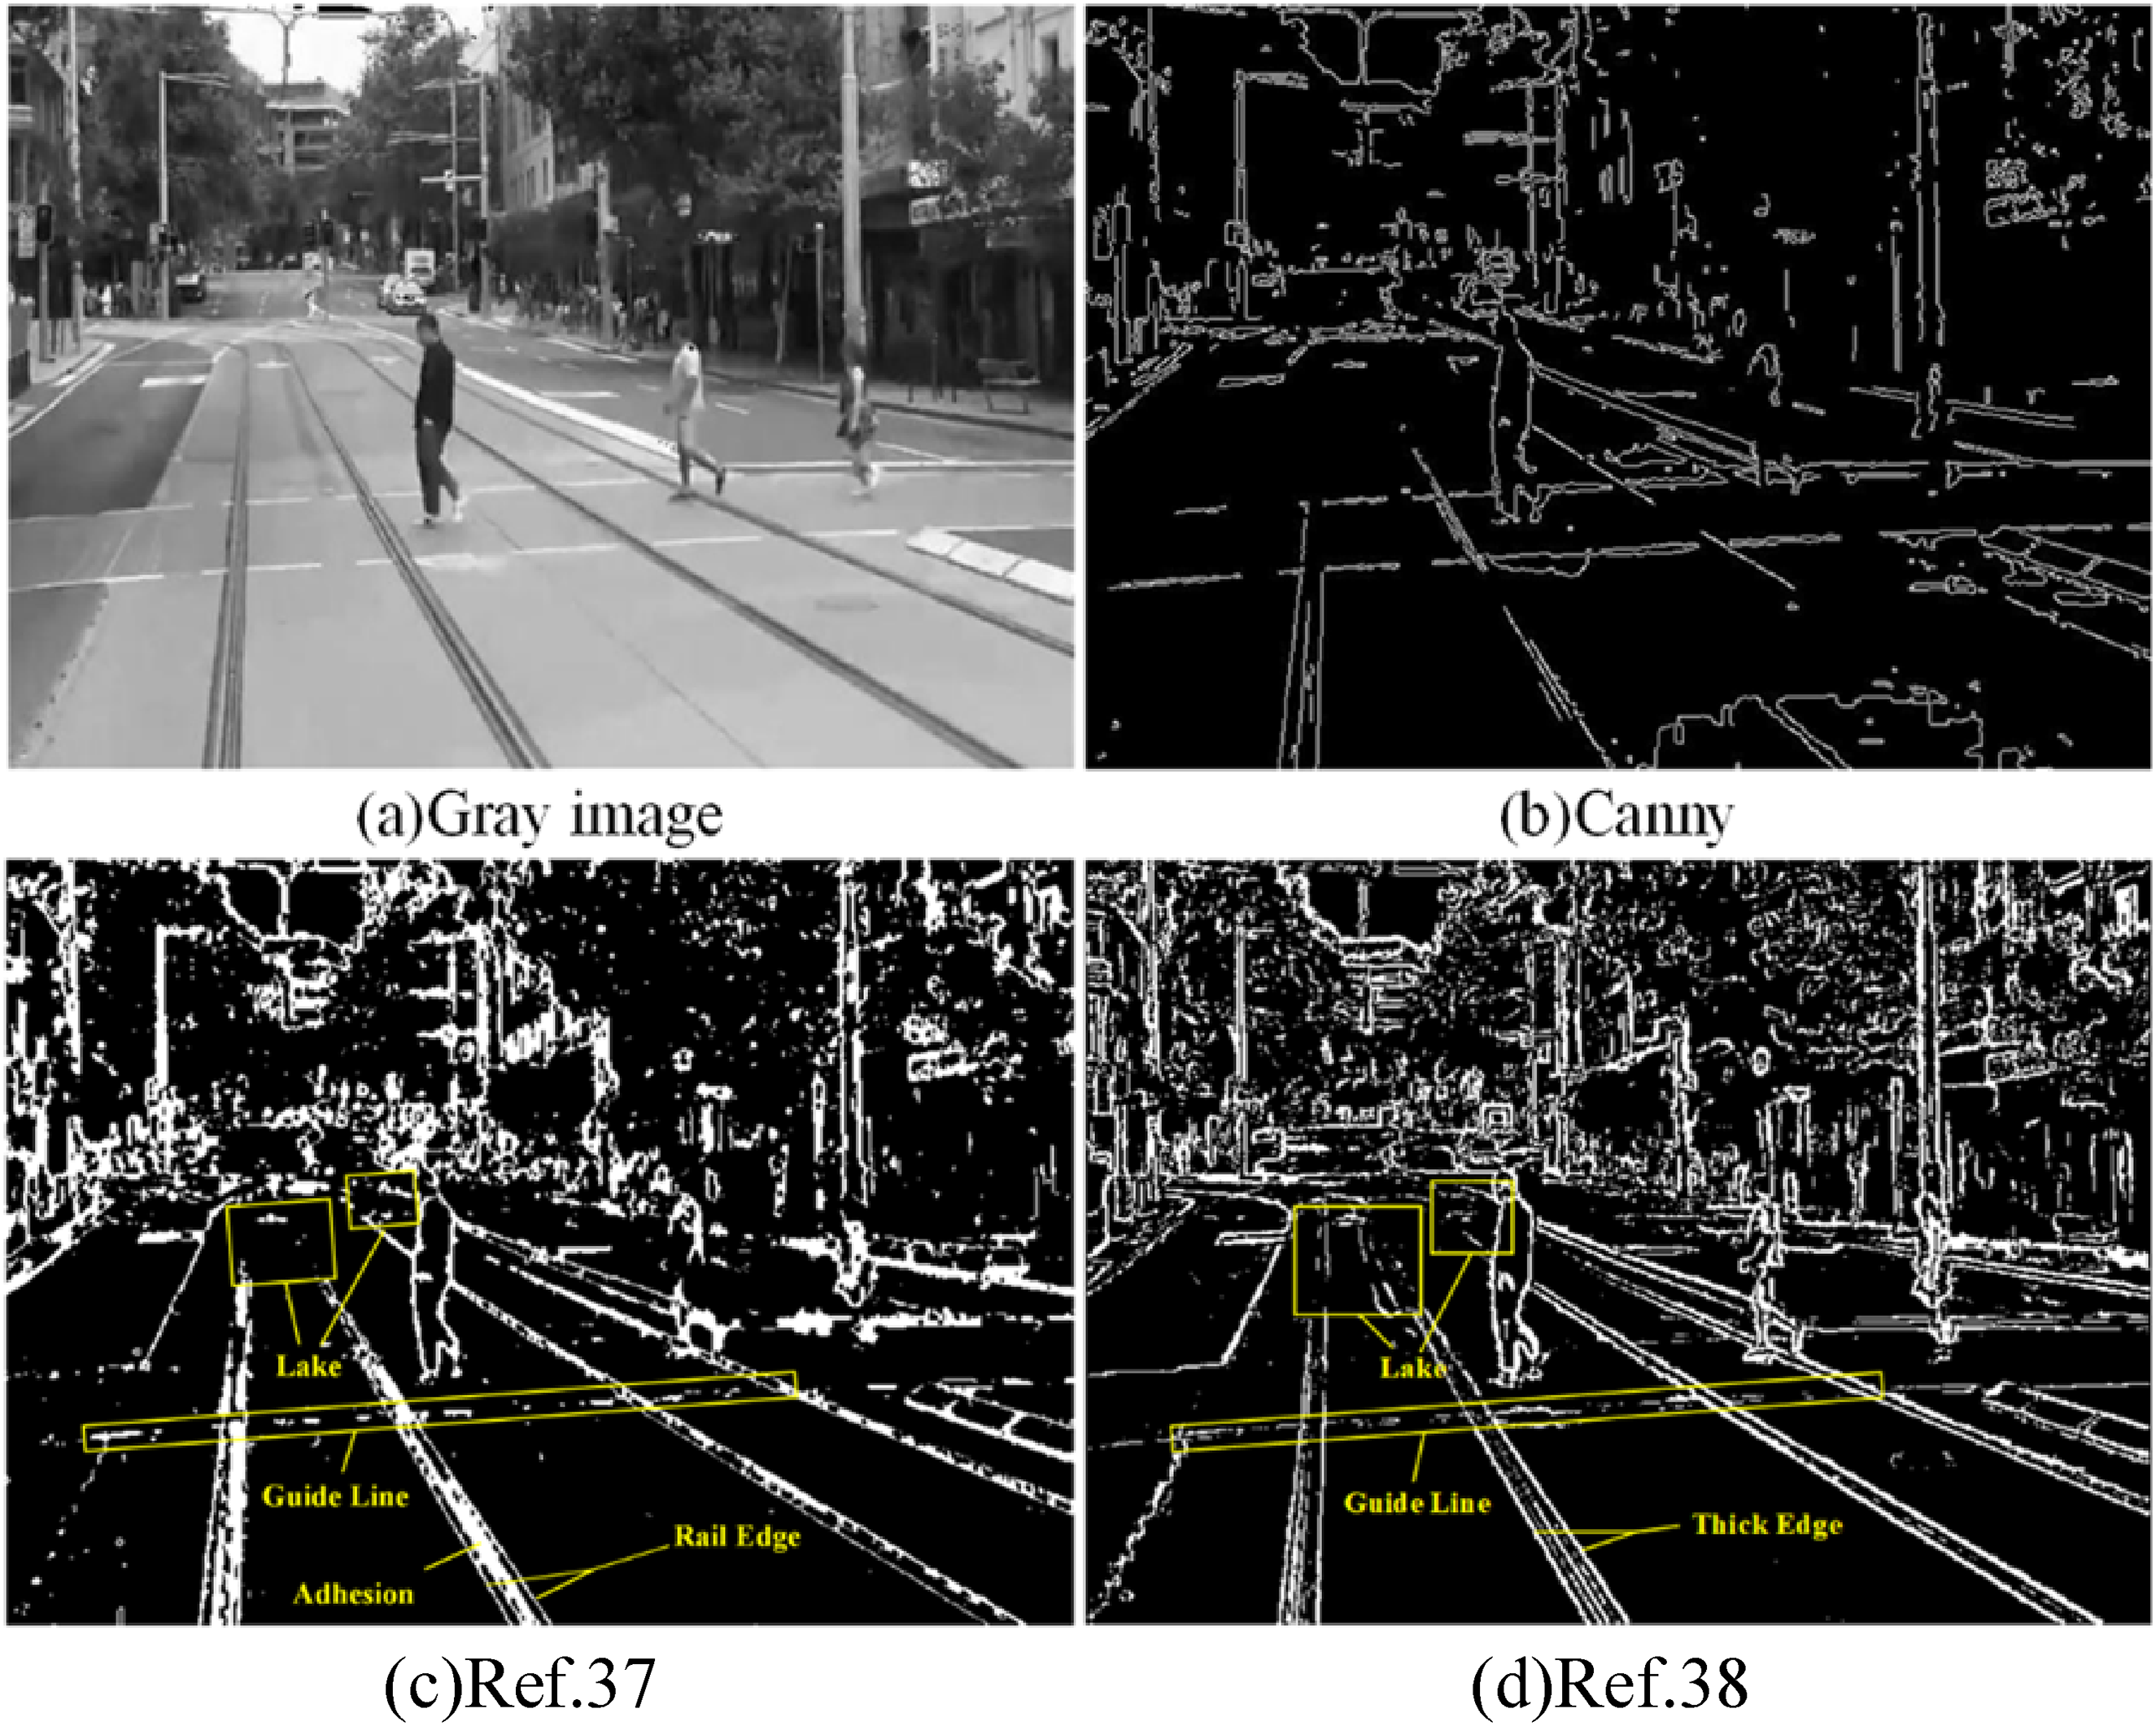
Rail edge images obtained through different methods.
Self-adaptive rail edge detection algorithm for trams based on morphology
Considering the limitations of the current algorithms, this study proposes a self-adaptive morphological rail edge detection algorithm for trams based on the algorithm in Ref.
38
The gradient values of the pixels in the four directions of 0°, 45°, 90°, and 135° were calculated using equation (8). In

To improve computational efficiency, the RGB image is transformed into a gray image according to equation (10). There are five tones in a grayscale image: black, shadow, midtone, highlight, and white. Figure 2 shows a gray image of the three-level crossing scenes in the trams. The brightness of the rail is lower than that of the road surface. To reduce the impact on rail-edge identification, the white and highlighted tones in the image were deleted. Figure 3 shows the method used to eliminate whites and highlights to create a low-tone image. This process converts the guide line and road shoulder to black.

Three level crossing scenes in the trams.
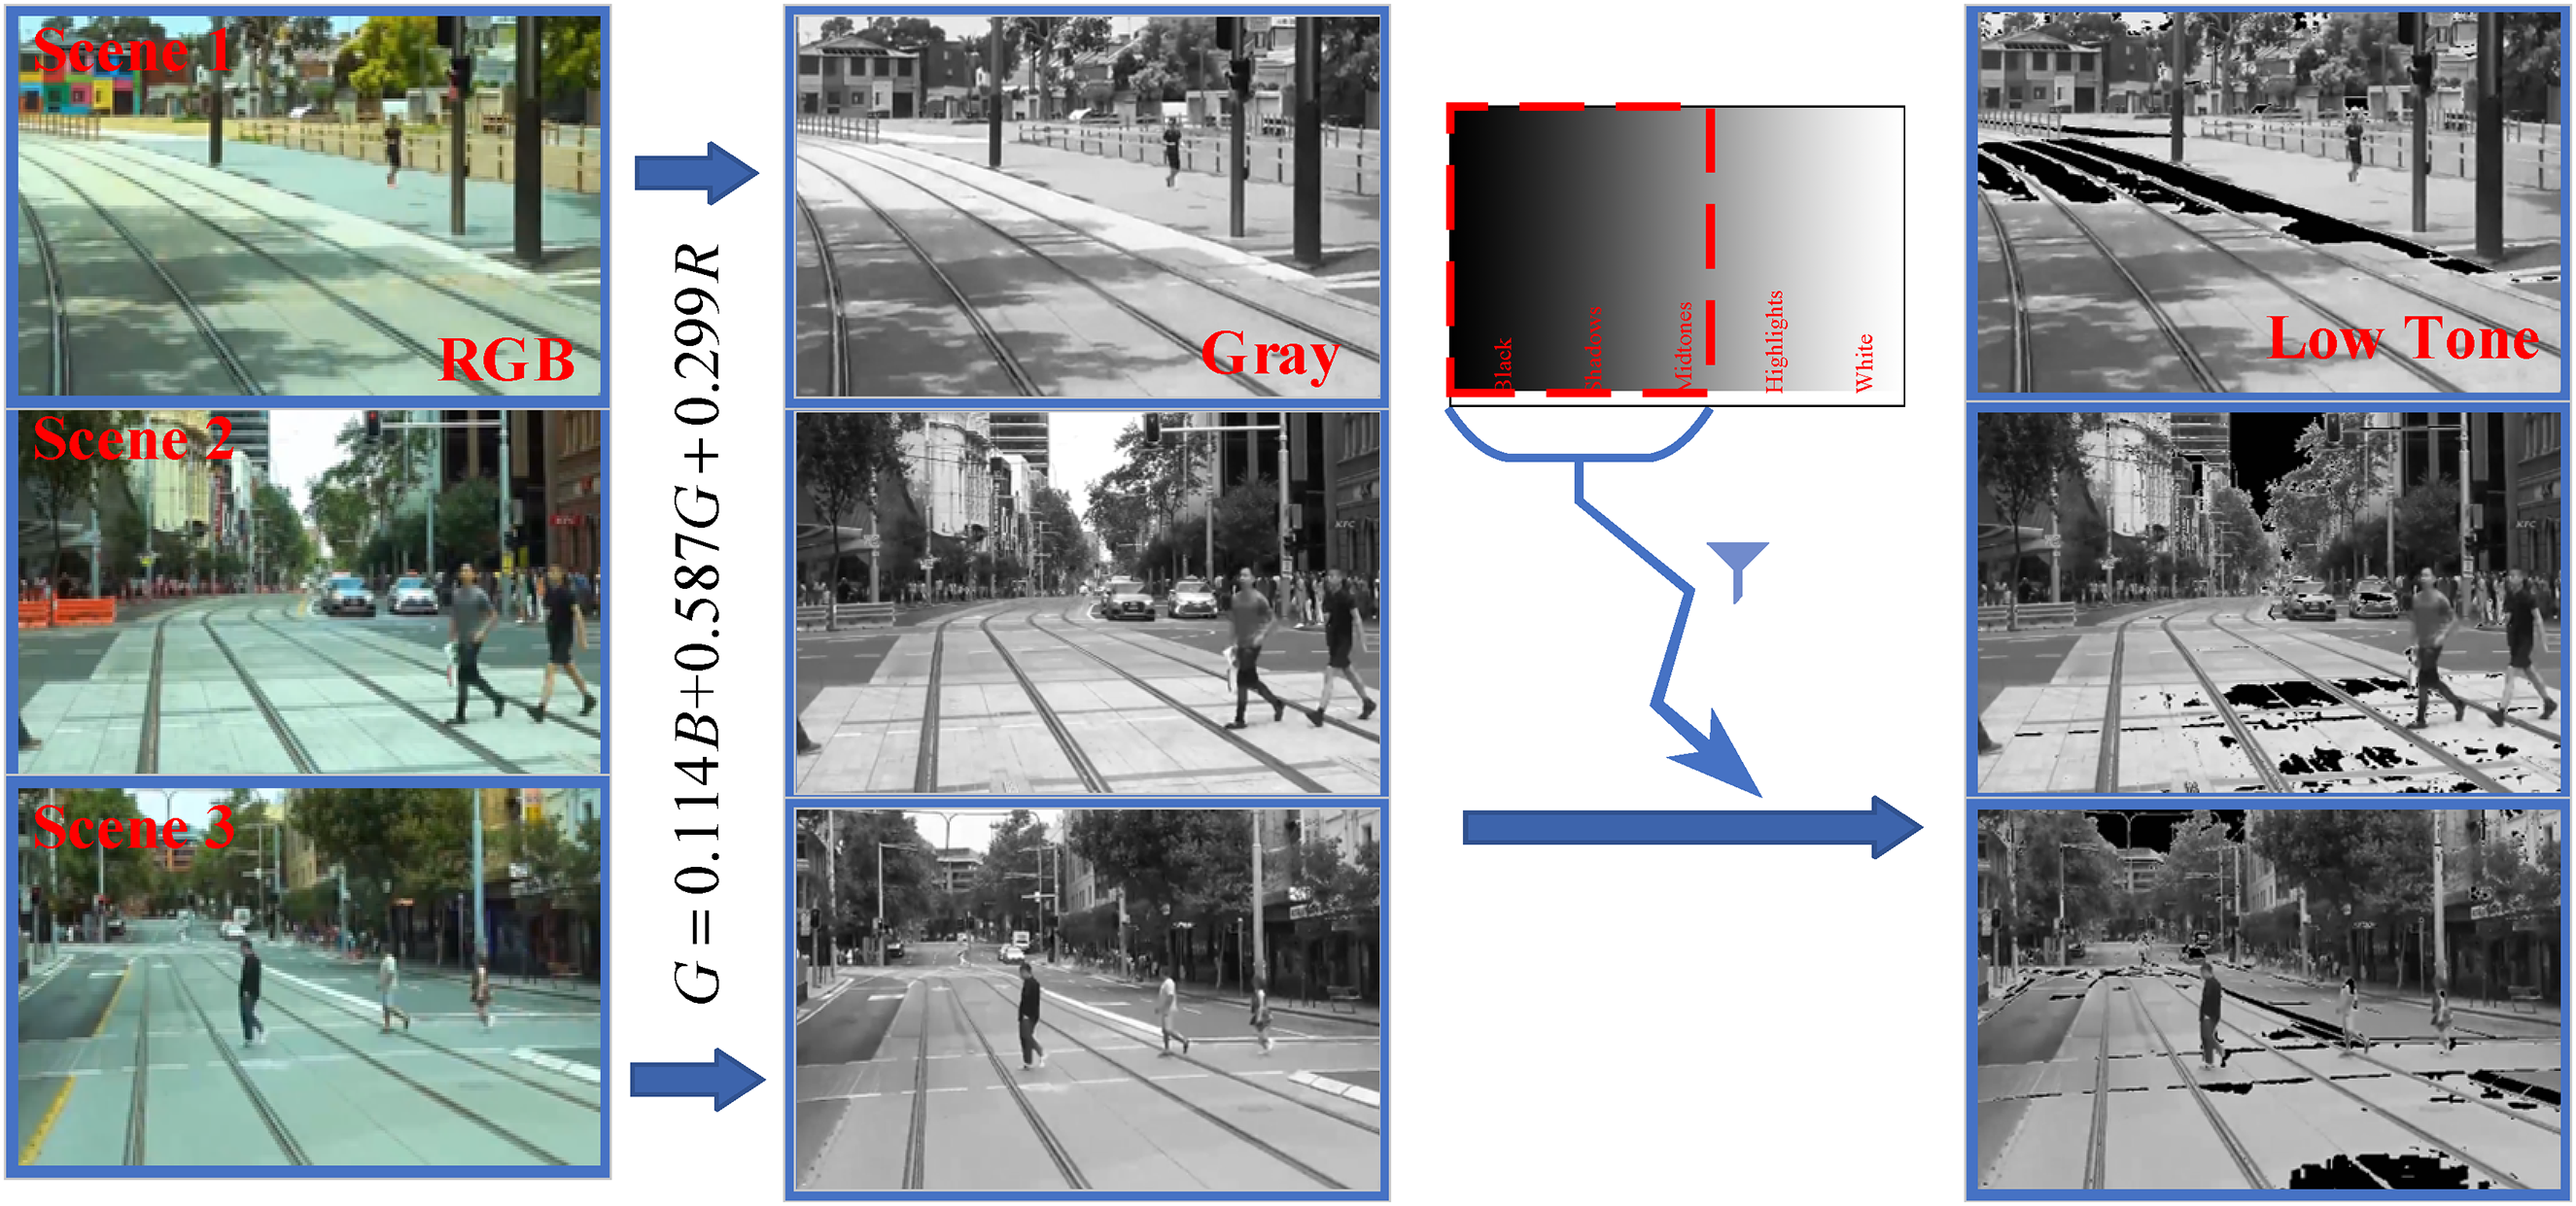
Methods used to obtain the low tone images.

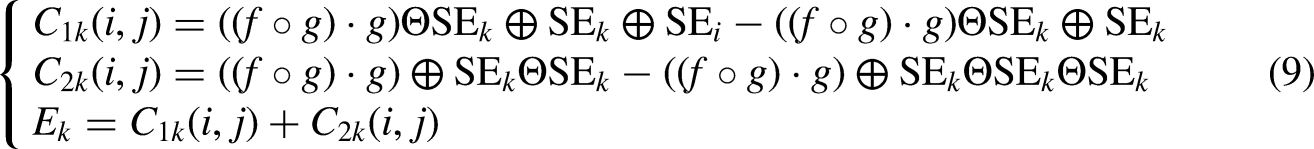
The four structuring elements E1–E4 of the edge image shown in Figure 4 were calculated using equation (9). In Figure 4, the gray value of the rail edge is low, and the position with a high gray value is replaced by a highlighted and white-edge region, as shown in Figure 3. Removing the high gray values can effectively reduce the influence of the transition part of the edge of the highlight and white tones.

E1 (upper left), E2 (upper right), E3 (lower left), E4 (lower right).
Equation (8) was used to calculate the gradient values of each pixel in Figure 3 in the four directions. The direction corresponding to the maximum gradient value was considered the gradient direction of the pixel. If the size of the image was W × H, the obtainedW × H pixel gradient directions were counted, and the first two gradient directions with the largest numbers were used as the two gradient directions, m, n of the image. To reduce the interference of the contour lines with higher gray values (such as those in Figure 4), a threshold T2 was set. If E1–E4 are smaller than T2, the final edge detection images are
For example, the image shown in Figure 3 (Scene 3) has a resolution of 700 × 500; the number of pixels with a gradient direction of 0° is 116,631, the number of points with a gradient direction of 45° is 131,826, the number of points with a gradient direction of 90° is 41,281, and the number of points with a gradient direction of 135° is 60,262 after the calculation. Therefore, the proportion of pixels in the gradient direction in the image was sorted as follows: 90° < 135° < 0° < 45°. We considered 45° (m = 2) and 0° (n = 1) to be the two gradient directions of the image. Set the threshold T2 = 100 and compare E1–E4 at pixels
The selection of the threshold T2 is particularly significant for edge detection results. To obtain T2, Figure 5 shows the statistical results of obtaining a histogram of the gradient distribution of

Histogram statistical results.
Figure 6 shows the edge detection results for Scene 3. The gray value of the rail edge was low, and the edge was thick and difficult to observe. Some rail outlines were thick with attached or missing edges. Owing to the aforementioned drawbacks, NMS was used to improve the edge by locating a local maximum value in the gradient direction to reflect the gradient response in the gradient direction, as shown in Figure 7. In the
Edge detection result.

NMS diagram.
Meanwhile, the double-threshold screening method was used to screen the edges to reduce their adhesion and compensate for missing edges. In this study, the lower-threshold TL and higher-threshold TH were considered. The gray value of the image lower than the lowest threshold of TL is assumed as zero. If the image gray value was higher than the highest threshold of TH, the gray value was set to 255. Pixels below the highest threshold, TH, and those above the lowest threshold, TL, were determined using eight connected regions. If the
The steps of the algorithm developed in this study can be summarized as follows:
Convert the RGB images into gray images and set the threshold T1 to obtain low-tone pixels in the images. Combined with equation (8), the gradient direction of each pixel of the low-tone image in the 0°, 45°, 90°, and 135° directions was calculated, and the maximum value was considered as the gradient direction of the pixel. Count the number of gradient directions of all pixels in the image, arrange them in order from large to small, and take the first two gradient directions as the two gradient directions m and n of the image of the station, representing 0°, 45°, 90°, and 135°. Equation (9) was used to calculate Set the threshold as T2. If The final edge detection result can be obtained by combining non-maximum suppression and double-threshold screening to refine the edge and make it coherent.
To evaluate the performance of the proposed algorithm, the mean square error (MSE) was used to evaluate the accuracy of the edge images, and the peak signal-to-noise ratio (PSNR) was used to quantitatively estimate the quality of the edge images. The equations for the MSE and PSNR are as follows: In equation (11), W and H represent the height and width of the image, respectively, f represents the original image,


Results
Track edge detection for new algorithm
In this study, a computer with the configuration of I5-7200U CPU, 8 GB RAM, and Python 3.8.5, a version of the machine algorithm, was used. The detection results for Scene 3 were obtained using the NMS and double-threshold screening methods, as shown in Figure 8. The rail edges identified by the algorithm in this study were further compared with those in Figure 1(b), (c), and (d) obtained by other algorithms described in the publications. The results show that the rail's edge, identified by the algorithm in this study, was thin, and the rail was complete. In addition, the adhesion of the obtained result was low, and the background environment contour line interference was minimal for the white guide line, road shoulder, and building. Compared to the results obtained by Refs.37,38 the algorithm developed in this study can significantly increase the PSNR up to 5.58 while decreasing the MSE value to 17,975.36.

Detection results of the algorithm in this paper.
Similarly, the algorithm was used in rail edge detection for Scenes 1 and 2, as shown in Figures 9 and 10. The traditional Canny method can result in a discontinuous rail edge, while the algorithm in 37 was identified to have severe adhesion for the track area, and the algorithm in 38 could result in a thick track edge. Moreover, the guideline was observed in the results obtained using the current method, which was unexpected for track-edge detection.

Algorithm comparison of detection results in scene 1.

Algorithm comparison of detection results in scene 2.
Influences of noise on the track-edge detection
Current investigations have shown that discrete pulse, salt-and-pepper noise, and zero-mean Gaussian noise can significantly impact images 39 This noise poses significant challenges in image processing and feature extraction, image segmentation, and image recognition. To demonstrate the proposed method's robustness of the proposed method, the effect of noise on track-edge detection was investigated. In this study, Gaussian noise with a mean value of 0 and variance of 10 was added to the image, as well as 10% salt-and-pepper noise, to test the anti-interference ability of the proposed algorithm in detecting rails under various types of noise. The photograph from Scene 3 was considered. Figures 11 and 12 show the effects of salt-and-pepper and Gaussian noise on track edge detection results for the four methods.

Detection results considering salt and pepper noise.

Detection results considering Gaussian noise.
Figures 11 and 12 show that the Canny algorithm and the detection algorithm in Ref. 37 are not specified for rail edge detection. Therefore, these methods are ineffective at extracting the rail edge under the effects of different noises. Compared to Figure 11(c) and (d), the algorithm presented in this study shows excellent performance in the anti-interference of salt-and-pepper noise. Although the accuracy of the proposed algorithm is affected by Gaussian noise, this method can still produce continuous track edge detection when compared to the algorithm presented in. 38
Regarding the evaluation performance among the four methods, Figure 13 shows that the algorithm in this study produced the lowest MSE value in the presence of salt-and-pepper noise. Although the Canny method produced the lowest MSE value in the presence of Gaussian noise, it missed some critical information for track-edge detection. Compared to the results obtained in, 38 the algorithm developed in this study produced a relatively smaller MSE and lower computational cost. These results suggest that the proposed algorithm can significantly improve track edge detection accuracy while incurring a low computational cost.

Evaluation performances in the presence of noise.
Conclusion and discussion
Track edge detection is crucial for ensuring the operating safety of trams, particularly at level crossing areas. Therefore, this study developed a self-adaptive rail-edge detection algorithm for trams based on morphology. The following conclusions may be drawn. (a) Traditional edge detection algorithms are not designed for railways, which require a very different approach to characterizing the track edges. These methods were affected by the fasteners and sleepers in the photo, resulting in a poor detection of the track edge. The traditional Canny method cannot produce continuous track-edge detection; the methods presented in current publications are subject to adhesion and thick edges in track edge detection. Moreover, the track's guide lines can affect the edge-detection results. (b) Compared to current methods, the proposed methodology for track-edge detection can produce better detection results, regardless of image noise. This method can be used in early warning systems of trams to avoid collision accidents.
It should be noted that the algorithm in this study can improve the accuracy of the rail-edge location and address a few issues with the algorithm's detection results; however, the computational cost remains high, making the proposed method difficult to implement in real time. In the future, convolutional neural networks (CNN) could be integrated into the track edge detection algorithm. In addition, the transparency and interpretability of these algorithms outperform those of some black-box natural deep-learning models, making them more appealing for safety-critical applications. Future research could consider combining the morphological method proposed in this study with modern deep-learning techniques to form a hybrid method. This method can take advantage of deep-learning's high accuracy and morphological algorithms’ robustness to improve computational efficiency and detection accuracy. Simultaneously, as hardware performance improves and parallel computing technology advances, the problem of high computing costs may be gradually alleviated, allowing for real-time application of these algorithms.
Footnotes
Acknowledgements
The author sincerely appreciates the help provided by the research team (Wheel/rail interaction, Vibration and Noise Research Team) and CRRC. In addition, this study has also been supported by China Association of Science and Technology Young Talent Support Project (No. 2019QNRC001), Sichuan Science and Technology Program (No.2023NSFC0374, No.2022NSFSC0469 and No.2024NSFSC0187), the Science and Technology Research Plan of China Railway General Corporation (No. N2022J009), and Fundamental Research Funds for the Central Universities (2682024CG007).
Author contributions
Shizhong He did investigation; methodology; writing the original draft. Longjiang Shen did supervision; writing—reviewing and editing. Zuobing Zhou and Aolin Gao performed writing—reviewing and editing. Xingwen Wu did funding acquisition; supervision; writing—reviewing and editing. Each of the authors approved the version to be published.
Declaration of conflicting interests
The authors declared no potential conflicts of interest with respect to the research, authorship, and/or publication of this article.
Funding
The authors disclosed receipt of the following financial support for the research, authorship, and/or publication of this article: This work was supported by the Fundamental Research Funds for the Central Universities, China Association of Science and Technology Young Talent Support Project, Sichuan Science and Technology Program, The Science and Technology Research Plan of China Railway General Corporation (grant number 2682024CG007, No. 2019QNRC001, No.2023NSFC0374, No.2022NSFSC0469 and No.2024NSFSC, N2022J009).