
Abstract
To solve the problem of uneven dust cleaning in filter cartridges, a simple and easy-to-install “branch-type” nozzle structure was designed to improve cleaning efficiency. In this study, numerical simulations, range analysis methods, orthogonal experimental design, back-blowing experiments, and powder cleaning experiments were conducted. By choosing the back-blowing uniformity as the evaluation index for cleaning performance, with the flow distribution coefficient A, length of branch pipe B, and outlet diameter of main pipe C as the factors, and ignoring the interaction between factors, an orthogonal experiment was designed to simulate the fluid flow field of nine different nozzle structures installed in the back-blowing model. The results were analyzed using range analysis methods, and the optimal nozzle structure parameter combination was determined to be A = 50%/40%/10%, B = 70 mm, and C = 18 mm. Based on the back-blowing experiment, the accuracy of the simulation results was verified, and the back-blowing uniformity was improved by 50.12%. In the powder cleaning experiment, a new method of measuring the mass of dust shaken off by a single pulse of cleaning to calculate the residual dust on the filter cartridge, rather than removing the filter cartridge and weighing it, was found to reduce experimental errors and make the conclusions more solid and convincing. The results showed that the “branch-type” nozzle increases the cleaning efficiency by 37.6% compared with no nozzle installed, proving that the “branch-type” nozzle can reduce the number of reverse cleaning required and extend the cleaning interval, thus optimizing the cleaning performance of the dust collector.
Introduction
Dust-cleaning performance is an important aspect of the filter cartridge dust collector, which is crucial in global air pollution control. Many types of atmospheric pollutants are present, among which the most harmful to human body is the suspended particle—also known as dust—with diameters in the range of 0.002–100 μm. People who inhale dust for a long time may suffer from chronic bronchitis and cardiovascular diseases, particularly the elderly,1–3 and studies have shown that particulate pollutants such as PM2.5 and PM10 negatively impact ovarian reserve and sperm quality, easily leading to infertility.4,5 Therefore, as an efficient environmental protection equipment for handling suspended dust particles, improving its dust-cleaning performance is of paramount importance.
Filter cartridge dust collectors have several advantages, such as a small footprint, low cost, and high efficiency, and can be used in construction, mining, battery manufacturing, metal smelting, 3D printing, and many other industrial manufacturing fields. 6 The filter cartridge serves as the key dust removal unit and plays a role in filtering during the operation of the filter cartridge dust collector. As the filtration time increases, dust accumulates on the surface of the filter cartridge to form a dust cake, which increases the filtration resistance. Therefore, regular cleaning of the filter cartridges is necessary. Existing dust-cleaning methods include mechanical cleaning, pulse back-blowing, and ultrasonic cleaning; the most widely used method is pulse back-blowing. 7
The quality of the dust-cleaning effect is a manifestation of the dust-cleaning performance. For most filter cartridge dust collectors, the problem of uneven filter cartridge dust removal remains during the process of back-blowing, which is mainly reflected in insufficient cleaning of the upper part of the filter cartridge, resulting in dust cake gathering and excessive cleaning of the bottom part, which can easily damage the filter material. 8
An evaluation index is required to evaluate the quality of the dust-cleaning effect, which is derived from the corresponding dust-cleaning theory. This theory has the following three main views:
Reverse acceleration: This view holds that for elastic filter materials, dust particles adhere to the filter material surface owing to intermolecular, electrostatic, and capillary forces. The reverse acceleration of the back-blowing airflow when the filter material expands outward to its farthest position under the inertial force of the jet can cause dust particles to detach from the filter material.9,10 Qian et al.
11
experimentally proved that reverse acceleration is an important factor affecting dust-cleaning efficiency. Back-blowing velocity: According to this view, the filter cartridge is a porous medium with a high porosity rate, and the high flow velocity of the back-blowing airflow drives the dust to fall off the filter material.
12
However, Qiu et al.
13
pointed out through CFD calculations and experiments that in the early stage of dust collector operation, owing to the small amount of dust accumulation and low adhesion force, the back-blowing airflow can easily pass through the gap between the filter material and the dust layer, and the back-blowing velocity plays a dominant role. However, as the amount of accumulated dust increases and the dust layer thickens, the adhesion force increases, and the effect of the back-blowing velocity becomes insignificant. Peak pressure: This view considers the filter cartridge as a porous medium. During the back-blowing process, high-pressure air flows out at supersonic speeds, and the jet enters the filter cartridge and acts on the inner wall of the filter cartridge, impacting the inner wall of the filter cartridge and the filter material. At this time, the dynamic pressure of the back-blowing air is converted into static pressure, which determines the resistance of the filter material and dust layers to the passage of airflow. When the resistance is greater than the adhesion force between the dust and filter material, the dust can be cleaned successfully. Leubner et al.
14
studied the characteristic parameters of dust removal and concluded that the maximum pressure on the inner wall of the filter cartridge plays a decisive role in the dust-cleaning effect. Ju et al.
15
verified this view using a high-speed dynamic analyzer to photograph the process of dust falling off a filter cartridge during dust cleaning.
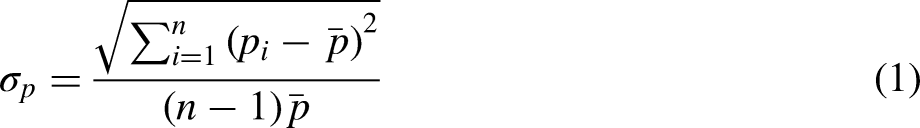
Because the filter cartridge is a rigid element, it is not suitable to use the reverse acceleration as the evaluation standard. The peak pressure on the inner wall of the filter cartridge is easy to measure; therefore, it is often used to calculate the back-blowing uniformity, which is used as an evaluation index. The back-blowing uniformity equation is given as follows (1):

Many researchers have attempted to install additional structures in the original nozzle position of back-blowing dust-cleaning systems to solve the problem of uneven dust cleaning of the filter cartridge. Wang et al. 18 used the upper opening scatter to improve the dust-cleaning effect. Compared with the nondiffuser, the pressure on the upper sidewall was increased by 53.7%, and that on the lower part was reduced by more than 32.5%. Liu 19 increased the peak pressure on the upper sidewall of a filter bag from 339 to 683 Pa by optimizing the width of the scatter. Shu 20 designed a spindle scattering structure with an increasing diameter and upper opening scatter, increasing the injection distance from 120 to 180 mm. These structures have achieved certain effects in improving the uniformity of the pressure distribution inside the filter cartridge; however, they also have problems, such as a complex structure, high processing cost, and difficult installation. Furthermore, these experiments are dust-free and cannot directly demonstrate the extent of improvement in dust-cleaning performance. Li 21 conducted a powder-coating cleaning experiment with a flat-box cartridge filter and found that a low jet pressure (0.1 MPa) could realize an efficient operation of the dust removal system when the filter flow velocity was no more than 0.6 m/s. Zhang et al. 22 conducted a powder-coating cleaning experiment using a rectangular flat pleated filter. By changing the number and diameter of the injection ports, they reduced the residual mass of the dust from 310 g to 210 g, an improvement of 47.6%. However, when the residual dust mass on the filter cartridge was measured, the filter cartridge was removed from the dust collector, weighed, and installed. During this process, some dust particles fell off the filter cartridge, causing experimental errors. Therefore, a new, simple, low processing cost, and easy-to-install “branch-type” nozzle structure is designed to improve the cleaning efficiency.
In this study, a new method to measure the residual dust on the filter cartridge without removing it from the dust collector was designed. This method involves collecting the dust shaken off from the filter cartridge by a single pulse of cleaning and weighing it such that the mass of the residual dust can be calculated. Numerical simulations and experiments were conducted using a conventional filter cartridge back-blowing process. The optimal nozzle structure parameters combination was determined through orthogonal experimental design 23 and range analysis methods,24,25 and the simulation results from back-blowing experiment were verified. Finally, the proposed method was used to conduct the powder-coating cleaning experiment with a “branch-type” nozzle and the improvement in cleaning performance was verified.
Numerical simulation and experiment
In this study, the pulse back-blowing system of the filter cartridge dust collector consisted of a back-blowing chamber and a filter cartridge chamber. The two chambers were sealed and separated by using a support plate. The diameter of the nozzle was 30 mm, and the distance between the nozzle and the filter cartridge was 134 mm. The height of the filter cartridge was 330 mm, the inner diameter was 240 mm, the outer diameter was 325 mm, and the filter paper used was a PTFE-coated filter paper. A filter cartridge was fabricated with fewer folds on one side to increase the pressure-sensing area, and a steel support frame was added to fix the pressure sensor.
The support frame had four monitoring points, A, B, C, and D, which were 30, 120, 210, and 300 mm above the top of the filter cartridge, respectively. The pressure sensors were sealed in a steel support frame using threaded connections. The pulse back-blowing experimental platform is illustrated in Figure 1.

Pulse back-blowing experimental platform.
Construction of the back-blowing model
Owing to the complex structure of the dust collector, the following simplifications were made to the back-blowing model to facilitate numerical simulation:
The injection pipe was ignored, the nozzle structure was simplified to a cylinder, and the 3D model was centered on the axis of symmetry of the nozzle, back-blowing chamber, and filter. The pulse back-blowing airflow was assumed to be a compressible, isothermal, and ideal gas, uniformly sprayed perpendicular to the filter cartridge from the nozzle, with constant back-blowing pressure during a single-pulse back-blowing process. The pulse back-blowing time is extremely short and difficult to simulate. Therefore, the opening and closing processes of the nozzle controlled by the impulse valve were not considered, and the back-blowing process was assumed to be a steady-state constant flow. The collection device at the bottom of the filter cartridge chamber was ignored. The outer sidewall of the filter is set at the outlet. Because the pleat filter material structure is complex, if an actual model is built, the number of mesh elements and calculation volume will increase sharply. Therefore, the filter model was simplified to a smooth cylindrical surface, as shown in Figure 2.

Simplified back-blowing model.
Boundary condition setting
The airflow was turbulent during the back-blowing process. According to the above simplification, the back-blowing cleaning process was set as a steady-state gas flow. The turbulence model chosen was the Realizable k-ε model, which satisfies the three conservation laws, namely, the mass conservation law (continuity equation), momentum conservation law (momentum equation), and energy conservation law.26,27 The specific equations are as follows:
The continuity equation is given by:

The momentum equation is given by:

In the realizable k-ε model, the turbulent kinetic energy k and the turbulent dissipation rate ε are, respectively, given by equations (5) and (6):


Considering simplified conditions and conservation laws, the turbulent kinetic energy and turbulent dissipation rate were set to their default values. The solver was selected using a density-based approach. The solver algorithm was selected as the coupled algorithm. The inlet of the nozzle was set as the pressure inlet boundary, and the gauge pressure was constant at 0.4 MPa. Below the nozzle and above the filter cartridge was a cylindrical back-blowing chamber. The outer side wall of the cylinder was an external system and was set as the pressure inlet boundary, and the gauge pressure was set as 0 MPa. The outer side wall of the filter was set as the pressure outlet boundary with a gauge pressure value of 0 MPa. The side walls of the nozzle, top of the back-blowing chamber, circular surface where the top of the filter contacts the back-blowing chamber, and bottom of the filter were all designed with nonslip wall surfaces. The inner wall of the filter was set with a porous jump, and the porosity was set to 0.82. The other fluid-passing interfaces were set as interior surfaces, and the entire computational domain was set as the fluid.
Grid division and independence test
Considering that the model is a centrosymmetric structure, to facilitate grid division and reduce computational costs, it was divided into 1/4 with the cutting planes set to the symmetry surfaces. The domain was divided into quadrilateral grids by sweeping, and the number of grid nodes increased at locations near the nozzle where the velocity gradient was larger.
A grid independence test must be performed on the model to determine the maximum grid size that satisfies the computational accuracy. By continuously reducing the grid size and increasing the number of grids, the same parameter settings were used for trial calculations, and a physical parameter within the flow field was selected as the reference. When the trial calculation results had an error of less than 5%, the maximum grid size that satisfied the computational accuracy was found.
With the boundary conditions set as described above, the pressure value at monitoring point D was selected as a reference for comparison, and the results are listed in Table 1.
Influence of grid settings on the back-blowing model monitoring point.

When the maximum grid size was 4 mm and the number of grids exceeded 982,000, the error was less than 5%, satisfying the numerical simulation calculation accuracy requirements of this study. Therefore, in all the simulation calculations in this study, to ensure the accuracy of the calculation results, the maximum grid size of the model was not greater than 4 mm, and the number of grids was greater than 982,000. The grid size in the densely populated area was set to 1 mm, and uniform transition of the entire model grid from the densely populated area to the surrounding less densely populated area was ensured. The grid diagram is shown in Figure 3.

Grid diagram.
Results analysis
The pressure distribution cloud image of the inner side wall of the filter cartridge obtained through numerical simulation is shown in Figure 4, with a pressure range of −500 to 5000 Pa. The simulation results show that nearly half of the inner side wall of the filter cartridge (from top to bottom) had a peak pressure of less than 500 Pa, indicating a larger area with insufficient cleaning. At the bottom, the peak pressure suddenly increased, and the distribution of the cleaning pressure on the inner side wall of the filter cartridge was extremely uneven. The back-blowing uniformity index was calculated as 0.932, indicating poor back-blowing uniformity.

Pressure distribution cloud image of the inner side wall of the filter cartridge.
A conventional filter cartridge back-blowing cleaning experiment was conducted on the pulse back-blowing experimental platform shown in Figure 1. The experimental results were compared with the simulation results shown in Figure 5. The experimental values are consistent with the simulation results; at monitoring points A, B, C, and D, the error was 9.4%, 7.6%, 5.0%, and 2.2%, respectively. The error decreases as the measured peak pressure gradually increases. Owing to the simplification of the model, errors between the experimental and simulation values are inevitable; however, all of these errors are within the acceptable range. Therefore, the simplified simulation model can replace many repetitive experiments and predict the peak pressure distribution on the inner side wall of the filter cartridge under different operating conditions.

Comparison between experimental results and simulation values.
“Branch-type” nozzle design and simulation
Structural design
A “branch-type” back-blowing nozzle structure was designed in this study, which consists of a main pipe and two rows of branch pipes on the side of the main pipe. Four branch pipes were present in each row, and the upper and lower rows were staggered at 45°. Its main feature is to ensure the consistency of the cleaning pressure at the same height as the filter cartridge and the uniformity of the overall peak pressure distribution on the inner wall of the filter cartridge. The branch pipes play a role in dispersing and guiding the reverse-blow airflow such that the airflow flows through the branch pipes to clean the underside of the filter cartridge where cleaning is insufficient. The upper row of branch pipes mainly cleaned the upper part of the filter cartridge, whereas the lower row of branch pipes mainly cleaned the middle part of the filter cartridge. The cross section of the main pipe gradually decreased, and the centerline of the outlet at the bottom was aligned with the centerline of the filter cartridge, with the remaining airflow flowing out through the outlet of the main pipe to clean the bottom, thereby achieving the effect of reducing the cleaning pressure distribution at the bottom. The schematic of the “branch-type” nozzle structure is shown in Figure 6, with unit dimensions in millimeters.

“Branch-type” nozzle structure.
Orthogonal experiment design
Orthogonal experimental design is an optimization method that effectively reduces the number of experiments required. It uses orthogonal tables to arrange experiments reasonably and can be used to study multifactor systems. 23 To obtain the optimal structure for improving the uniformity of back-blowing and enhancing the dust-cleaning effect, this study selected factors A (flow distribution coefficient, which consists of the ratio of the upper row of branch pipe flow to the lower row of branch pipe flow to the main pipe flow), B (length of the branch pipe), and C (diameter of the outlet of the main pipe), and the uniformity index as the evaluation standard. According to the orthogonal experimental design, a three-factor, three-level orthogonal design table was created, ignoring the interactions between the various factors. A total of nine filter cartridge back-blowing cleaning models were established, each with a different “branch-type” nozzle structure installed. Table 2 lists the factor parameters, and Table 3 lists the combinations of the simulation experiments.
Factor parameters.

Factor-level combinations in simulation experiments.

Simulation results and analysis
The following results were obtained by conducting numerical simulation experiments on the back-blowing model with nine different “branch-type” nozzle structures installed, following the model simplification and boundary condition setting described earlier.
Figure 7 shows the pressure distribution cloud image of the inner side wall of the filter with different “branch-type” nozzles. To enable the comparison with the numerical simulation experiments of conventional back-blowing cleaning, the pressure range was set to −500 to 5000 Pa. After installing the “branch-type” nozzles, the overall pressure distribution in the filter cartridge was uniform in the lower part, and the direct airflow to the bottom of the filter cartridge was reduced by the diversion effect of the branch pipe. Two rows of branch pipes sprayed the upper and middle parts of the filter cartridge separately. Although this will affect the uniformity of the filter cartridge in the radial direction, it generally improves the peak pressure of cleaning in the upper and middle parts of the filter cartridge and improves the cleaning effect in this area. We defined the direction the upper row of branch pipes faces directly as direction 1 and the direction the lower row of branch pipes faces directly as direction 2.

Pressure distribution cloud images of the inner side wall of the filter with different “branch-type” nozzles.
The peak pressure distribution curves of the two rows of branch pipes facing directions 1 and 2 are shown in Figure 8. In direction 1, approximately 100–330 mm above the top of the filter cartridge, the peak pressure on the inner side wall was mainly distributed in the range of 1000–3000 Pa, which was suitable for cleaning, and the distribution was relatively uniform. At the top of the filter cartridge, a large pressure peak was observed on the side wall opposite the branch pipe owing to direct jetting, ranging from 8000 to 14,000 Pa. In direction 2, the peak pressure on the inner side wall in the lower half of the filter cartridge was mainly distributed within the range of 2000–4000 Pa. The cleaning pressure satisfied the requirements, and the distribution was relatively uniform. In the range of 100–200 mm, the peak pressure distribution uniformity of the nozzle structure corresponding to experiments 1–4 was best, followed by experiments 5 and 9 and experiments 6–8 being the worst, with a peak pressure range of 4000–6000 Pa.

Peak pressure distribution curve for direction 1 and direction 2.
The back-blowing uniformity index was calculated based on the simulation results. Because the back-blowing uniformity indices in directions 1 and 2 were of equal importance, the results for both directions were weighted at 50% for the calculation. σp1 represents the back-blowing uniformity index in direction 1, and σp2 represents the back-blowing uniformity index in direction 2; σp = (σp1+σp2)/2.
Table 4 presents the calculated results. Experiment 2 achieved a better uniformity index. The range analysis method was used to compare the impact of each factor on the back-blowing uniformity index results. The optimal factor-level combination was then selected.
Results of the back-blowing uniformity index for the simulation experiment.

Range analysis of the back-blowing uniformity index.

The range analysis method was as follows: Presumably, n main influencing factors (A, B, C…) exist, each with m levels, and the total number of experimental trials was N. Xijk represents the value of the i-th level of the j-th factor in the k-th experiment, j is the j-th of the n main influencing factors, and k is the k-th experiment in the range analysis. Kij is the sum of all the experimental results for the j-th factor level with the value i. S represents the number of times that level i appears in column j.
24


Table 5 presents the results of the range analysis. The relative influence of each factor on the back-blowing uniformity index is R(B) > R(A) > R(C). Since
Back-blowing experiment and powder-coating cleaning experiment
Back-blowing experiment
The actual images of the “branch-type” nozzle and the experimental platform are shown in Figure 9. Using the controlled variables method, experimental tests were conducted on nozzle structures with the same influencing factors and different parameter levels in sequence. The nozzle–structure parameter combinations are listed in Table 6. The optimal combination of the nozzle structure parameters was found to be structure 1. The experiments were performed in triplicates. The experimental variables of the first, second, and third groups were the flow distribution coefficient, length of the branch pipe, and outlet diameter of the main pipe, respectively. The experimental steps were identical to those used in the conventional method. The “branch-type” nozzles were installed on the outlet of the impulse valve by threading. At a back-blowing pressure of 0.4 MPa, the peak pressure distributions on the inner side wall of the filter cartridge in directions 1 and 2 were measured. To avoid an unstable back-blowing pressure during the single-pulse cleaning process, each nozzle structure was tested five times, and the average value of the measured results was obtained.
Structure parameter combinations of “branch-type” nozzles.


“Branch-type” nozzle and experimental platform.
Figure 10 presents the experimental measurement results for the monitoring points on the inner side wall of the filter cartridge in directions 1 and 2 under different experimental conditions. At monitoring point D, the peak pressure ranges in directions 1 and 2 were 1770–2490 Pa and 1640–2690 Pa, which are significantly lower than those of conventional back-blowing cleaning, proving that the “branch-type” nozzle can effectively reduce the problem of excessive cleaning at the bottom of the filter cartridge. In direction 1, the minimum peak pressure value was located at monitoring point B. Among them, the structure with the lowest peak pressure was structure 3, with only 390 Pa. The minimum peak pressures of the remaining structures exceeded 500 Pa. In direction 2, the minimum peak pressure value was located at monitoring point A, where structures 2, 3, and 5 had minimum peak pressure values of less than 500 Pa, whereas the values of the remaining structures were all greater than 500 Pa. Therefore, the minimum peak pressures on the inner walls of structures 1, 4, 6, and 7 satisfied all the requirements for dust cleaning.

Peak pressure distribution curves with different “branch-type” nozzles.
The back-blowing uniformity indices for structures 1–7 were calculated, and the results are listed in Table 7. The back-blowing uniformity of structure 1 was better than those of structures 2–7, verifying the previous simulation results and proving that structure 1 is the optimal combination of factor-level nozzles. The back-blowing uniformity indices of structures 1–7 are better than those of experiment 2, the best one in the simulation models. Because structures 1–7 have better parameter combinations than the simulation models, the uniformity index of structure 1 decreased from 0.814 to 0.406, an improvement of 50.12%. In direction 2, at point A, the location where the peak pressure increase is the smallest on the upper sidewall, the peak pressure increased from 240 Pa to 510 Pa, an improvement of 112.5%, which is better than Liu's scatterer improvement of 101.5%. 19 On the bottom sidewall, at point D, the peak pressure reduced from 6020 to 2260 Pa, which was much better than Wang's upper opening scatter. 18
Back-blowing uniformity indices of different “branch-type” nozzles.

Powder-coating cleaning experiment
To directly demonstrate the improvement of dust-cleaning performance of the filter cartridge dust collector after installing the “branch-type” nozzle structure, a powder-coating cleaning experiment was conducted, as shown in Figure 11. The experimental dust was selected as calcium carbonate dust commonly found under actual working conditions.22,28

Illustration of coating-powder cleaning experiment.
By measuring the changes in the mass of dust on the filter cartridge surface before and after back-blowing, the enhancement of dust-cleaning effect by the “branch-type” nozzle structure was evaluated. Owing to the action of the guide plate, large particulate or lumped dust falls directly to the bottom of the dust collector, whereas some dust also adheres to the wall of the filter cartridge chamber. Therefore, the ratio of the mass of dust that was shaken off by a single pulse of cleaning to the total mass of dust that accumulated on the filter cartridge surface was used as a criterion for evaluating the cleaning efficiency.
Before the experiment began, the mass of suctioned dust, m1, was approximately 500 g. The dust collector was operated, and the dust was sucked up. After the suction was completed, the dust collector was closed, the dust adhering to the filter cartridge chamber wall and guide plate fell into the dust collector bottom with a brush, and its mass m2 was measured. The total mass of the powder coating on the filter cartridge surface, m3, was calculated. The dust collector was operated again to perform the single-pulse back-blowing. Then, the dust collector was closed and the dust falling off from a single cleaning operation with a brush was collected, and its mass m4 was measured. Finally, the mass of the dust remaining on the filter cartridge surface, m5, was calculated. Each group of experiments was conducted thrice, and the experimental results are listed in Table 8.
Results of powder-coating cleaning experiment.

Then, the proportion of mass of dust shaken off by a single pulse of cleaning, m4/m3, was calculated, and the dust-cleaning effect before and after installing the “branch-type” nozzle was compared. When no nozzle was installed, the first pulse back-blowing cleaning removed 47.5% of the dust from the surface of the powder coating. When the “branch-type” nozzle was installed, this figure was 65.4%, an increase in the cleaning efficiency of 37.6%. The mass of residual dust decreased from 139.62 g to 94.1 g, an improvement of 51.7%, better than Zhang's improvement of 47.6%. 22 In addition, a single-pulse back-blowing cannot completely clean the dust layer on the filter cartridge surface. It typically requires multiple pulses blowing at certain intervals and pressures to clean the dust layer.
In conclusion, the “branch-type” nozzle can significantly improve the dust-cleaning effect with a single-pulse back-blowing, which can reduce the total number of pulses required for back-blowing cleaning and extend the cleaning interval time, thus optimizing the dust-cleaning performance of the dust collector.
Conclusions
Based on numerical simulations, the problems in conventional back-blowing filter cartridge dust collectors were examined, and the optimal “branch-type” nozzle structure parameters were determined through orthogonal experiment analysis. The back-blowing uniformity and cleaning effect of the filter cartridge dust collector before and after nozzle installation were studied through back-blowing and powder-coating cleaning experiments, and the following conclusions were obtained:
The conventional back-blowing process of the filter cartridge dust collector has the problem of uneven pressure on the inner side wall of the filter cartridge, which is mainly reflected in insufficient cleaning of the upper part of the filter cartridge and excessive cleaning at the bottom, which can easily damage the filter paper and reduce the service life of the filter cartridge. Under the premise of not considering the interaction of various influencing factors, the relative importance of each influencing factor was as follows: branch pipe length > flow distribution coefficient > main pipe outlet diameter. The optimal parameter combination of the “branch-type” nozzle structure was a branch pipe length of 70 mm, flow distribution coefficient of 50%/40%/10%, and main pipe outlet diameter of 18 mm. The results of the back-blowing experiment showed that the optimal structure of the nozzle can maximize the uniformity of filter dust cleaning, and the uniformity index reduced from 0.814 to 0.406, an improvement of 50.12%. The powder-cleaning experiment showed that the “branch-type” nozzle can increase the mass of dust shaken off from 126.49 g to 178.12 g and increase the cleaning efficiency by 37.6%. This indicates that the “branch-type” nozzle can significantly improve the cleaning effect within a single-pulse back-blowing, which can reduce the total number of pulses required for back-blowing cleaning and extend the cleaning interval, thus optimizing the dust collector's cleaning performance.
Footnotes
Authors’ contribution
Writing, review, and supervision: Zhang Yong; Writing, editing, validation, data curation: Liang Chuoxi; Validation, data curation: Ye Shiyang; Project administration, funding acquisition, supervision, and inspection: Xiao Guoquan. All authors have read and agreed to the published version of the manuscript.
Data availability statement
The study did not report any data.
Declaration of conflicting interests
The authors declared no potential conflicts of interest with respect to the research, authorship, and/or publication of this article.
Funding
The authors disclosed receipt of the following financial support for the research, authorship, and/or publication of this article: This work was supported by the National Natural Science Foundation of China (52175535), the Guangdong Basic and Applied Basic Research Foundation (2024A1515011267), and the Guangzhou Science and Technology Program Project (202201010056). This work was also supported by the Guangzhou Tongda Automotive Electric Co., Ltd.
Author biographies
Zhang Yong is a professor in mechanical engineering. His area of research is automotive power, focusing on internal combustion engines, automotive production equipment, etc.
Liang Chuoxi is a master's degree student at South China University of Technology. His area of research is power machinery and engineering, focusing on industrial dust removal, flow field simulation, etc.
Ye Shiyang is a master's degree student at South China University of Technology. His area of research is dust removal equipment optimization, focusing on automotive battery, structural design, etc.
Xiao Guoquan is a Professor in Power machinery and engineering. His area of research is intelligent equipment digital twin modeling, focusing on multi-physics coupling simulation and performance virtual test.