
Abstract
The complexity of test and fault information within electronic devices makes their integrated diagnosis a challenging problem when designing equipment reliability. Current integrated diagnosis is analyzed for test optimization and test resource optimization. However, this neglects the connection between them. This paper proposes a design strategy for integrated diagnosis optimization based on the spatial mapping principle to quantitatively describe the constraint relationship between them. The integrated diagnosis optimization model is established by constructing the logical mapping relationship between test space, resource space, and fault space, and the optimal test configuration and test resource configuration are sought based on the grey wolf optimization algorithm. Seven high-dimensional benchmark functions and an integrated diagnosis model of electronic equipment are used to verify the efficiency of the algorithm proposed in this paper. The proposed algorithm is compared with the other four in terms of the algorithm’s optimization speed and accuracy. The results indicate that the electronic equipment after integrated diagnosis optimization has critical fault detection, fault detection, fault isolation, and false alarm rates of 100%, 99.99%, 98.99%, and 0.2993%, respectively. After the integrated diagnosis optimization, the number of tests of the equipment is reduced by 88.9%, and the test cost is saved by 89%. Compared with the other algorithms, grey wolf optimization achieves the best optimization results, reduces the number of tests by 42%–55%, and decreases the test cost by 77.63%–83.91%. This strategy not only considers the test optimization of equipment and test resources optimization but also dramatically reduces the test cost while improving the test efficiency.
Keywords
Introduction
The vast majority of modern equipment is equipped with cutting-edge electronic technology, which improves its performance and combat effectiveness, significantly raises its lifetime cost, and creates significant challenges for maintenance and warranty.1–3 The United States Institute of Defense Industry proposed the idea of an integrated diagnosis in the 1980s, which encouraged the US military to develop better electronic equipment to address existing testing, fault diagnosis, maintenance, and security issues. Over 20 years, the integrated diagnosis methodology system effectively improved US military equipment and its comprehensive security capabilities.4,5 Integrated diagnosis is the organized process of design and management that maximizes the diagnostic capability of equipment considering every aspect that constitutes diagnostic capability, including personnel, training, technical information, maintenance aids, automated testing, built-in testing (BIT), manual testing, and maintenance.6,7 Integrated diagnosis is not the combined use of multiple means for diagnosing a particular fault mode. Based on the needs of each aspect of the equipment system, integrated diagnosis ensures that faults are diagnosed quickly and efficiently by selecting the optimal test plan while minimizing the overall cost. 8
Integrated diagnosis is a systematic endeavor. During the design phase, the apparatus has to select test resources such as BIT, automated, and manual testing, which highlights how quickly the equipment can make a test decision for satisfying the use and maintenance requirements. Furthermore, forming a high-efficiency maintenance management system while using it under the various mission requirements, maintenance levels, and security levels is necessary.
Briefly, integrated diagnosis involves considering test optimization and test resource allocation optimization. Electronic equipment with an unsatisfactory test design find it challenging to utilize external assistance such as diagnostic and infrared sensors in the fault diagnosis process, similar to that in mechanical faults. In addition, it is not possible to disconnect and disassemble the cables, circuits, and components at will. Therefore, electronic equipment in the test design must consider the subsequent maintenance and diagnosis. Given the complexity and integration of higher-level electronic equipment, using manual testing not only takes more time but also reduces the ability of the equipment to fight; using BIT will increase the costs associated with research and development for the overall design of the equipment in addition to affecting the structural performance, weight, and volume of the severe burden.9,10 Therefore, it is necessary to consider both the needs for testability and diagnosability to perform integrated diagnostic design for electronic equipment. On the one hand, this means determining the diagnostic scheme under the various mission requirements, optimizing the allocation of test resources, optimizing fault detection and isolation points, and optimizing the test sequence. On the other hand, it involves evaluating the testability design, promptly making necessary adjustments and optimizations, and formulating the diagnostic strategy under the mission requirements.11,12
Test and test resource optimizations are primary areas of contemporary integrated diagnosis research. Many tests must be conducted based on a thorough study of faults to assure fault diagnosis performance as equipment structure and function become more complicated. 13 Test optimization focuses on finding the optimal set of tests that satisfy the testability and diagnosability requirements from the set of alternative system tests. This helps ensure that the cost of integrated diagnosis is minimized. 14 The current research methods for test optimization are an information entropy-based ranking method and a search algorithm based on combinatorial optimization. Test optimization using the core concept of information entropy involves prioritizing tests with high weights until the test criteria are satisfied. The contribution of each test to fault diagnosis is measured using information entropy for calculating the test weights. 15 Although this method can define the consequences of different tests, it is more subjective based on the information weights. Methods based on combinatorial optimization seek the optimal test set by defining the objective function and constraints. They are based on intelligent optimization algorithms, e.g. genetic algorithms (GAs), 16 particle swarm algorithms, 17 simulated annealing algorithms (SAAs), 18 and bacterial foraging algorithms. 19 However, it is difficult for this class of methods to achieve a good trade-off between search speed and global optimization. The best test set can be found by combining the two test optimization techniques, which define the objective function based on information entropy, and they enhance the intelligent optimization algorithm or combine multiple intelligent optimizations to get around the conflict between search speed and global optimality.20,21
The optimal allocation of test resources is essential for the integrated diagnosis. The performance of relevant alternative test resources, test cost, and other factors should be analyzed for determining the optimal test set of the equipment. The experience of test experts and specific technical indicators should determine what test resources or combination of forms for tests to form a test resource allocation program. 22 For the test, various feasible test resources or combinations are often available to complete. They require a reasonable choice among the many alternative test resources and multiple resources for comprehensive evaluation. The theory and technique of test resource selection are currently under-represented in the literature. Most literature consider costs associated with different test resource selection strategies, ignore several significant limitations, and skip over essential details in favor of a cursory overview of the procedure and methodology of test resource selection, which is sufficient information for developing a systematic overall program. 23 This leads to the irrational allocation of testing resources and maintenance level of equipment, which increases the cost of testing, fault diagnosis, and equipment maintenance, and seriously restricts equipment maintenance technology development. Therefore, for test resource optimization, it is necessary to comprehensively consider the target elements affecting the testability and diagnosability of the equipment for thoroughly assessing the effectiveness and costs and coordinate the trade-offs and compromises between the target factors.
The following problems exist in the research on integrated diagnosis at the present stage:
Allocating test resources for equipment at the current location is unreasonable, and there is no comprehensive analysis of the various cost factors affecting the allocation of test resources. Furthermore, there is a lack of in-depth research on the optimal allocation of test resources. The key to this problem is the lack of a theoretical basis for test resource allocation and inability to integrate all cost factors into the test resource optimization model. The integrated diagnostic optimization modeling process considers only the test demand (whether the faults can be detected or isolated); however, the effect of the diagnosability demand (the difficulty of fault diagnosis) on the integrated diagnostic optimization is not considered. The construction of traditional constraints on test optimization does not consider the effect of the fault of the test resources on the optimization results. The integrated diagnostic optimization is a whole. The current stage of comprehensive diagnosis research studies tests optimization and resource optimization separately, weakening the constraint relationship between them.
The results of the above analysis indicate that the key to the integrated diagnosis problem lies in how to establish the relationship between test optimization and test resource optimization. For example, how to quantitatively describe the relationship between test, test resource, test cost, resource cost, and test resource fault rate. The spatial mapping principle has a unique advantage in dealing with different spatial mapping relationships. Based on the spatial mapping principle, this paper quantitatively describes the logical mapping relationships between each other's spaces and establishes an integrated diagnosis and optimization model by establishing the test space, resource space, fault space, and cost space. The integrated diagnosis problem is a combinatorial optimization problem, and bionic intelligent optimization algorithms play a great advantage in solving these optimization problems. Common bionic intelligent optimization algorithms include grey wolf optimization (GWO),
24
artificial bee colony,
25
ant colony,
26
cuckoo search,
27
bat,
28
firefly,
29
whale optimization,
30
squirrel search,
31
chimpanzee,
32
and osprey optimization algorithms.
33
In this paper, we use the GWO algorithm, and the main reason for this lies in its unique search mechanism. The search mechanism of the GWO algorithm is based on the leadership hierarchy of the grey wolf population, which can effectively avoid the algorithm from falling into local optimal solutions. In recent years, the GWO algorithm has been widely used in the fields of network clustering, 34 lifetime prediction, 35 feature selection, 36 path planning, 37 engineering problems, 38 community detection, 39 and so on. In summary, this paper presents an integrated diagnostic optimization approach based on integrated design principles, thereby aiming at issues present in the current integrated diagnosis research process. First, the mapping relationship between the fault space, test space, resource space, and their subspaces is constructed based on the spatial mapping principle. According to the logical mapping relationship between the test optimization and resource optimization vectors, the test and resource optimization models are integrated to establish an integrated diagnosis optimization model. Furthermore, based on the correlation and quantitative matrices, the constraint relationship of the integrated diagnosis optimization is constructed for ensuring that it meets the testability and diagnosability requirements of the equipment. Then, the mapping relationship between the cost types of test resources is established and the comprehensive evaluation cost matrix based on hierarchical analysis is obtained to ensure the reasonableness of the test resource allocation. Finally, the GWO algorithm will be designed to seek the optimal integrated diagnostic model of the equipment. This integrated diagnosis optimization strategy not only considers the test optimization of equipment and test resources optimization but also dramatically reduces the test cost while improving the test efficiency.
Integrated diagnosis optimization model
Characterization of the integrated diagnosis optimization
Integrated diagnosis optimization is an integrated system project based on the premise of meeting the testability and diagnosability needs of the equipment. This systems employs test optimization and resource allocation optimization as the primary means and reduces the cost of integrated equipment diagnosis as the optimization goal. Improving the reliability of the equipment and fault diagnosis ability is the ultimate goal.
Many tests are set up based on thoroughly investigating equipment faults to guarantee the degree of integrated diagnosis. However, tests do not have the same importance and are often redundant; therefore, as an essential content, test optimization begins the integrated diagnosis optimization that will be related to the efficiency of the entire integrated diagnosis.40,41
Test resource configuration affects the structure and function of the equipment to a certain extent. In contrast, the complexity of the structure and function of the equipment seriously restricts the development of integrated diagnosis.42,43 Test resource allocation involves optimizing different types of test resources such as online/offline through integrated diagnosis information and test information of different maintenance levels. Resource allocation requires clarifying the characteristics of test resources, understanding the fault diagnosis capabilities required for different maintenance levels, and analyzing the test resources as necessary for different maintenance levels. Diagnostic resources include BIT, automatic test equipment, manual test equipment, and general electronic equipment. Other types of test resources have different application scenarios, and their specific focuses are also different. The testability and diagnosability of the equipment are different for different maintenance levels. The allocation of test resources decides how to arrange various test resources at each maintenance level in a reasonable manner. The types of test resources vary depending on the type of equipment. For example, space satellites are mostly BIT-based, and the test resources are appropriately changed according to the corresponding application scenarios. Therefore, to make the study of general significance, this paper takes the test resource allocation of available equipment as the research object.
Test optimization and resource allocation optimization are mutual constraints and affect each other, and the test optimization constrains the selection of test resources. The choice of test resources constrains the test requirements, which further constrains the results of test optimization. The relationship between the two is shown in Figure 1.
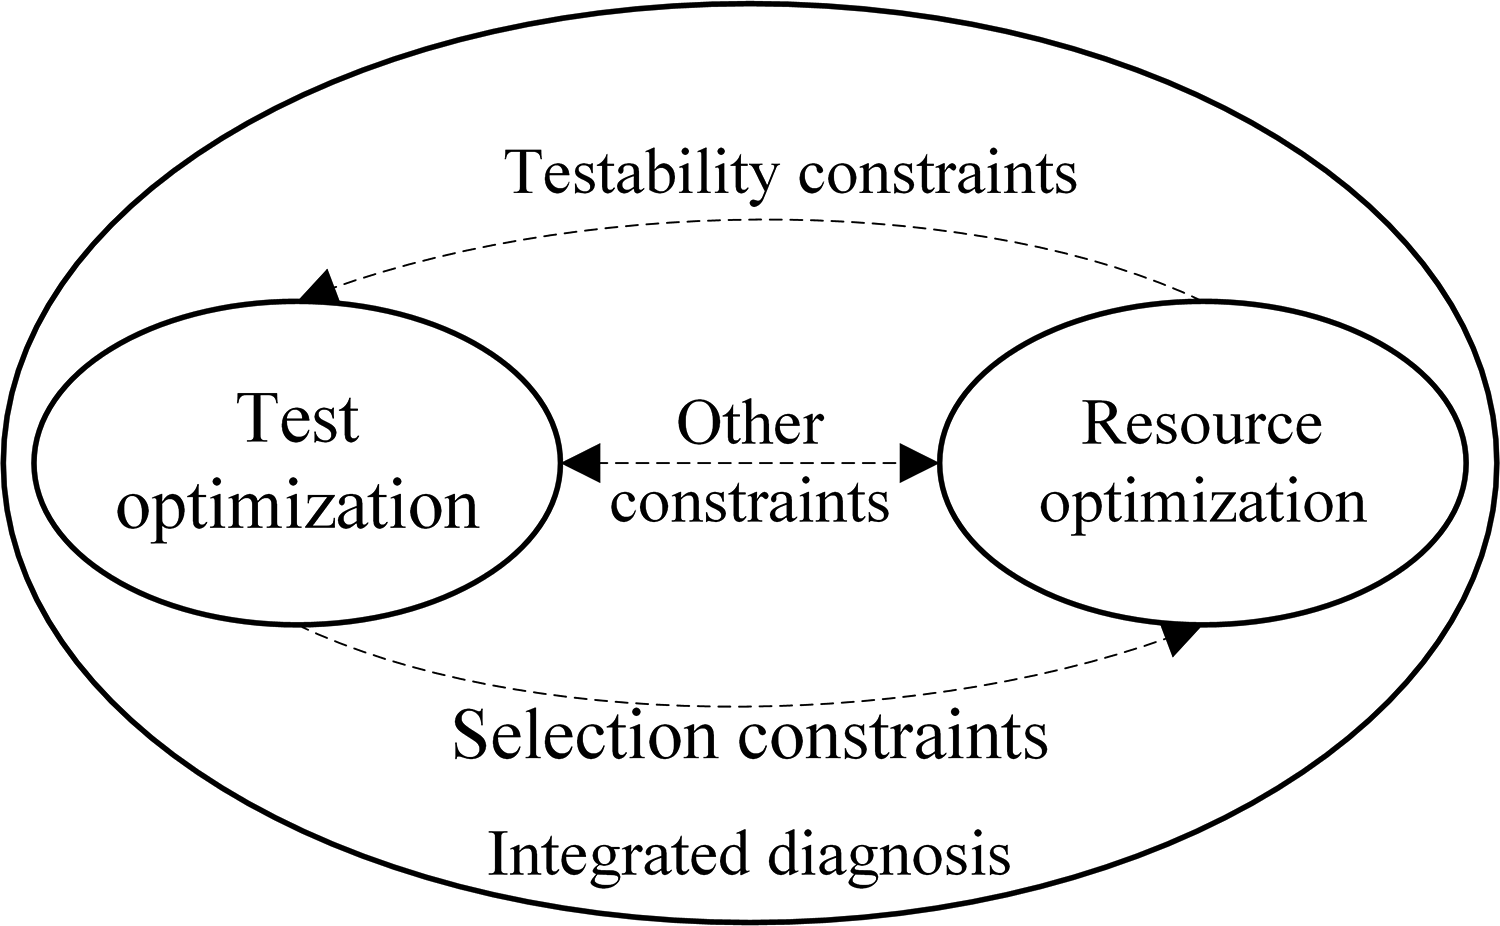
Constraint relationships between test and resource optimizations.
Spatial mapping principle
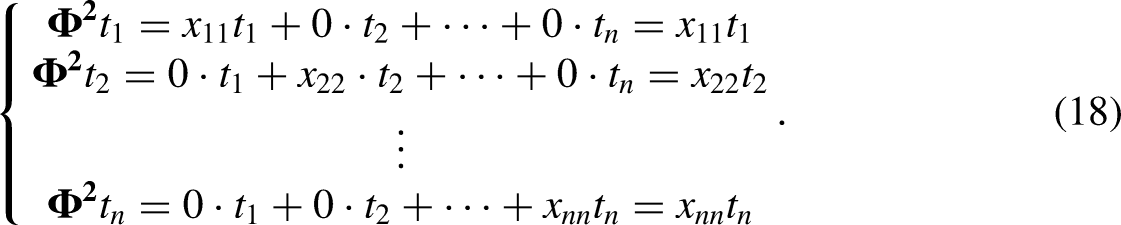
In a finite-dimensional linear space, given a basis, any vector can be uniquely represented by a basis vector. Thus, whenever the image of a basis vector can be determined under some linear transformation, the linear transformation can be completely determined.
Let


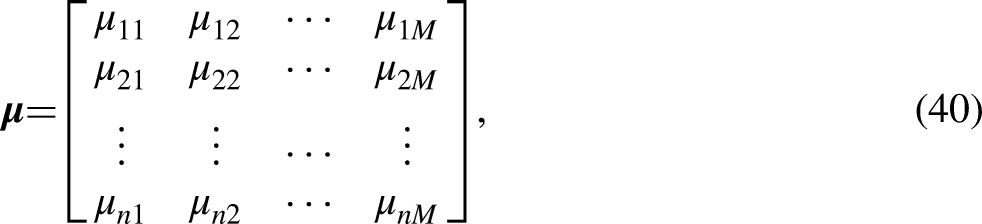
The matrix
Integrated diagnosis space
Based on the demand of constructing an integrated diagnosis model based on spatial mapping, the test, fault, and test resources are built into the test, fault, and resource space. Defining the constraints between each other lays the foundation for constructing the integrated diagnosis optimization model.
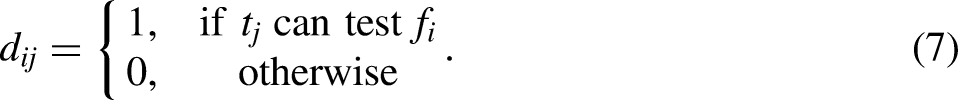
(1) Correlation mapping (2) Fault rate mapping (3) Cost mapping
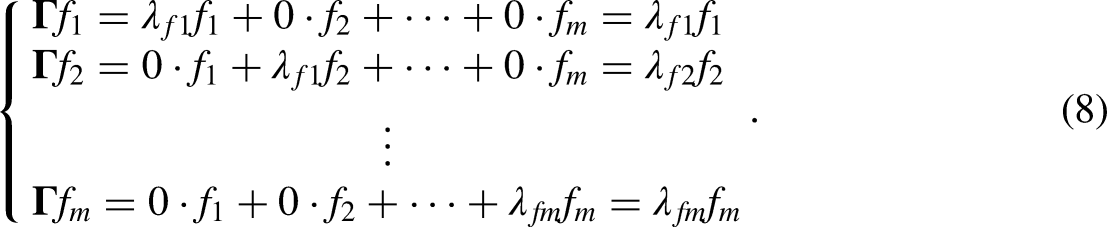
Given an m-dimensional fault space
Given an m-dimensional fault space
Given an n-dimensional test space


Let


Analogously to
When the test cost (4) Quantitative evaluation mapping
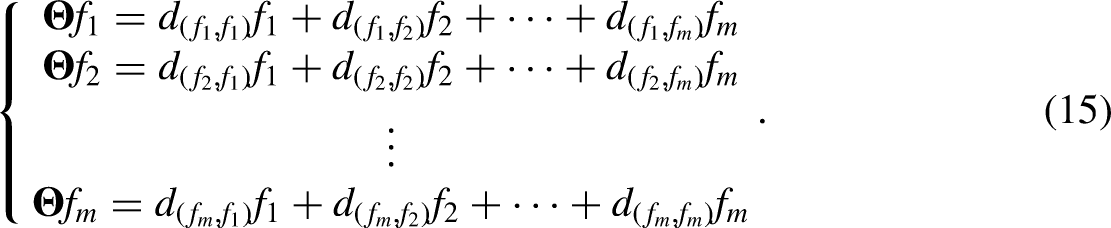
Given an m-dimensional fault space


Integrated diagnosis optimization model
Integrated diagnosis optimization involves meeting the requirements of testability and diagnosability as the basis to find the optimal test set and resource allocation set from the test space and resource space, and to ensure that the cost of the integrated diagnosis is minimal. The integrated diagnosis optimization can be reduced to two aspects: c
Therefore, the integrated diagnosis optimization problem can be summarized as
Completeness of the test subspace, i.e. determining whether a set of bases in the test subspace satisfies the equipment diagnosability and testability requirements. Based on expert experience and historical data, select appropriate bases among the test space to add or replace the bases of the test subspace to constitute a complete test subspace when the test subspace is incomplete. Optimized test resources must be selected to ensure the testability needs of the equipment and minimize the overall cost. Comprehensive analysis of the effect of each test cost type on the results of integrated diagnosis optimization.
Test optimization
Given the n-dimensional test space


Select a new set of bases

Similarly defining the resource subspace

Construct a

Given a test subspace
Test resource optimization
Given a c-dimensional test subspace 


Therefore, 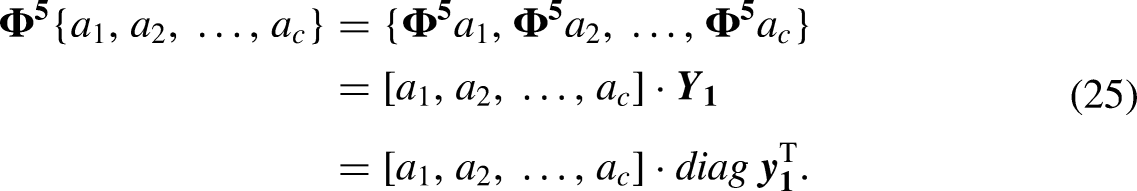


Integrated diagnosis optimization model
The mapping architecture of the test space

Mapping relationships in the integrated diagnosis space.
Figure 2 shows that the integrated diagnosis optimization is based on the test optimization mapping
On the one hand, (1) Completeness constraints The test The fault in the fault space is single-fault distinguishable if and only if there is a difference between every row in correlation matrix
The integrated diagnosis must ensure the mapping relationship between the optimized test subspace and fault space to meet the testability and diagnosability requirements. The correlation matrix 
The test subspace completeness is equivalent to the
As a result, the constraint problem of checking subspace completeness is as follows:
There are no non-zero rows in matrix

Construct a vector (2) Fault detection rate constraints
Fault detection rate (FDR) is defined as a ratio of the number of faults correctly detected by a defined method to the total number of faults, expressed as a percentage.
Engineering factors that should be considered to determine the FDR include the failure rate of the unit under test for faults, detection method, and reliability constraints. For the correlation matrix (3) Fault isolation rate constraints
Fault isolation rate (FIR) is defined as the ratio of the number of detected faults correctly isolated to no greater than a given degree of ambiguity by a prescribed method to the total number of detected faults expressed as a percentage.
The factors that should be considered in determining the FIR are FDR, testing techniques, and acceptable isolation methods. Based on (4) False alarm rate constraint (5) Quantitative constraints on diagnosability
False alarm rate (FAR) is defined as the ratio of the number of false alarms occurring in a specified period to the total number of fault indications at the same time.

The difficulty of fault detection and isolation cannot be quantified because the index constraints of testability can only qualitatively reflect whether a fault can be detected or isolated. This paper uses the quantitative evaluation method of diagnosability based on the maximum mean difference.
44
Then, construct the quantitative evaluation mapping
Based on (6) Integrated diagnosis optimization models


According to the constraints and objective functions analyzed in the previous section, the integrated diagnosis optimization model can be obtained as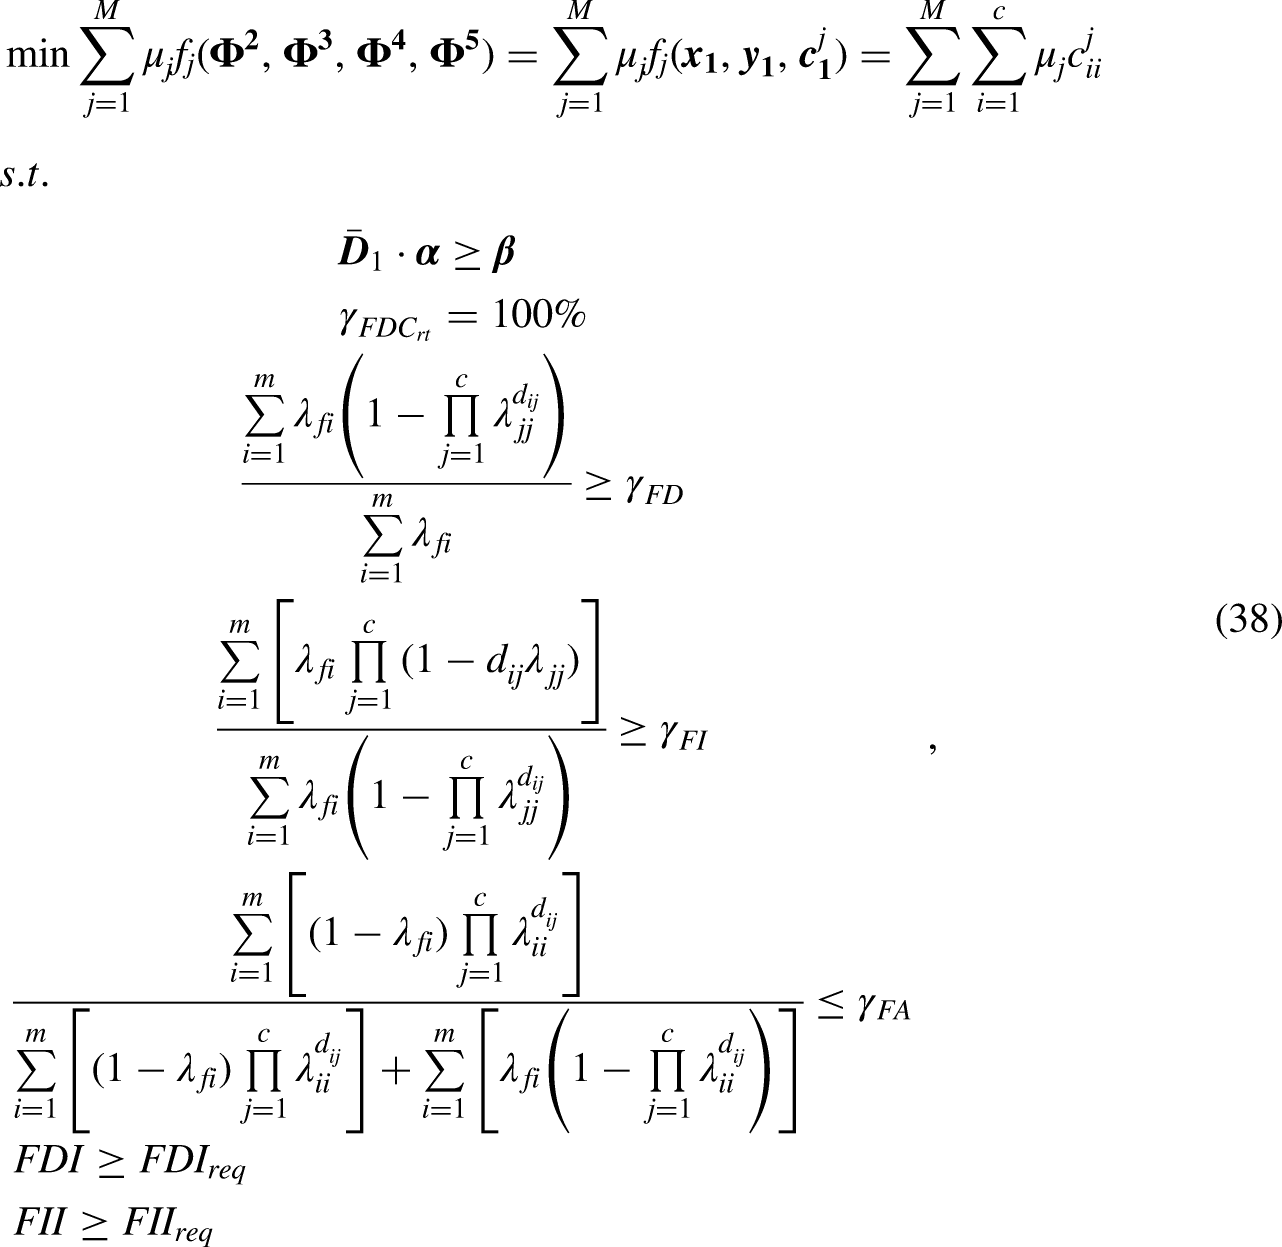
Comprehensive evaluation of testing resource cost types
The integrated diagnosis optimization model reveals that the choice of test resources affects the total cost of the integrated diagnosis and the testability and diagnosability constraints of the equipment, which impacts the test optimization outcomes. The three main strategies for solving the integrated diagnosis problem are as follows: (1) how to identify and quantify each cost type, (2) how to convey the cost weight of each cost type to the test in a reasonable manner, and (3) how to make the integrated diagnosis optimization model simpler and less challenging when there are a large number of cost types.
Therefore, it is essential to allocate test resources as efficiently as possible. There are several types of costs for test resources. Each cost type has a distinct evaluation weight from other cost types, and the degree of restriction on each cost type varies based on the test in the test space. All cost types of the equipment need to be thoroughly analyzed, and the restriction weights of tests on each cost type in the test space should be clarified. Furthermore, the evaluation weights for each cost type for resources in the resource space should be clarified. Moreover, the evaluation weight of the integrated evaluation should be obtained based on the evaluation weight and restriction weight of each cost type to each test resource and test to simplify the integrated diagnosis model. This will allow for a comprehensive evaluation of the effect of each cost type on integrated diagnosis optimization. The cost matrix for the comprehensive assessment is ultimately derived from the evaluation weights of each cost type for each test resource and the restriction weights of the cost types to the test to streamline the integrated diagnosis model.
Test resource cost types
Test resource costs are divided into several categories, which include expense cost

Classification of the test cost types.
Test cost comprehensive evaluation
One must consider the integrated diagnosis requirements of the equipment when choosing test resources in a test space, thoroughly analyze the constraints of the cost types from various perspectives, and choose test resources based explicitly on the relationship between those costs. Therefore, it is crucial to thoroughly assess every cost type in the test area while choosing the test resources.

A judgment matrix was constructed for characterizing the effect weights of each cost category on the test by allocating values according to Satty’s recommended 1–9 scale. 45 Scales 1–9 are shown in Table 1
Meanings of the scales 1–9.

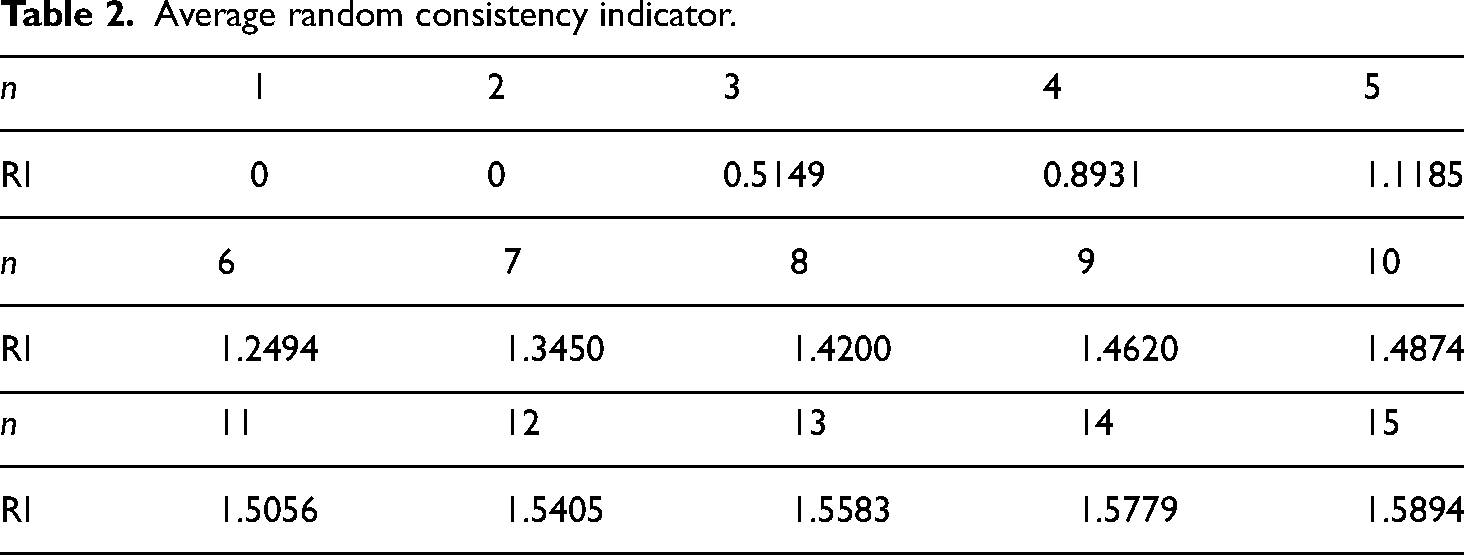
Based on Table 1, define the ratio mapping relation 


Average random consistency indicator.
Test cost types are categorized into seven major classes:
Now consider the test
If
Resource cost comprehensive evaluation
For each test resource in the test resource space, specifying its test cost for each cost type is important. Therefore, a comprehensive evaluation of each cost type of the test resource is required for test resource optimization.
There are l alternative test resources 


The matrix
Quantitatively characterizing the test cost of test resources is the foundation of optimum resource allocation. Both a qualitative analysis and fuzzy language may be used for calculating the expenses for the type of costs that cannot be quantified. A score set of {10, 9, 8, 7, 5, 4, 3, 2, 1} corresponds to the ten evaluation indicators arranged under the degree of effect of the cost type to aid in assessing qualitative indicators. Scores are assigned by pertinent experts in compliance with the guidelines above to create the fuzzy assessment matrix
Assessment metrics for the test cost must be normalized by transforming the evaluation matrix For positive indicators (bigger is better): For negative indicators (smaller is better):
In the above equation, 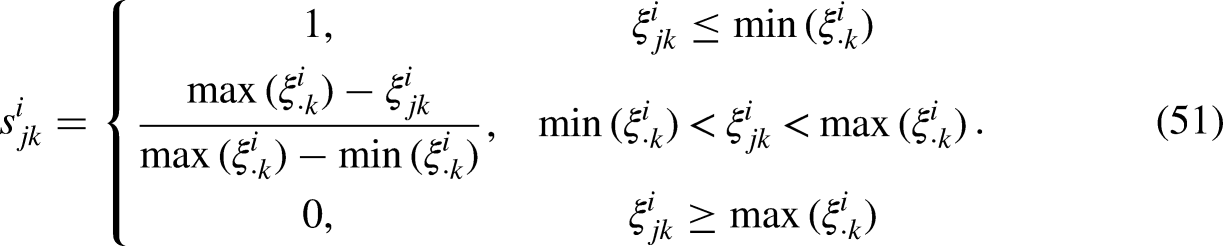

Comprehensive evaluation of the cost matrix
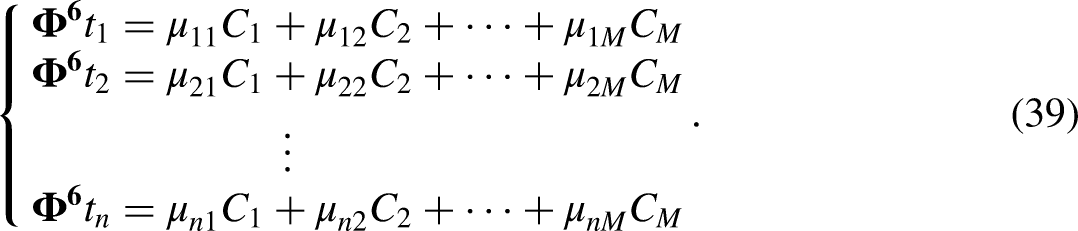
Many types of costs need to be considered in the optimal allocation of test resources; the restriction weights of tests on each cost type in the test space are different, and the evaluation weights of each cost type of test resources in the resource space are also different. Cost matrix
Comprehensively measure the effect of each cost type on the optimization of test resources by integrating the influencing factors of each cost type into the cost matrix. Furthermore, it optimizes the integrated diagnosis model and reduces the difficulty of integrated diagnosis optimization. Then, the optimization function of the integrated diagnosis optimization model can be simplified as

Integrated diagnosis optimization based on the GWO algorithm
The analysis in Comprehensive evaluation of testing resource cost types section indicated that the integrated diagnosis optimization problem is a combinatorial optimization problem that can be described by the ensemble coverage model. The ensemble coverage problem is a complex NP problem for large and complex equipment. The complexity of the equipment system increases with an increase in ensemble size, and therefore, it is necessary to find an effective algorithm to obtain the global optimal solution of the integrated diagnosis problem quickly and accurately.
GWO algorithm
Gray wolves prey through stalking, chasing, encircling, harassing, and other behaviors. The GWO algorithm is a new bionic intelligent optimization algorithm 46 designed to achieve algorithmic optimality seeking by mimicking the social hierarchies and prey behaviors of gray wolves.
In nature, the gray wolf is an apex predator that lives in packs of 5–12 wolves, with a strict hierarchy among them. The wolves in the gray wolf family can be divided into four categories based on their social status:
In the GWO algorithm, the solution with the optimal fitness value, second best solution, and third generation of solutions in the gray wolf population are regarded as the
In the D-dimensional search space, assume that the population
The process of the gray wolf approaching and surrounding the prey is reflected in the algorithm as the process of the gray wolf arriving at the optimal solution. The position update formula of the i-th gray wolf is

In the above equation, t represents the current iteration number, 


The formula for updating the location of each type of gray wolf is


Integrated diagnosis optimization steps
Integrated diagnosis optimization steps based on the GWO algorithm are as follows:
In the GWO algorithm, two randomly adjusted parameters, A and C, allow the algorithm to search and mine. When A is greater than 1 or less than −1, the algorithm starts a global search; furthermore, when C is greater than 1, it passes the search capability for the algorithm. In contrast, when
Simulation verification
Optimizing the design of an integrated diagnosis architecture for a specific type of equipment with 22 a priori faults and 36 preparatory tests is necessary. Each test preferably has nine test resources to choose from, where each test type has three alternative test resources. The mapping relationship of the integrated diagnosis space of the equipment is shown in Annex 1.
Comprehensive evaluation of the cost matrix
Each cost category has been thoroughly examined, and test
Comprehensive evaluation of test costs


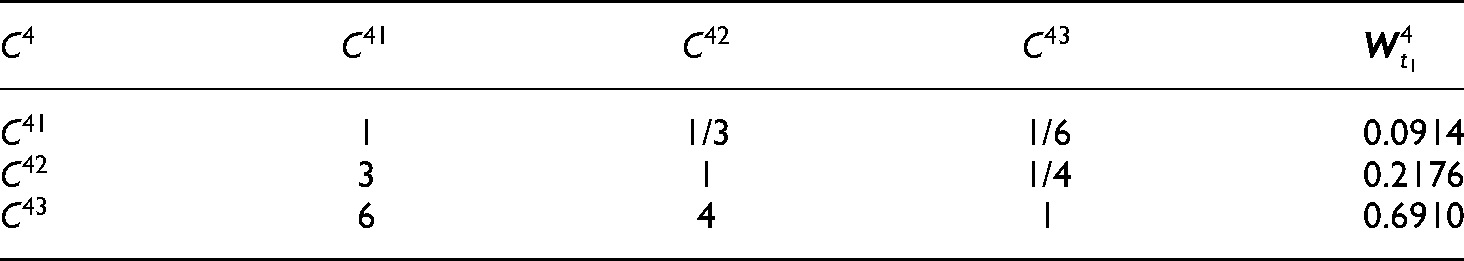


Consequently,


Integrated evaluation of resource costs
The values for the nine test resources corresponding to test
The fuzzy evaluation matrix 


Comprehensive evaluation of the cost matrix
From 


Optimization analysis of the integrated diagnosis based on the GWO algorithm
GWO algorithm performance analysis
Seven test functions are selected to test its performance to verify the performance of the GWO algorithm. The test functions are listed in Table 3.
Test functions.

Functions
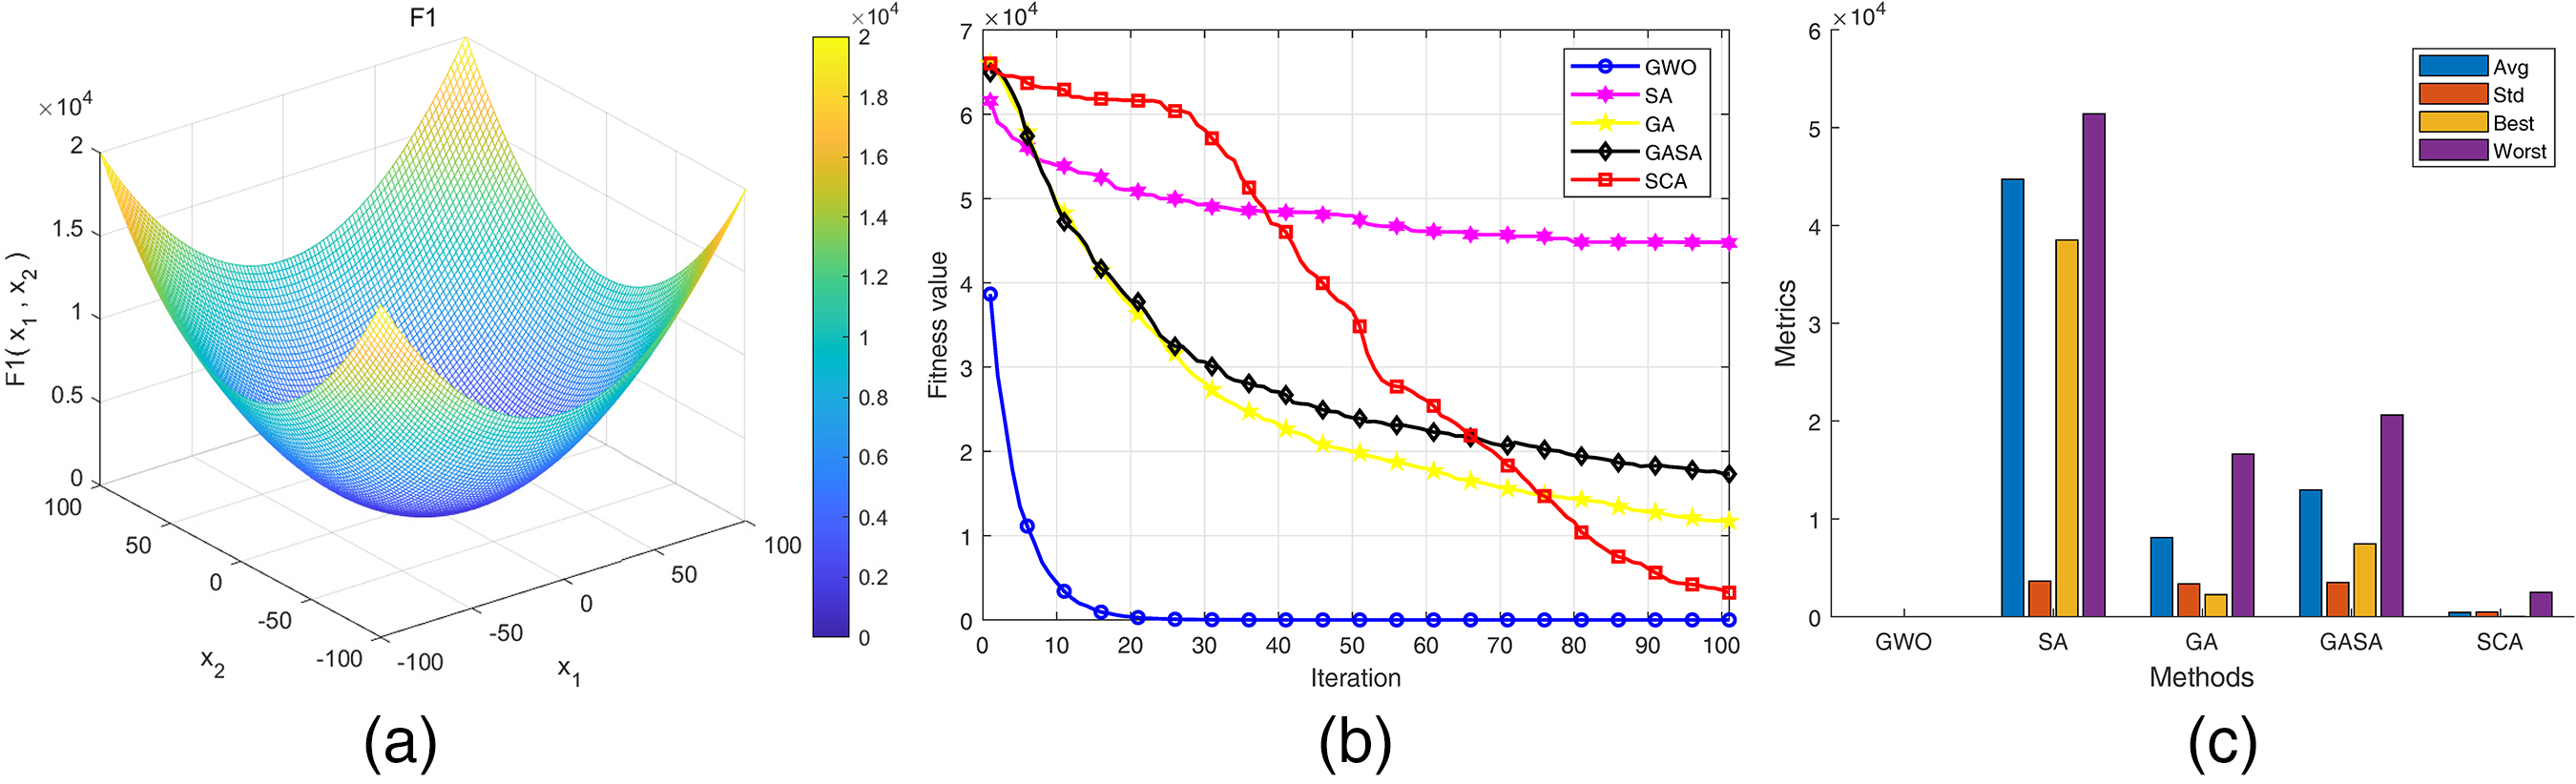

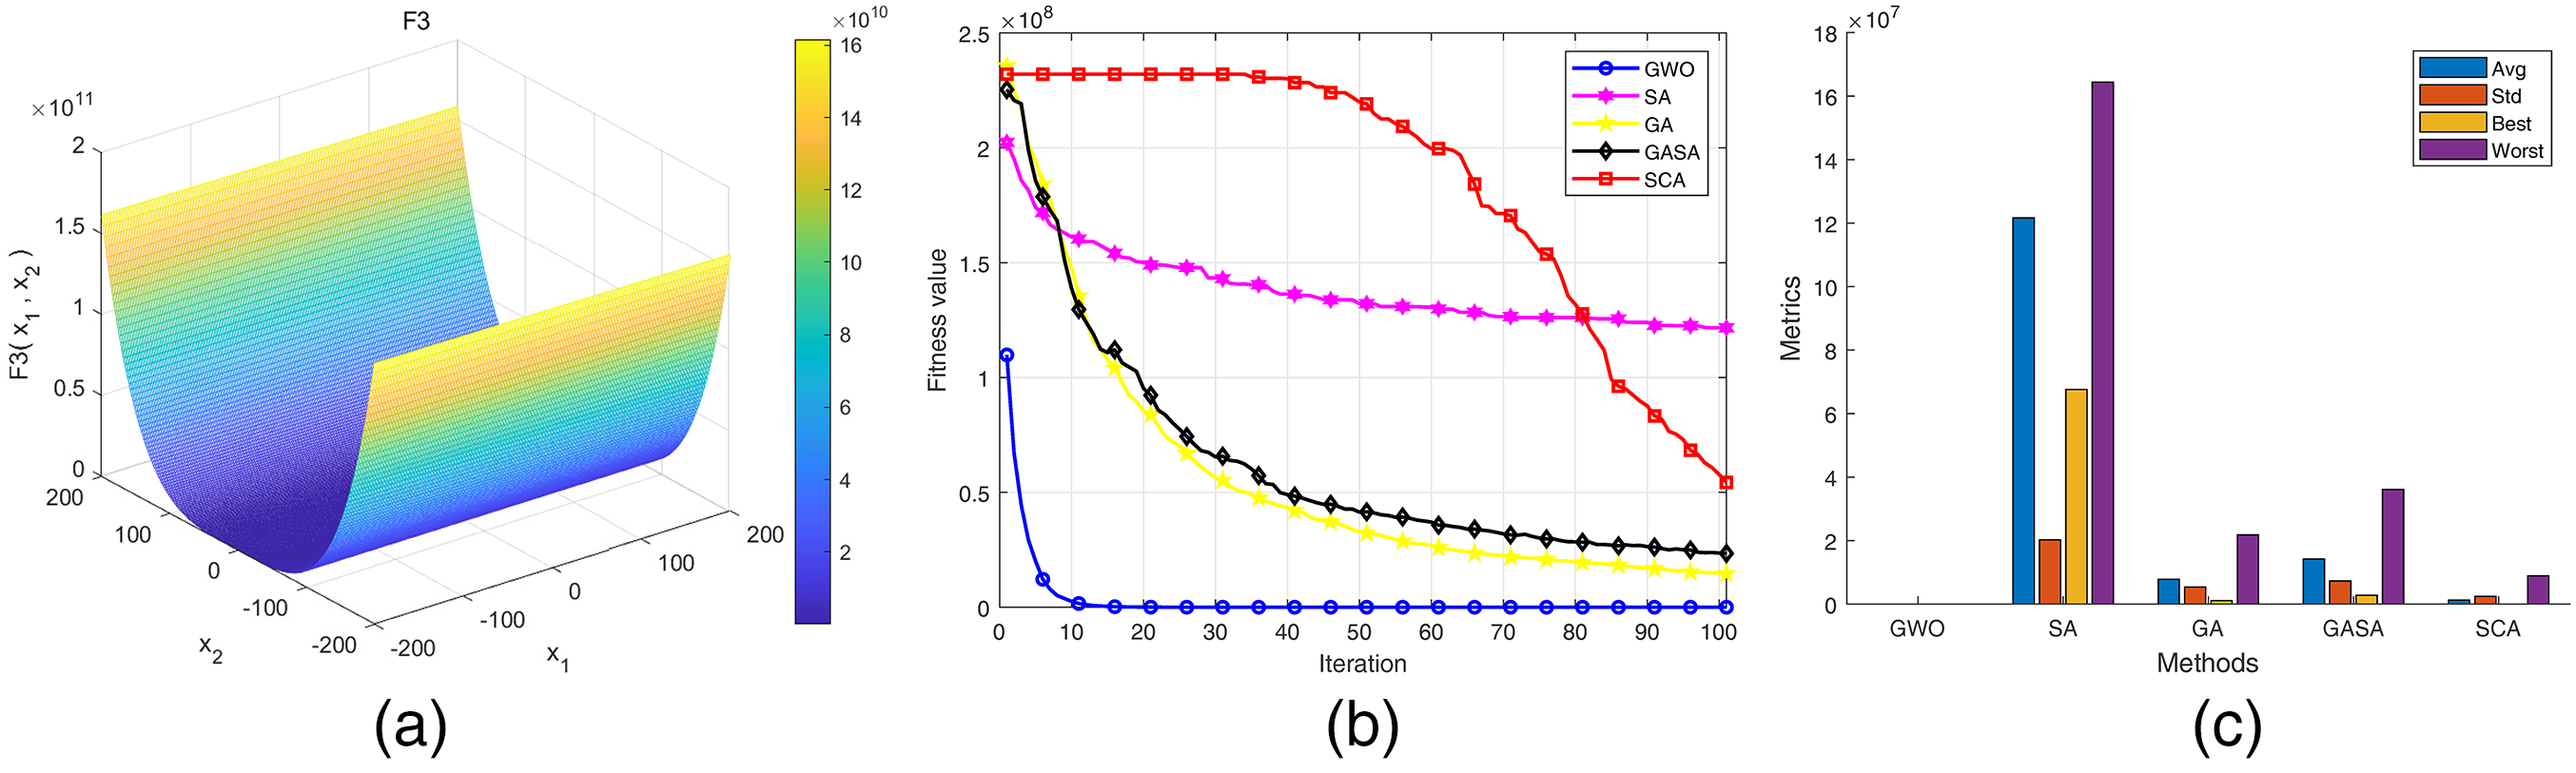

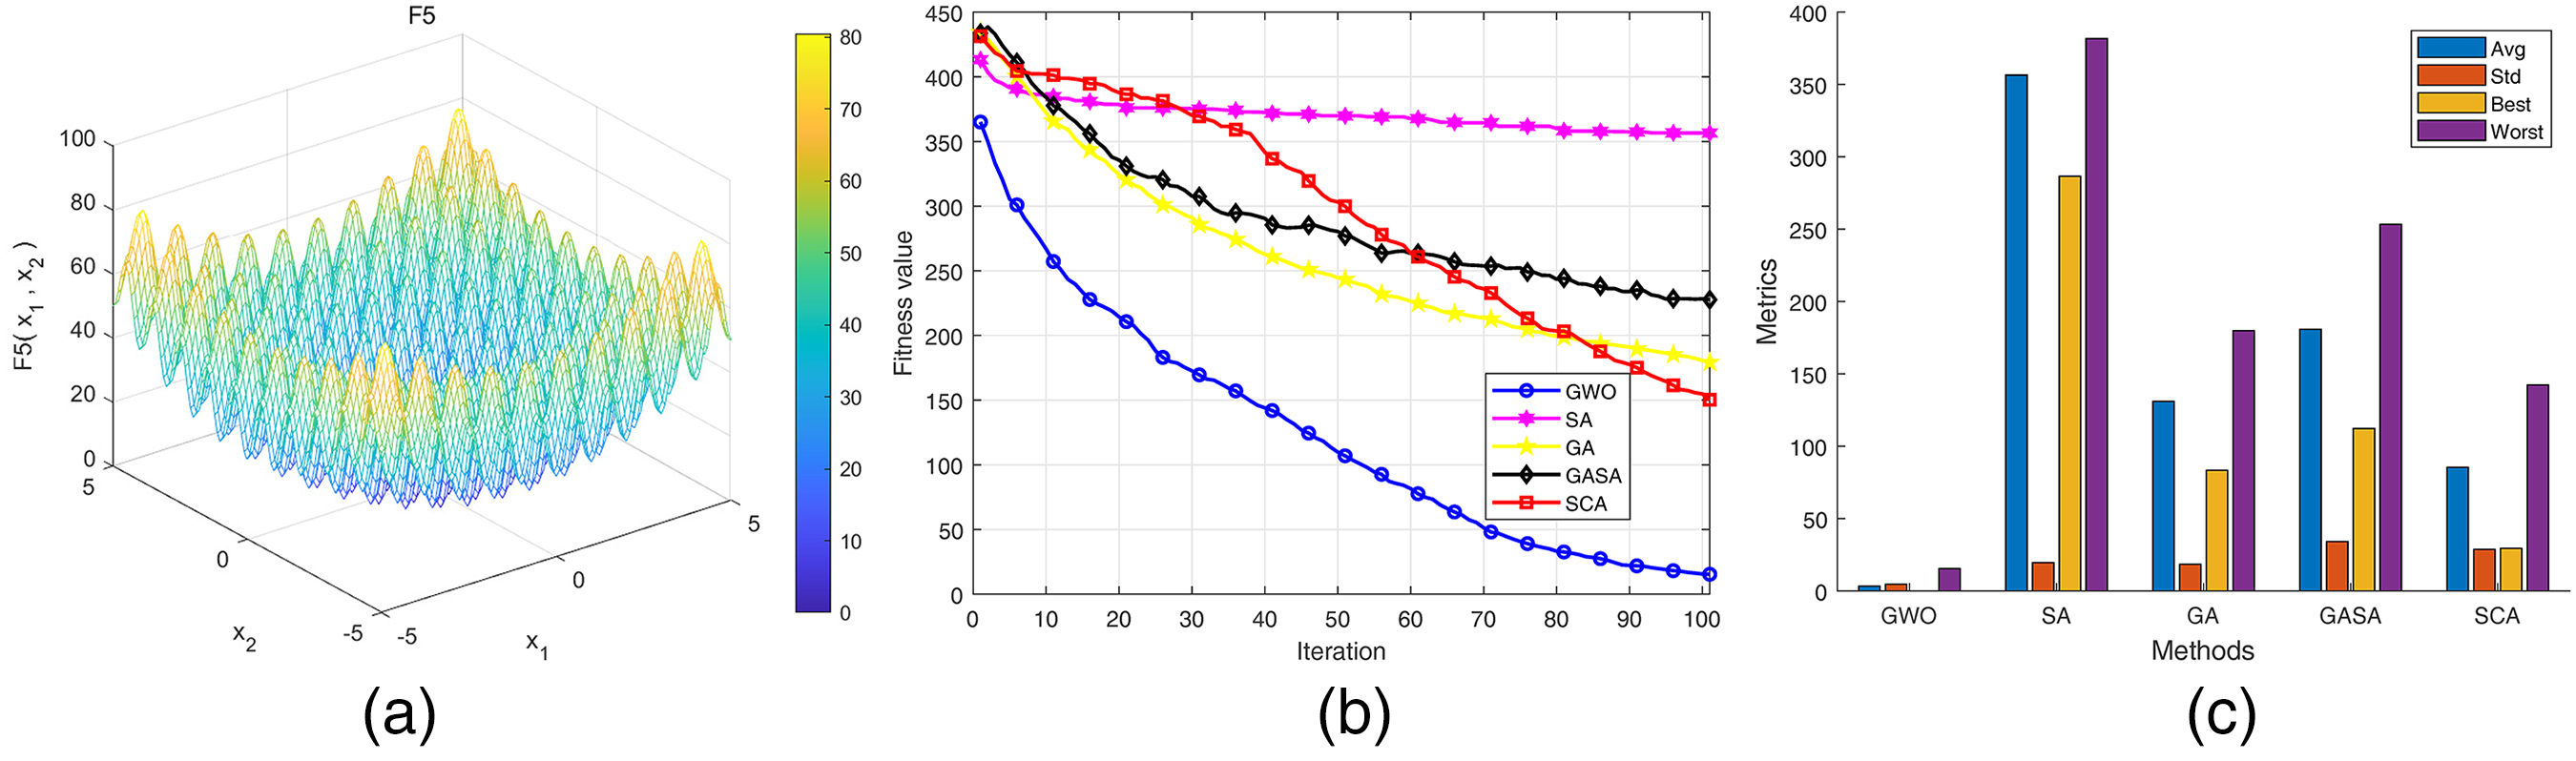


Figures 4(a)–10(a) show images of each function; Figures 4(b)–10(b) show the fitness curves of each function; Figures 4(c)–10(c) show the simulation of each function for 30 repetitions of the test, in which Avg, Std, Best, and Worst represent the mean, variance, optimal solution, and worst solution, respectively. Figures 7(b)–10(b) show that the convergence speed of the GWO algorithm is significantly greater than the other algorithms. Furthermore, Figures 5(b), 8(b), and 9(b) shows that the convergence accuracy of the GWO algorithm is significantly more potent than the other algorithms. The stability of the GWO algorithm is considerably more powerful than other algorithms, as seen from (c) of Figures 4–10. The mean and variance are kept low.
The structural and functional complexity of the equipment leads to the integrated diagnosis optimization problem as a large-scale NP problem. The dimensions of the independent variables for the test functions are increased to 60 and 90, respectively, to verify the superiority of the GWO algorithm in solving large-scale NP puzzles. Thirty test repetitions are carried out, and the simulation results are shown in Figures 11 and 12.


Comparing Figures 7, 11, and 12 reveals that the GWO algorithm maintains good convergence speed and accuracy with an increase in the dimension of the independent variables, and the stability of the algorithm remains unchanged. The convergence speed and accuracy of the GWO algorithm are significantly more potent than that of the other algorithms. In addition, it has certain advantages in solving large-scale NP problems. Therefore, since the parameters of the GWO algorithm are adaptive, it has a more significant advantage over other non-adaptive algorithms in terms of the algorithm’s speed and accuracy of the algorithm's optimization search, the stability of the algorithm, and the solution of complex problems.
Optimization analysis of integrated diagnosis based on the GWO algorithm
The integrated diagnosis optimization model of the equipment is shown in equation (51), and the constraints are shown in equation (35), such that
The GWO, SA, GA, GASA, and SCA algorithms simulate and analyze the integrated diagnosis optimization problem, and 30 repetitive simulation tests are conducted. The specific simulation results are shown in Figure 13. Figure 13(a) indicates that the GWO algorithm is significantly more potent than the other algorithms in terms of the convergence speed and accuracy of the integrated diagnosis optimization. For the overall convergence cost, the GWO algorithm has the most minor convergence cost, and the remaining three algorithms are comparable. Figure 13(b) shows that the stability of the GWO algorithm is stronger than that of the other three algorithms. The results of the GWO-based integrated diagnosis optimization are shown in Figure 13(c), where the preferred tests are

Integrated diagnosis optimization results: (a) fitness curves, (b) stabilization analysis, and (c) GWO optimization results.
The optimal results of the integrated diagnosis of each algorithm in 30 tests are listed in Table 4. The results of the SA-based integrated diagnosis optimization are that the preferred tests are
Optimization results of the integrated diagnosis.

For the number of preferred tests, the GWO algorithm optimizes four tests, which is significantly less than the other three. Compared with before the integrated diagnosis optimization, the number of tests of the device is reduced by 88.9%, and the test cost is saved by 89%. The GWO reduces the number of tests by 42%–55% and the test cost by 77.63%–83.91% compared with the other algorithms, which is the best in the optimization results.
In terms of constraints, all four algorithms satisfy the conditions of equipment diagnosability and are not substantially different from each other. The success rates of the algorithms are shown in Table 4. The success rates of GWO and SA are 100%, which is better than that of the other two algorithms. A non-parametric statistical test, Wilcoxon’s rank-sum test, was accomplished at 5% significance level to see whether the obtained results of GWO differ from other benchmark trainers in a statistically significant way. Therefore, the obtained P-values are shown in the table of results as well. Logically, P-values less than 0.05 are considered as powerful evidence against the null hypothesis.
In summary, the GWO has the best convergence rates and accuracy among other benchmark methods. Figure 13(b) shows that GWO is caused by other algorithms in terms of average performance and stability performance. The results of the P-values in Table 4 produced from the Wilcoxon’s rank-sum test indicate that the superiority is statistically significant.
Equipment integrated diagnosis optimization analysis
This section starts with the comprehensive evaluation of the test cost, integrating various influencing factors. According to the hierarchical analysis method, the test cost of each alternative test resource in lays the foundation for integrated diagnosis optimization. This section verifies the superiority of the proposed GWO algorithm through simulation. Finally, the GWO algorithm is used to obtain the results of the integrated diagnosis optimization of the equipment, further verifying the effectiveness and reasonableness of the GWO algorithm.
Conclusion
Based on the principle of spatial mapping, the integrated diagnosis optimization space of equipment is constructed for the integrated diagnosis optimization problem of the equipment. The mapping relationships of test space, resource space, fault space, and its subspace are established. Based on the logical mapping relationship of the integrated diagnosis space, the test optimization model and resource optimization model are found. Based on the logical connection between the subspace mapping variables, the test optimization and resource optimization models were integrated, and the integrated diagnosis optimization model was designed. Based on the hierarchical analysis method, the logical mapping relationship of the cost space was established to make the test resource allocation more reasonable. The cost matrix was evaluated to simplify the integrated diagnosis optimization model, which made the integrated diagnosis optimization process more sensible and practical. A simulation was used to verify the effectiveness of the proposed algorithm and model based on the GWO algorithm for the integrated diagnosis optimization model of the electronic equipment.
The integrated diagnosis optimization method of the equipment proposed in this paper effectively solves the current problem of the lack of correlation between test and resource optimization by establishing an integrated diagnosis optimization model based on the principle of spatial mapping. Based on the hierarchical analysis method and mapping relationship of the cost space, the integrated evaluation of the effect of each type of cost on the results of integrated diagnosis optimization makes the equipment test resource allocation more reasonable. The electronic equipment after integrated diagnosis and optimization has a critical fault detection rate of 100%, fault detection rate of 99.99%, fault isolation rate of 98.99%, and false alarm rate of 0.2993%. Compared with the before integrated diagnosis and optimization, the number of tests for the equipment has been reduced by 88.9%, and test costs have been saved by 89%.
In this paper, the proposed integrated diagnosis optimization has to be performed on the premise that the fault information of the device is known to address the inability to deal with unknown faults of the device. This integrated diagnosis optimization does not consider the effect of generic and multipurpose test resources on the results of the integrated diagnosis optimization. Therefore, in future, the research focuses on the following aspects: integrated diagnosis optimization for unknown faults, considering the effect of generic tests and multi-purpose test resources on the integrated diagnosis optimization, and a dynamic integrated diagnosis optimization strategy capable of reconfiguring tests by scheduling on-line test resources according to test resource faults.
Footnotes
Authors’ contribution
Concept and design: Xian-Jun Shi and Xu-ping Gu; data collection and analysis: Xu-ping Gu; drafting of the article: Xu-ping Gu; critical revision of the article for important intellectual content: Xu-ping Gu and Xian-Jun Shi; study supervision: Xian-Jun Shi. All the authors approved the final version of this article.
Data availability
All data that support the findings of this study are included in this manuscript and its supplementary information files.
Declaration of conflicting interests
The authors declared no potential conflicts of interest with respect to the research, authorship, and/or publication of this article.
Funding
The authors received no financial support for the research, authorship, and/or publication of this article.
Annex 1. Mapping relationships in the integrated diagnosis space
It is known that, the test space