
Abstract
Mini vehicles with a small wheelbase are extremely sensitive to road roughness. The aim of this study is to explore the influence of road information on ride comfort and enhance the ride comfort of mini vehicles. According to the 5-degree-of-freedom vibration model of an electric mini off-road vehicle, the partial differential matrix equation of system motion is established using the Lagrange method, and the frequency response characteristic of the system is analyzed. The input matrix of pavement unevenness is obtained by considering the mutual power spectrum density between front and rear wheels. Road surface roughness information is obtained using an instrument for measuring road roughness. A comprehensive objective function and a constraint condition are established for comfort and safety. Based on the parameters obtained through the optimum design of a 1/4 vehicle model, the optimized stiffness and damping coefficient of suspension are obtained using a MATLAB optimization program. The law of the vibration performance of off-road vehicles with respect to suspension stiffness and the damping coefficient is obtained through the analysis of optimized results. A driving simulation and a test are conducted on the electric mini off-road vehicle. The results show that the use of the measured pavement data as simulation input is closer to the actual situation and provides higher accuracy compared to the simulated pavement model. According to the optimization and test results, the parameters optimized by a 1/2 vehicle (5 degrees of freedom) vibration model are better than those optimized by the 1/4 vehicle vibration model. The optimization results confirm reduction in acceleration, acceleration power spectrum density, and the root mean square of the weighted acceleration of the seat. This shows that the electric mini off-road vehicle provides better ride comfortability after optimization.
Introduction
In the 21st century, the automobile industry has been focusing on the areas of miniaturization, electrification, lightweight design, and intelligence. 1 In recent years, electric vehicles have been developed rapidly and battery technology is progressing. However, compared to conventional fuel vehicles, electric vehicles still have disadvantages such as short range and high price. The miniaturization of electric vehicles can help obtain higher mileage under the same battery capacity and solve the mileage problem to a certain extent. However, the ride comfort of electric mini off-road vehicles (EMORVs) deteriorates under the same road conditions owing to their smaller weight and wheelbase. Numerous studies have been conducted on the optimization of the suspension design of conventional vehicles. Lv et al. 2 and Shui et al. 3 used a simulation road model and a unified objective function to optimize suspension parameters for multi-objective design and obtained satisfactory simulation results. Pan and Liu considered an active suspension system model as the research object and optimized the parameters of passive suspension by utilizing a method that combined optimal control theory with the least square method. In addition, they verified the feasibility of the method. 4 Shi et al. used the Adams Car (MacNeal-Schwendler Corporation [MSC]) software to model the front suspension of a mini electric vehicle. They utilized the genetic algorithm toolbox of MATLAB (MathWorks Company, United States) to optimize hard-point coordinates. Simulation results showed that the optimized suspension exhibited ideal motion characteristics. 5 Pei et al. 6 employed the orthogonal experimental method to simulate the ride comfort of a mini sightseeing car using the Adams Car Ride software and obtained the relative optimal solution of the matching of suspension stiffness and shock absorber damping. Chen et al. established the semi-vehicle model of an ultra-mini vehicle, designed a multi-objective two-dimensional simulated annealing optimization method, and optimized the stiffness and damping of suspension under multiple spring loads. The effectiveness of the optimization method was validated through simulation. The method improved the ride comfort of the vehicle to a certain extent. 7 An and Wang constructed a hybrid objective function using a 1/4 vehicle model and employed an improved particle algorithm to optimize the parameters of passive suspension. The simulation results obtained through MATLAB/Simulink showed that the algorithm was effective, and the driving stability and ride comfort of vehicles were improved. 8 In recent years, increasing attention has been paid to hub motor electric vehicles. However, as hub motors lead to larger unsprung mass and worse ride comfort, the optimization of suspension structures is more important. Xiao et al. used simulations to verify that the increase in non-spring load quality had a strong influence on the ride comfort of a hub motor electric vehicle. A comprehensive optimization objective function was established, and the ride comfort of a hub motor electric vehicle was optimized using the ADAMS Car software. 9 Based on the structure of an electric vehicle driven by a hub motor, Zheng et al. considered the vertical weighted acceleration and the root mean square (RMS) acceleration of pitch angle as optimization objectives and used an improved genetic algorithm based on fitness estimation to optimize suspension parameters. The improved genetic algorithm could effectively optimize the objective function, and the optimized suspension system could improve ride comfort while satisfying handling stability. 10 Ma et al. considered the minimum RMS and square of the vehicle ride comfort index as the optimization objective and the maximum vertical displacement as the constraint condition. They employed a pattern search function to optimize the suspension structure of a hub motor. Simulation results showed that the optimized suspension structure could improve the wheel grounding performance and ride comfort of electric vehicles. 11 Our team has studied an EMORV driven by a hub motor. A comprehensive objective function based on safety and comfort is established according to a 1/4 vehicle model, and the suspension stiffness and optimal damping ratio are determined. Experimental results show that the EMORV provides good ride comfort. 12 Previous studies based on 1/4 vehicle models have not examined the effects of front and rear axle suspension parameters on vertical vibration acceleration (VVA). To study the influence of front and rear suspension parameters on the ride comfort of the EMORV, a 5-degree-of-freedom (DOF) vehicle model is established and the response characteristics of the vibration model are analyzed. The suspension parameters of the 5-DOF vehicle model are optimized based on the optimized suspension parameters of the 1/4 vehicle model. The theoretical model of a pavement is established, and a test road is measured and identified. An actual vehicle test is carried out, and test results are compared and analyzed. The contributions of this study are as follows: it is validated that the optimal design based on the 5-DOF model is better than that based on the 1/4 vehicle model. In addition, the impact of the actual road surface on the results is verified. This provides a reference for the optimal design of mini off-road vehicles.
Vibration model of EMORV
Analysis of vibration model
The simplified vibration models that are commonly used in vehicular design include the single-DOF vibration model, 2-DOF vibration model, 5-DOF vibration model, and 7-DOF vibration model. 13 Theoretically, the more the DOF of a vibration model, the closer the vehicle vibration characteristics are to reality. However, this makes modeling difficult because of the increased computational burden. Considering the symmetrical structure of an EMORV and assuming that the road conditions on both sides are the same, the vibration model of the EMORV can be simplified to a 5-DOF system (Figure 1). The parameters of the EMORV are listed in Table 1.

Five-DOF vibration model.
The parameters of the EMORV.

The partial differential equation for the 5-DOF vibration model can be established using the Lagrange method, as expressed in equation (1)

where

Equation (3) is obtained from equation (2)

Based on equation (3), the system of motion differential equations can be expressed as equation (4)

The detailed equation is expressed in equation (5)

where
Analysis of response characteristic of EMORV
Equation (6) is obtained by Laplace transform of equation (4), and

The frequency response characteristic (FRC) of the system is obtained using equation (7)

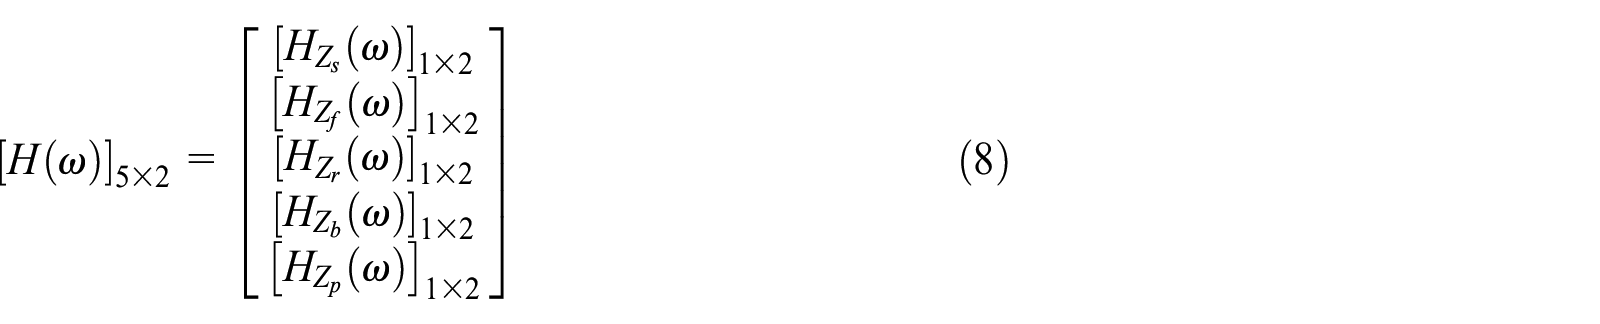
The main parameters generally considered for studying ride comfortability are the VVA of the seat, the dynamic deflection of the suspension, and the relative dynamic load (RDL) of the wheel. Based on equation (8), the FRC of each parameter can be expressed using equation (9)

where
The response power spectral density (PSD) of each parameter can be obtained using equation (10)

where
The RMS of each parameter can be obtained using equation (11)

where
Analysis and test of road roughness model
Road roughness model
The random excitation of a road surface is the most important source of vibration for EMORVs. The road surface model is commonly described using a road roughness function, and the displacement PSD is expressed in equation (12) 16

where
Equation (12) describes the displacement PSD of spatial frequency. The displacement PSD of time frequency is frequently used in practice. The time frequency PSD is expressed by equation (13)

where
When studying the road roughness excitation of a biaxial vehicle, the cross-power spectrum between the front and rear wheels should be considered in addition to the self-power spectrum input of the front and rear wheels.17–19 Accordingly, the road roughness input matrix can be expressed as follows

Pavement roughness measurement
The unevenness function of a single-wheel pavement has been generated using software in previous studies.20,21 Road roughness is measured to identify the characteristics of a road surface before simulation to make the simulation results close to an actual test. There are direct and indirect methods of identifying the roughness of a road surface. 22 The direct measurement method is simple and accurate. Therefore, it is employed in this study. Figure 2 shows the measuring device. In order to reduce the influence of tire stiffness on the measured data, a larger inflation pressure is applied to the roller wheel.
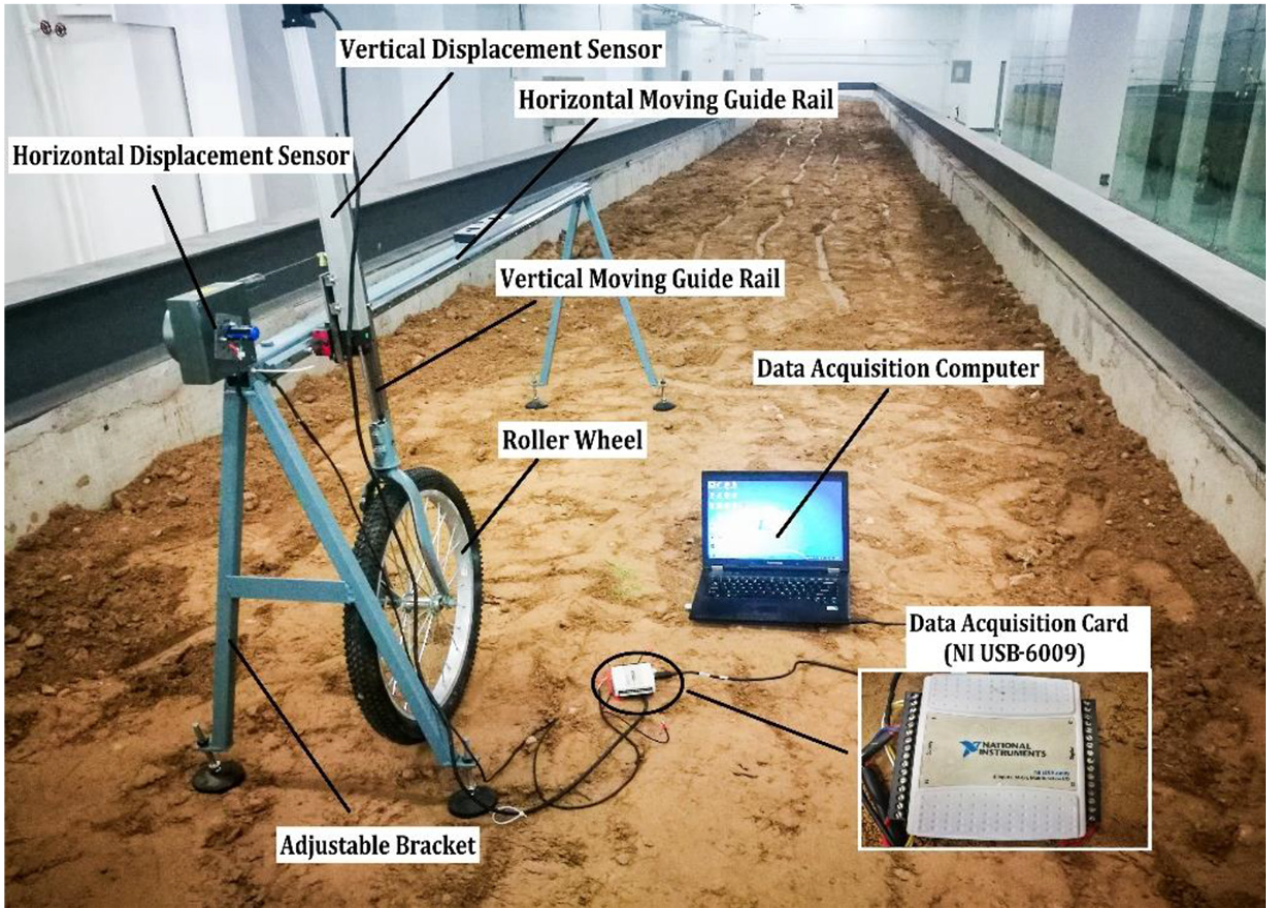
Road roughness measuring device.
The measurement test of the ground is carried out according to ISO 8608:2016 (Mechanical Vibration-Road surface profiles-Reporting of measured data). The data are processed by deaveraging, detrending, and filtering, 23 and the variation in vertical displacement with respect to horizontal displacement is obtained (Figure 3).

Variation in vertical displacement as a function of horizontal displacement.
The self-power spectrum density of the data is estimated using MATLAB software, as shown in Figure 4. Based on equation (12), the collected data are linearly fitted in a spatial frequency range of 0.011−2.83. Figure 5 shows the result, and the frequency index
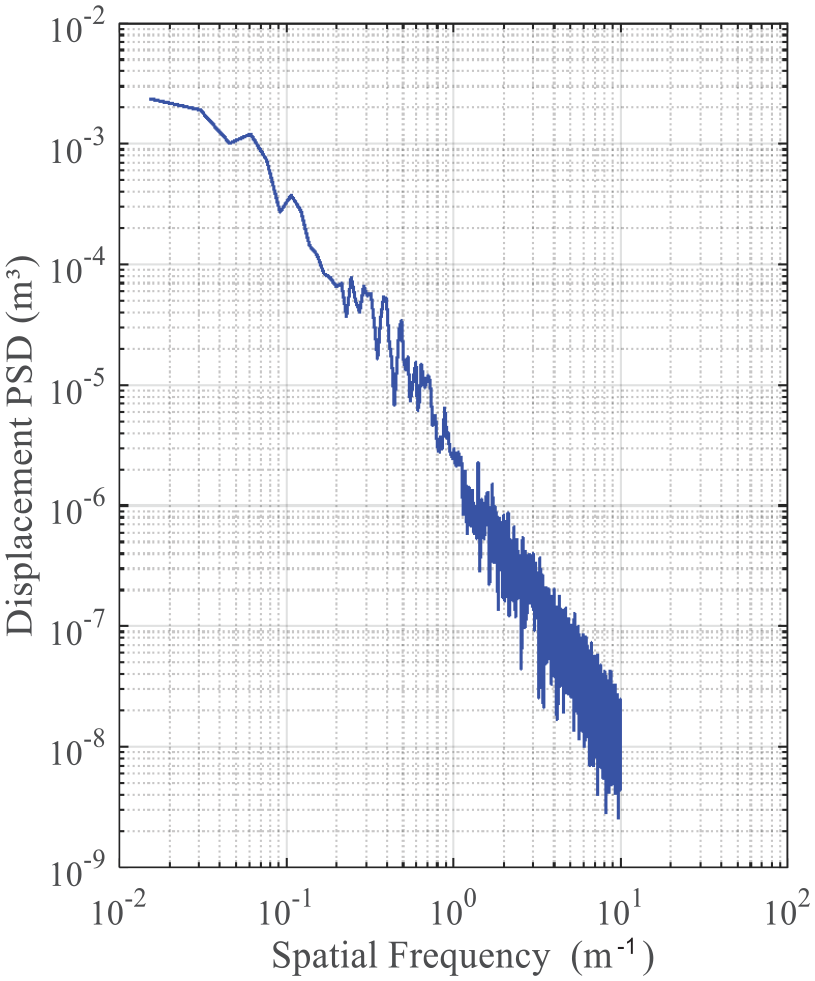
Variation in displacement PSD as a function of the spatial frequency.

Fitting line of the displacement PSD.
A road can be divided into eight levels as per ISO 8608-2016. According to the road classification map, it is known that most pavements belong to C-level roads and only low-frequency sections extend to D-level roads. In addition, the pavement condition is uniform. Therefore, the test road can be considered as a C-level road.
Design and simulation of suspension parameters
Optimal design of suspension
The comfortability and safety of the EMORV are the design objectives. The stiffness and damping coefficient of the front and rear suspensions are the design variables. The objective function,

where
The constraint condition is that the dynamic deflections of the front and rear suspensions do not exceed the allowable value of 1/3. The optimized damping ratio of the rear suspension is in a range of 0.2−0.4, and the optimized natural frequencies of the front and rear suspensions are in a range of 1.5−2.0 Hz. 24 Therefore, the optimal design equation for the suspension can be expressed as equation (16)

where
The global optimization of the target function is carried out in the constraint range using the global search function in MATLAB. The simulation condition is that the EMORV runs straight on the C-level road with a speed of 30 km/h. Based on the optimization results of 1/4 vehicle model,
12
the value of weighted coefficient (α) is 0.652, the parameters before optimization are obtained as shown in Table 2. Table 1 lists the values of the simulation parameters, and Table 2 lists the optimized results.
Optimized values of the suspension parameters.

Analysis of optimization results
According to Table 2, after the optimization, the stiffness values of the front and rear suspensions are
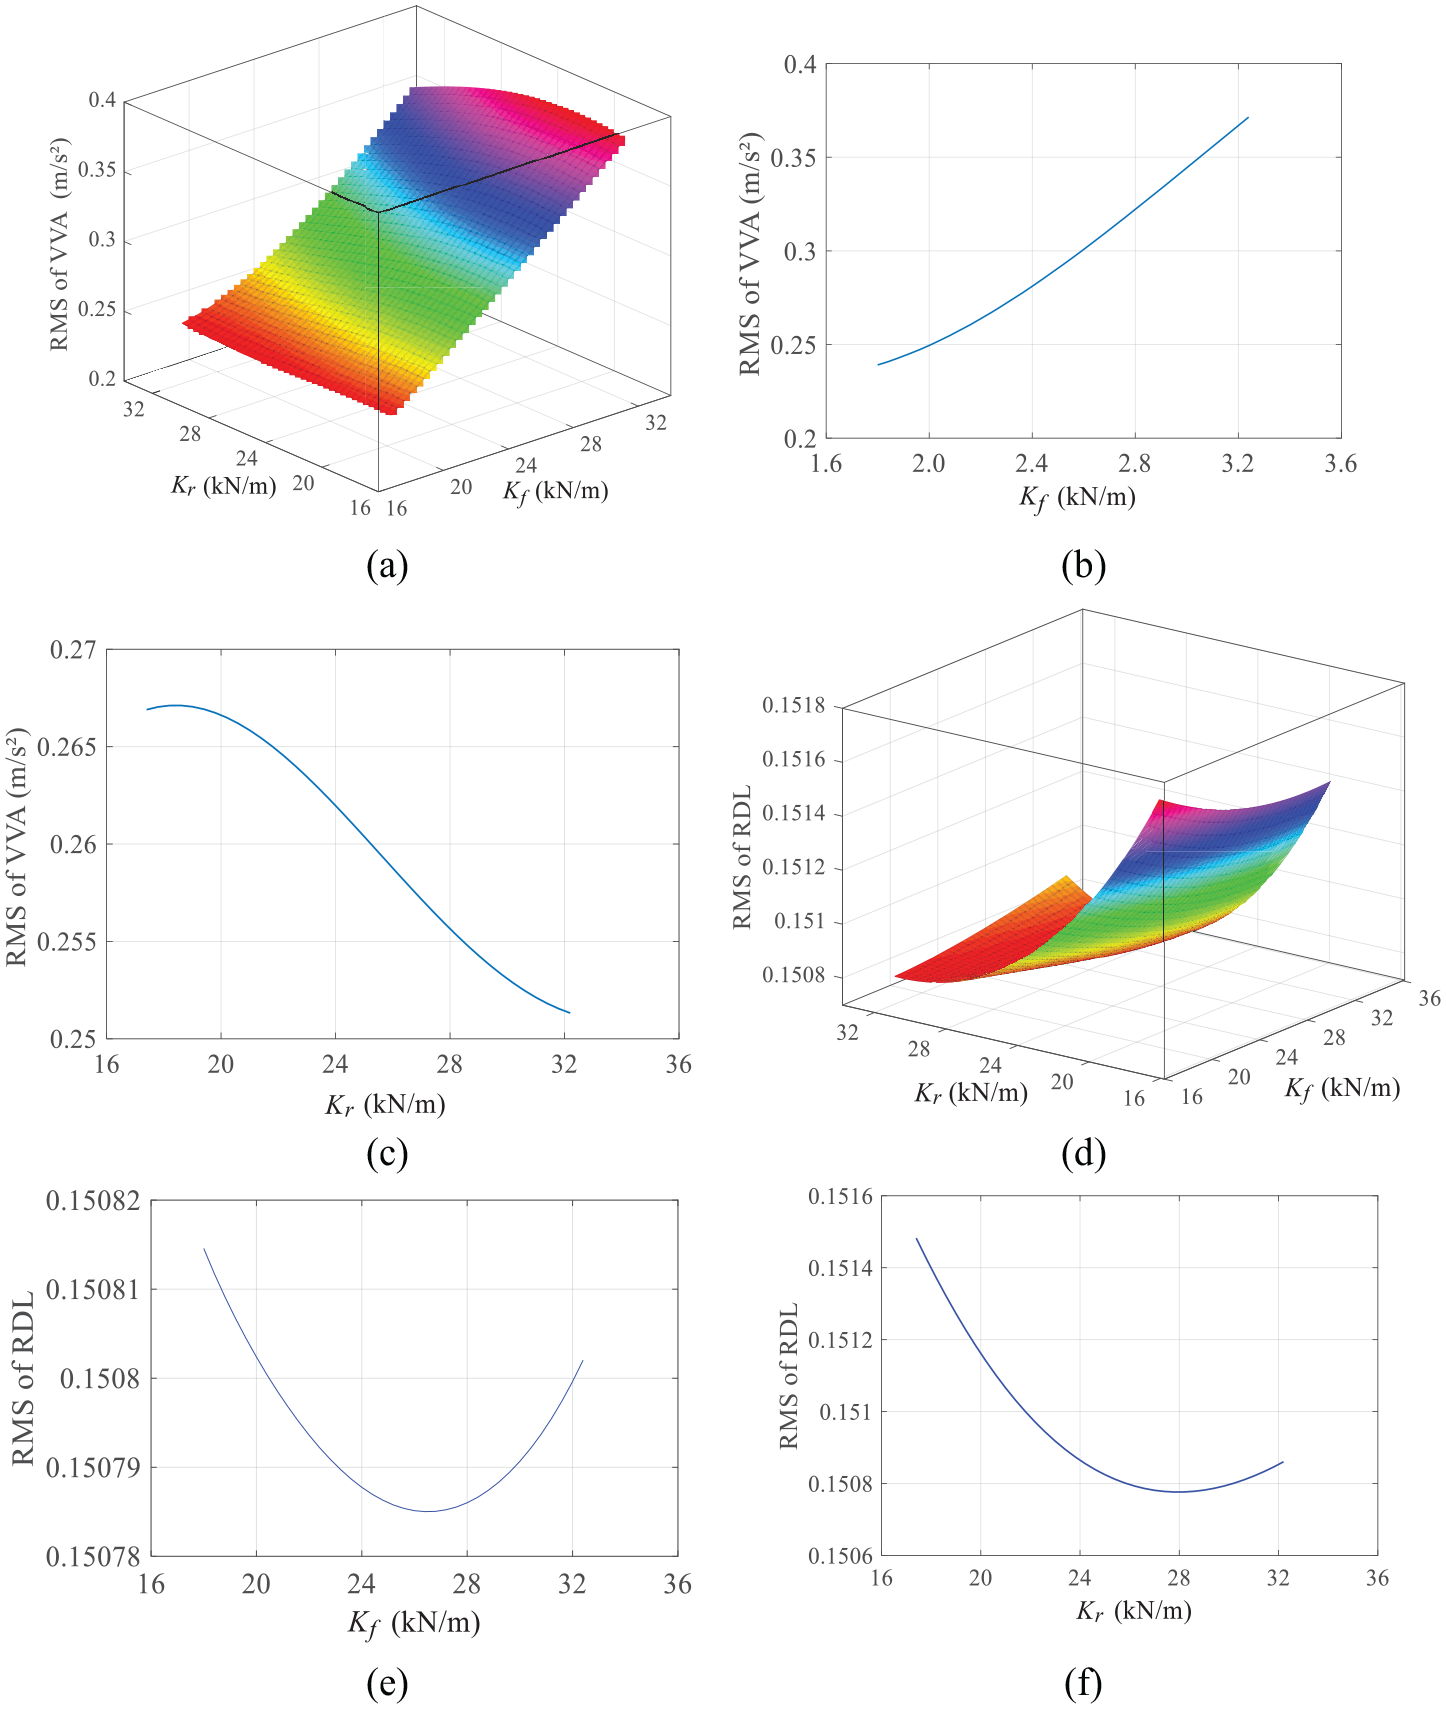
Variation in the VVA of the seat and RDL with respect to
According to Figure 6(a), the RMS of the VVA of the seat increases with the stiffness of the front suspension. However, with the increase in the stiffness of the rear suspension, it first increases and then decreases. The stiffness of the front suspension has a more evident effect on the RMS of the VVA of the seat. Figure 6(b) shows the variation in the RMS of the VVA of the seat with the stiffness of the front suspension when the front suspension stiffness is
When the stiffness values of the front and rear suspensions remain unchanged, the variation trend of the RMS of the VVA of the seat and RDL can be obtained by changing the damping coefficient of the front and rear suspensions, as shown in Figure 7.
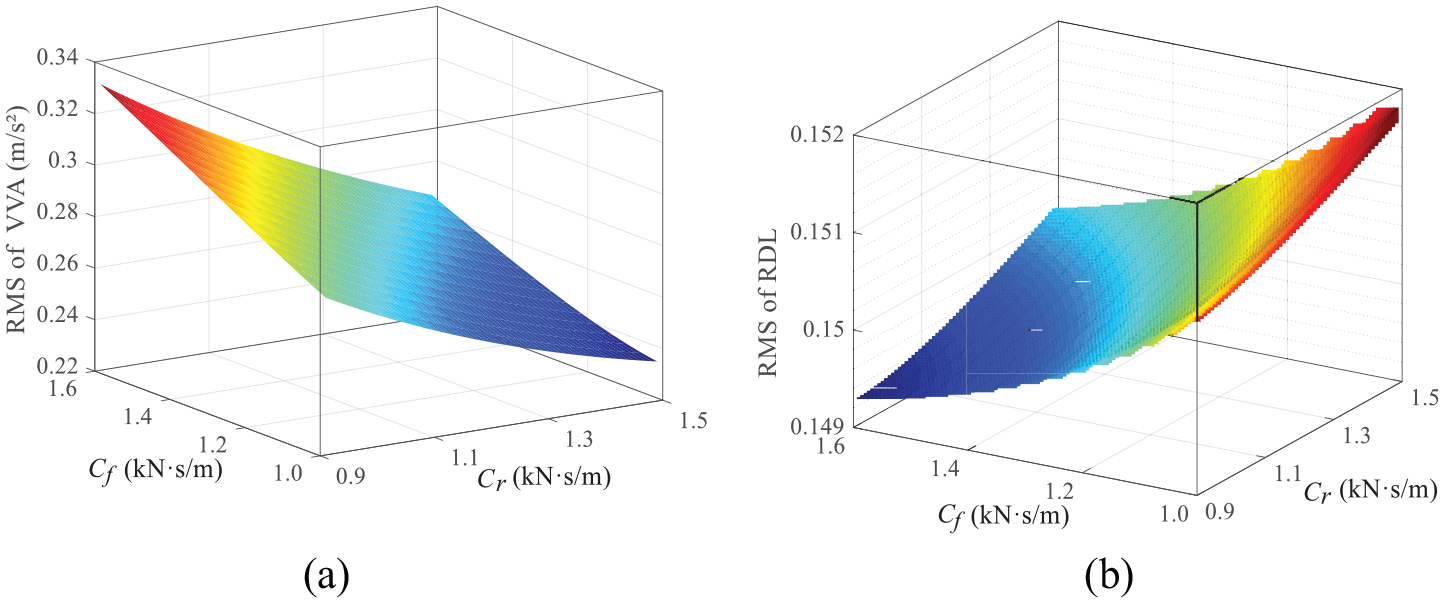
Variation in the VVA of the seat and RDL with
According to Figure 7, the variation trend of the RMS of the VVA of the seat is opposite to that of the RMS of the RDL. In other words, with the increase in the damping coefficient of the front suspension and with the decrease in the damping coefficient of the rear suspension, the RMS of the VVA of the seat increases, whereas the RMS of the RDL decreases.
Comparing Figures 6(a) and 7(a), we find that the front suspension stiffness has the strongest influence on the RMS of the VVA, whereas the rear suspension stiffness has the weakest influence. The comparison between Figures 6(d) and 7(b) shows that the stiffness of the front suspension has the weakest influence on the RMS of the RDL. Overall, the influence of the damping coefficient of the suspension on the RMS of the RDL is larger than that of the stiffness of the suspension. Therefore, the stiffness of the front suspension should be adjusted first to reduce the RMS of the VVA. The damping coefficients of the front and rear suspensions should be mainly adjusted to reduce the RMS of the RDL.
Figure 8 shows the variation curves of the transfer characteristics, the PSDs of the VVA of the seat, and the PSDs of dynamic load before and after the optimization. Figure 8(a) shows that the transfer characteristic of the VVA of the seat is significantly optimized within a frequency range of 1.4−3.15 Hz. When the frequency exceeds 3.15 Hz, there is no evident difference in the acceleration transfer characteristics before and after the optimization. From Figure 8(b) and (c), we find that the PSD of the VVA of the seat clearly decreases and ride comfortability increases. And the PSD peak value of dynamic load decreases, and driving safety increases. Therefore, the optimized suspension parameters make the vehicle have better ride comfort and safety.
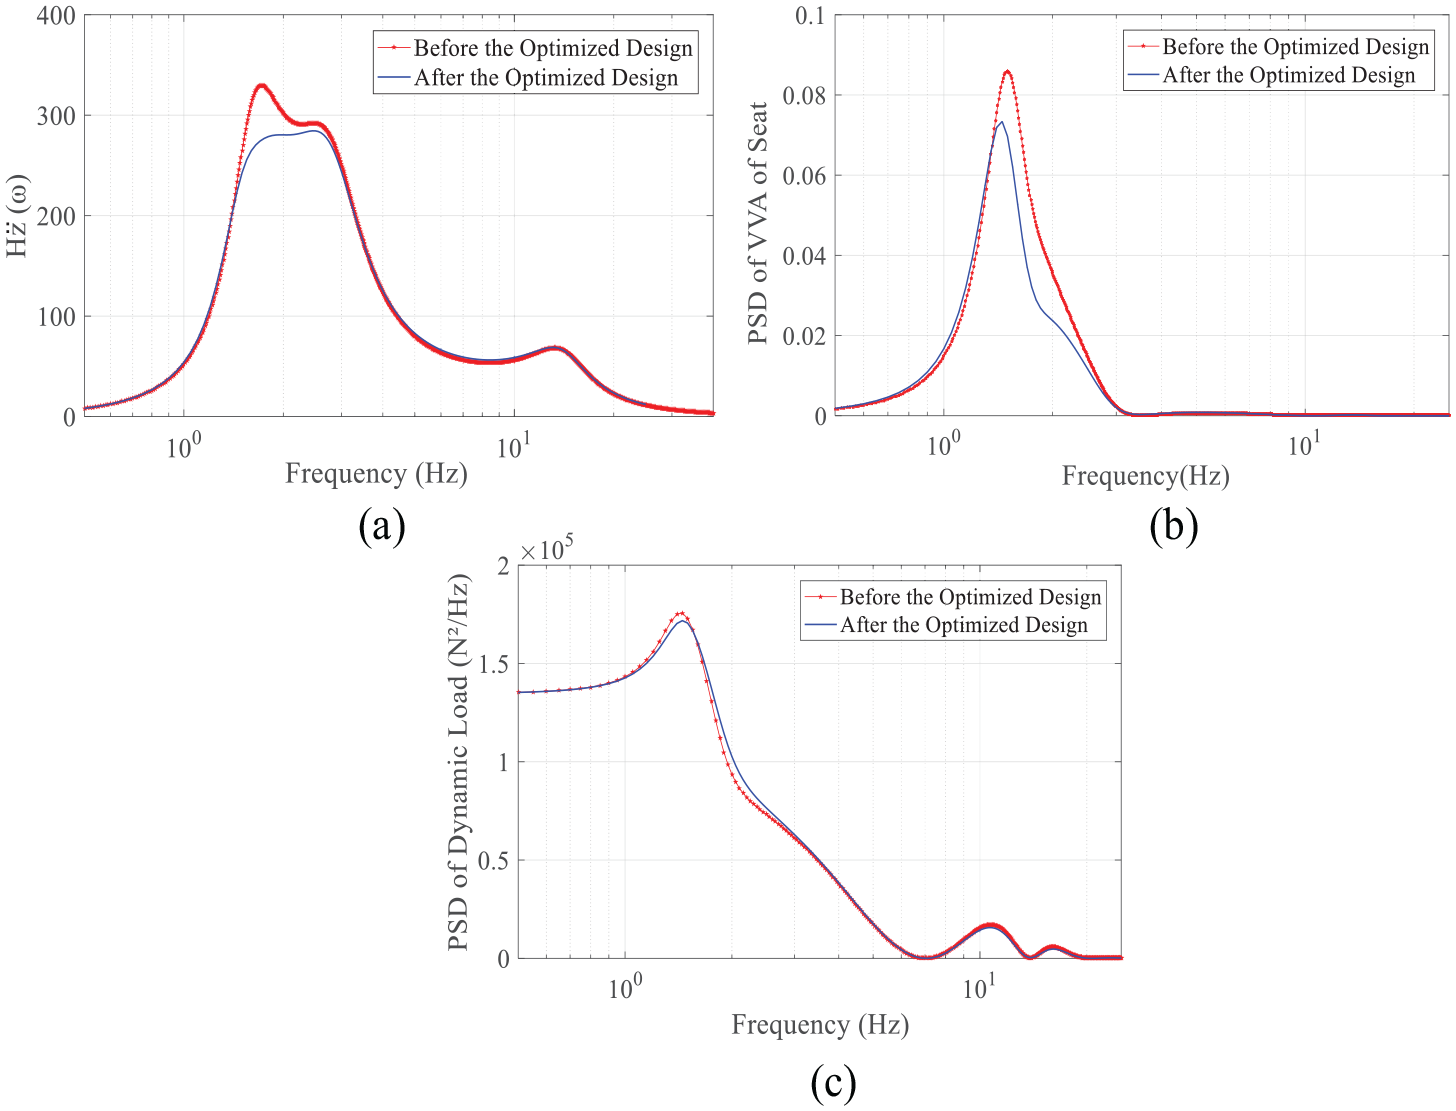
Variation trends of transfer characteristic and PSD: (a) Transfer characteristics of the VVA of the seat. (b) PSD of VVA of the seat. (c) PSD of dynamic load.
Driving simulation and test
Simulation analysis of driving
The driving simulation analysis of the time-domain model is performed to analyze the simulation results more intuitively. The time-domain method is used to simulate the driving test based on the optimal design results. Equation (4) is transformed into an expression of the state equation, and the state vector is expressed by equation (17)

According to equations (17) and (4), the state space equation can be expressed using equation (18)

where


The data of the measured pavement are used as the input for the simulation, and it is assumed that the surface roughness values of the front and rear wheels are the same. Figure 9 shows the simulation flowchart. In the diagram, Measured_data represents the actual measured road surface data, A represents the system matrix, and B represents the input coefficient matrix. The Transport Delay Function is used to simulate the time delay between the front and rear wheels. Tables 1 and 2 list the values of the simulation parameters.

MATLAB/Simulink simulation flowchart.
Figure 10(a) shows the VVA of the seat before and after the optimization. Figure 10(b) shows the weighted RMS of VVA of the seat before and after the optimization. The graphs show that after the optimization, the VVA of the seat and the RMS of the VVA decrease and ride comfortability improves. As shown in Figure 10(c), the optimized RDL value is slightly less than that before optimization, and safety is slightly increased. The optimized RDL value is less than 1, that is, dynamic load does not exceed the weight of the rear axle. Therefore, the wheel will not jump off the ground when the EMORV runs on a C-level road with a velocity of 30 km/h. As shown in Figure 10(d), the dynamic deflection of the optimized suspension increases slightly but does not exceed 0.03 m, thus meeting the requirements of the optimization design.
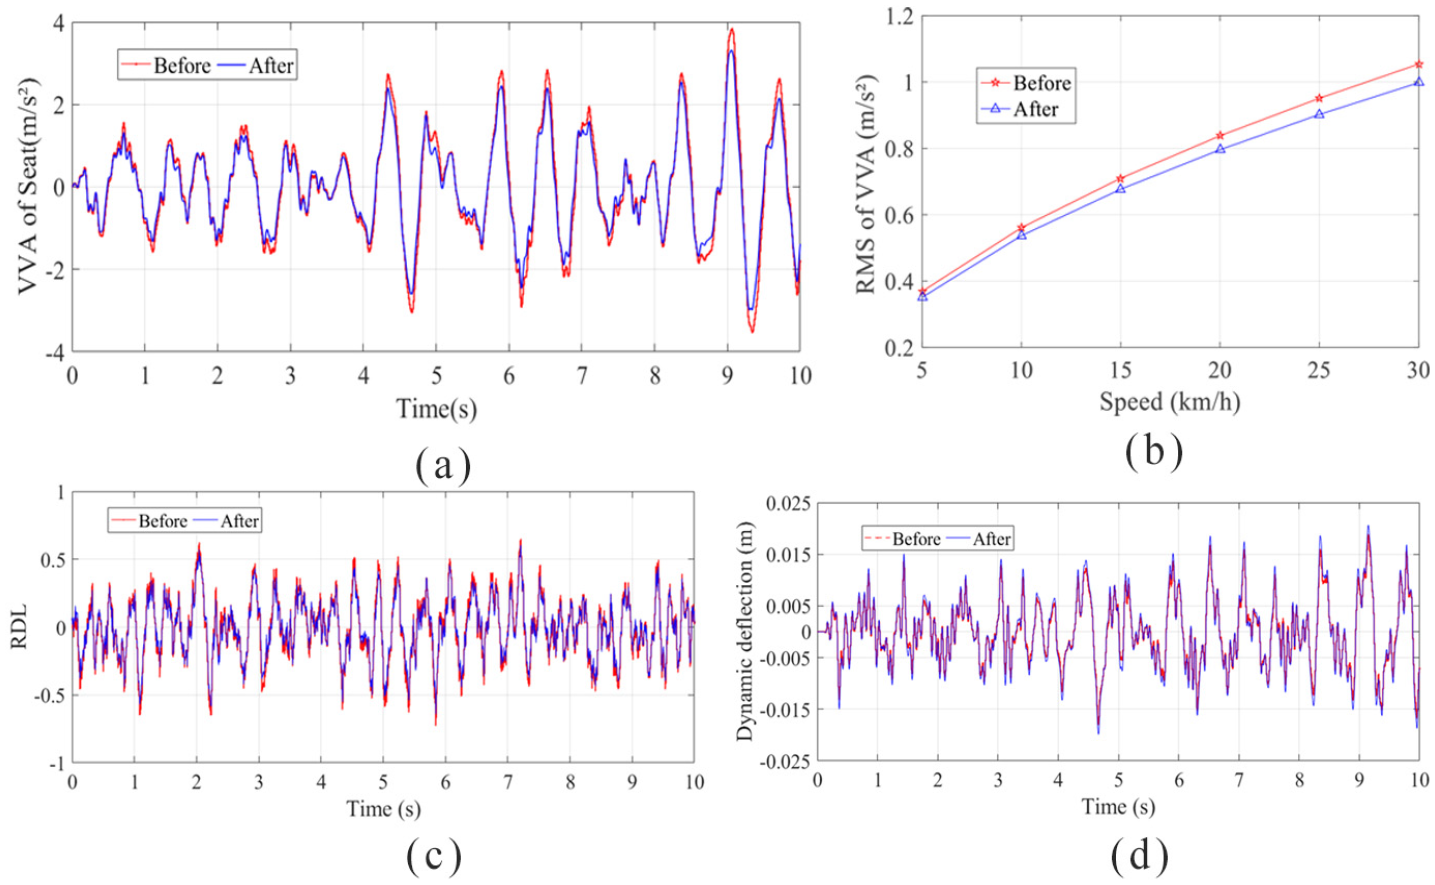
Comparison of parameters before and after optimization: (a) VVA of the seat. (b) Weighted RMS of VVA of the seat. (c) RDL of rear suspension. (d) Dynamic deflection of rear suspension.
Test of C-level road driving
Accelerometers are mounted on the body above the front and rear axles and on the seat (Figure 11). The data-acquisition card is NI USB-6009 (National Instruments), and the collection program is written in the LabVIEW software (National Instruments). In the driving test, the speed interval between each group is 5 km/h. Each experiment is carried out six times to eliminate the influence of road slope.

Test site.
The driving test is carried out using the stiffness and damping coefficient before the optimization. After the test is completed, the spring is replaced and the mounting dimensions and angles of the damper are adjusted to make the stiffness and damping coefficient of the suspension meet the requirements of the optimized parameters. Then, the driving test is repeated. Finally, the test data are analyzed and the test curves of the seat are obtained (Figure 12).

VVA of the seat at a velocity of 30 km/h.
As shown in Figure 12, the VVA of the seat decreases after the optimization, and the decrease is more evident than that shown in Figure 10(a). Moreover, the ride comfortability of the driver improves. The possible reasons for this are as follows: (1) the machining error in the spring leads to the softening of the stiffness of the front suspension or the hardening of the stiffness of the rear suspension. (2) The damping coefficient of the front suspension decreases or the damping coefficient of the rear suspension increases after the damper is adjusted. (3) After repeated driving tests, the characteristics of the road could have changed; in other words, the road surface could have become increasingly flat.
To fully reflect the damping effect of the EMORV, the PSD of the road surface displacement is converted to the acceleration PSD at a speed of 30 km/h. The PSD of road acceleration is compared with the PSD of the VVA of the seat before and after the optimization, as shown in Figure 13. The excitation of the road surface is clearly attenuated after optimizing the suspension of the EMORV. The attenuation amplitude increases with frequency, indicating that the vibration damping effect of the vehicle is more evident under the high-frequency excitation of the road.
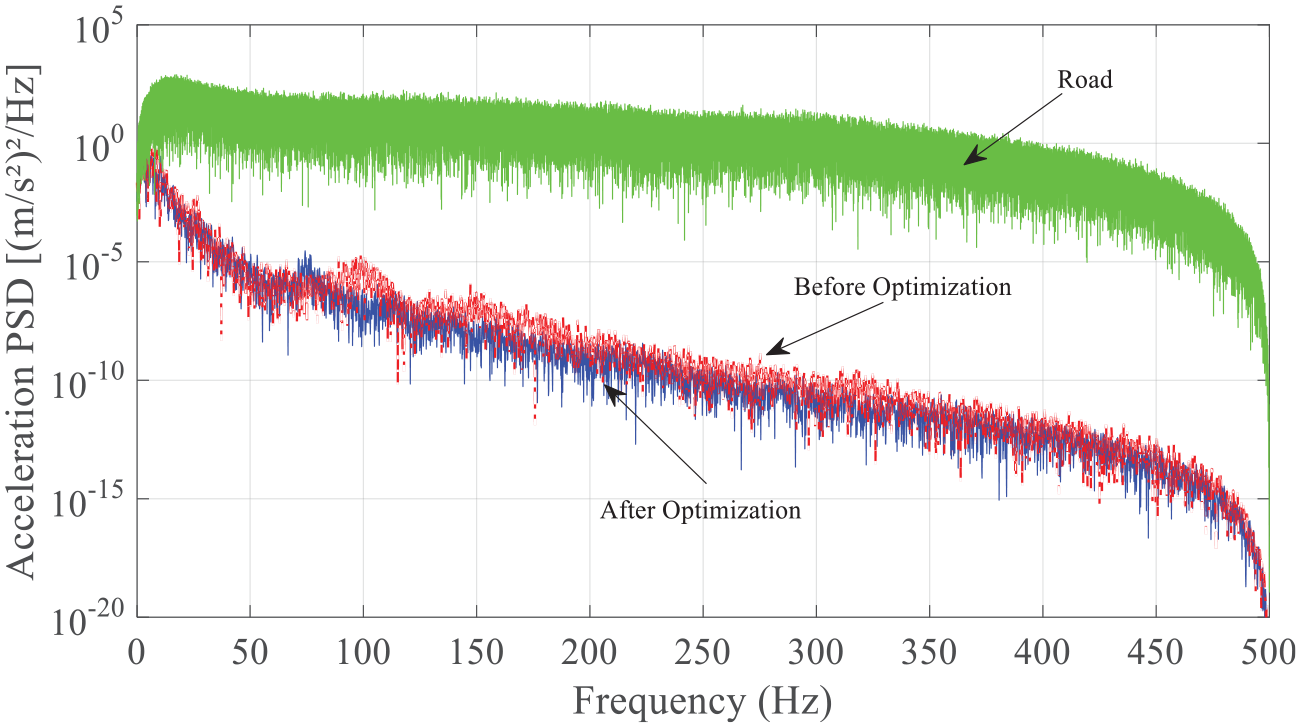
PSD of the acceleration.
As the driver is more sensitive to low-frequency vibrations, the PSD of the low-frequency region (Figure 14) is obtained by increasing the low-frequency area shown in Figure 13. Comparing the acceleration PSDs before and after the optimization in Figure 14, we find that in the low-frequency region, the optimized acceleration PSD is lower than the PSD before the optimization. Therefore, the ride comfortability of the driver is improved.

PSD of the acceleration at low frequency.
A basic evaluation method is used to analyze the ride comfortability of the EMORV.
25
The expression of the weighted RMS

where
The weighted function expression is given in equation (20)

where
The RMS of the VVA of the seat can be obtained using equations (19) and (20). As shown in Figure 15(a) and Table 3, the RMS of the VVA of the seat increases with the vehicle speed. The RMS of the VVA before and after the optimization is extremely similar when the vehicle speed is lower than 10 km/h. When the speed exceeds 10 km/h, the RMS of the VVA of the seat after the optimization is significantly lower than that before the optimization, indicating that the optimized EMORV provides better ride comfortability. This is in agreement with the previous conclusions. Figure 15(b) shows three different lines for the RMS of the VVA. First, the blue solid line with the legend “Test” in Figure 15(b) represents the RMS of the VVA measured via the actual vehicle test. The green solid line with the legend “MR” represents the simulated RMS of the VVA with the vehicle model and actual road data inputs. The last magenta dashed line with the legend “SR” represents the pure simulated RMS of the VVA using the vehicle and road model. As shown in Figure 15(b), the “MR” line is closer to the “Test” line, which indicates that the actual road contains more complex information. Hence, the results obtained using the measured pavement data as simulation input are closer to the actual result.

Weighted RMS of acceleration: (a) RMS of VVA before and after optimization. (b) Contrast Curve of RMS of VVA.
RMS of VVA before and after optimization.

Conclusion
In this study, a 5-DOF vibration model of an EMORV was established and the FRCs of the model were analyzed. Optimization equations were established considering ride comfortability and safety as objective functions and the dynamic deflection, suspension damping ratio, and natural frequencies of front and rear axles as constraints. The optimization equations were simulated using MATLAB. Suspension parameters and the variation in vibration performance with respect to these parameters were obtained. We simulated and analyzed the vibration response characteristics of the optimized model by considering the 5-DOF time-domain model of the mini off-road vehicle as the simulation object and the measured pavement information as input. Through comparison with experimental results, we concluded that after optimization, the EMORV exhibited lower acceleration, acceleration PSD, and the RMS of weighted acceleration. Furthermore, the use of measured pavement data as analog input was closer to the actual situation and provided higher accuracy compared to the analog pavement model. However, it also increased the test workload. According to the optimization and test results of this study, the parameters optimized by the 1/2 vehicle (5-DOF) vibration model were better than those optimized by the 1/4 vehicle vibration model. According to the results of the study, the weighted coefficients
Footnotes
Acknowledgements
The author(s) would like to thank to all the students taking part in the experiment from College Of Engineering, China Agricultural University.
Declaration of conflicting interests
The author(s) declared no potential conflicts of interest with respect to the research, authorship, and/or publication of this article.
Funding
The author(s) disclosed receipt of the following financial support for the research, authorship, and/or publication of this article: This research was supported by the National Natural Science Foundation of China (General Program, grant no: 51775548).