
Abstract
When the vehicle is in motion, the elastic deformation of the flexible subframe significantly influences ride comfort. Therefore, it is crucial to investigate the impact of flexible subframes on vehicle ride comfort. In order to enhance the reliability and optimization efficiency of our research, this paper incorporates the concept of elastic deformation in the flexible subframe into the investigation of vehicle ride comfort, and proposes a multi-objective optimization approach to enhance the overall vehicle ride comfort. The vibration mathematical model elucidates how flexible subframes affect vehicle ride comfort and establishes a rigid-flexible coupling model for a specific vehicle with a flexible subframe to analyze the impact of its elastic deformation on vehicle ride comfort through simulation experiments. Subsequently, a radial basis function approximation model is established, and the multi-objective particle swarm optimization and non-dominated sorting genetic algorithm II algorithms are employed to conduct multi-objective optimization of the stiffness of the subframe bushing with the aim of enhancing vehicle ride comfort. The findings indicate that the flexible subframe has a significant impact on vehicle ride comfort. Specifically, on bump roads, peak values of vertical and longitudinal seat accelerations decrease while lateral seat acceleration increases. On random roads, peak values of longitudinal and lateral seat accelerations increase while vertical acceleration decreases. Furthermore, the stiffness of the subframe bushing optimized by the non-dominated sorting genetic algorithm II algorithm further enhances vehicle ride comfort and aligns more closely with the optimization requirements in this study.
Introduction
Ride comfort is a crucial factor in vehicle performance as it directly impacts the passenger experience. When a car is traveling at a normal speed, the vibrations generated by the interaction between the car and the road surface can significantly impact passenger comfort and potentially damage transported goods. How to reduce these effects and ensure that passengers have a smooth and comfortable driving experience has become the most concerning issue for people. Understanding the dynamics and factors that affect riding comfort is essential for optimizing vehicle design and enhancing passenger satisfaction.
Vehicle ride comfort is generally improved by studying and optimizing the suspension, which is mainly affected by the suspension system between the body and the wheels. Scholars have conducted a lot of research on the ride comfort of the vehicle. Zhang et al. 1 delved into the non-stationary response of vehicle suspension under random road excitations. Their work introduced a fresh perspective on optimizing ride comfort by focusing on suspension energy dissipation. Huang et al. 2 established a vertical rigid-flexible coupling model for high-speed vehicles, placing emphasis on the flexible vibrations of the vehicle body. Their research explored how body-mounted equipment influences flexible vibration reduction, blending numerical and experimental studies to suggest strategies for vibration mitigation. Huang et al. 3 advanced a multi-objective interval analysis approach to fine-tune both the optimal average performance and robustness of vehicle vibroacoustic comfort. Their method aimed to strike a balance between performance and resilience. Zhang and Cai 4 embarked on an extensive exploration of the various factors that impact ride comfort, culminating in the optimization of ride comfort to elevate the overall passenger experience. He et al. 5 turned their attention to commercial vehicles, formulating a 12-degree-of-freedom vibration model that integrated a flexible body, bushings, and nonlinear damping in the cabin. Their research yielded a novel dynamics model and proposed a comprehensive analysis and optimization method to enhance in-cabin comfort. Chen et al. 6 innovatively merged a nonlinear mathematical model with the conventional vibration model to create a more precise ride comfort model. Employing a hierarchical optimization method, they sought to elevate the overall ride comfort of vehicles. Jie et al. 7 devised a rigid-elastic synthetic model for conducting sensitivity analyses of ride comfort in heavy-duty vehicles, contributing to a deeper understanding of this vital aspect of vehicle performance. However, existing research mainly focuses on suspension characteristics or structural design optimization, and there is no relevant research on the impact and optimization of the subframe on ride comfort. The subframe, as an integral component of the vehicle structure, assumes a pivotal role in supporting the vehicle and carries significant responsibilities. It has a profound influence on the vibration characteristics and stiffness of the vehicle and is intricately linked to the overall ride comfort experienced by occupants. Research efforts have been directed towards comprehending the role of subframes in vehicle dynamics and ride comfort: Seifi et al. 8 proposed a method for optimizing the design of a vehicle suspension system by analyzing a comprehensive 11-degree-of-freedom vehicle model, which considers road grip, working space, and the ability to prevent overturning while enhancing ride comfort. Fossati et al. 9 presented a multi-objective optimization approach for passive suspension systems of vehicles operating on diverse road conditions. Ride comfort represents a crucial research focus in the field of vehicle engineering, and its investigation and optimization hold significant implications. However, scholars primarily focused on analyzing and optimizing suspension characteristics, with little consideration given to the impact of the subframe, particularly the influence of bushing stiffness at the joint of the subframe, suspension, and vehicle body on vehicle performance over bump and random roads, and the method of optimizing the stiffness of the lining at the connection between the subframe, suspension, and body to improve the ride comfort of the vehicle on random and bump roads has not been proposed.
As a crucial component of the vehicle structure, the subframe serves as a vital support system, significantly impacting the vibration and stiffness of the vehicle and consequently influencing its ride comfort. It is necessary to study the influence of the elastic deformation of the flexible subframe on the vehicle ride comfort on random road and bump roads. Jinzhi et al. 10 investigated the feasibility of using magnesium alloys for the construction of subframes. This approach involves modifying material properties and enhancing subframe structures. By altering these factors, the study aimed to assess the potential improvements in subframe performance and, by extension, their influence on ride comfort. Wang et al. 11 developed a finite element model for the subframe, focusing on analyzing its strength and modal characteristics. Additionally, subframes are typically connected to the vehicle body and suspension using rubber bushings, and the mechanical properties of these bushings play a significant role in the vehicle's ride comfort. 12 Zhang and Li 13 conducted research on how the stiffness of rubber bushings affects suspension stiffness. Kemna et al. 14 explored the relationship between the mechanical properties of rubber bushings and robust suspension system design. Rivas-Torres et al. 15 carried out an optimization design for bushing stiffness. Yarmohammadisatri et al. 16 optimized the characteristics of the bushing to achieve ride comfort and handling as their optimization objectives. During the actual vehicle driving process, the subframe exhibits flexibility and undergoes elastic deformation. Therefore, to enhance the ride comfort of the vehicle, it is essential to consider the impact of subframe flexibility and optimize parameters while taking into account the coupling relationship between the subframe and suspension.
Additionally, parameter modeling and simulation analysis based on a rigid-flexible coupling model have assumed a pivotal role in the realm of dynamics research. The rigid-flexible coupling model is employed to enhance the predictive accuracy of the dynamic behavior of mechanical systems by accounting for the presence of flexible components. 17 Sharma et al. 18 established a rigid-flexible coupling model to investigate the influence of flexibility on the dynamic characteristics of rail vehicles. Their work underscored the necessity of considering elastic vibration in the domain of vehicle dynamics research. Deng et al. 19 constructed a rigid-flexible coupling model that incorporated flexible wheels to scrutinize the dynamic characteristics of flexible wheels in tracked vehicles. Jiang et al. 20 devised a rigid-flexible coupling vehicle model by incorporating flexible control arms and torsion beams. Their work focused on lightweight design research for suspension components. From the above literature, it is known that a rigid-flexible coupling model can be established after flexibilization of the subframe to comprehensively consider the impact of elastic deformation of the flexible subframe on the ride comfort of the vehicle, and then an optimization algorithm can be used to obtain more accurate and better system parameters to optimize the vehicle ride comfort.
In response to the appealing problem, this paper mainly researches the following key points: (a) taking the subframe of a car as the research object, using HYPERMESH software modal calculation to get the subframe modal neutral file (MNF), which is imported into ADAMS software to replace the original rigid subframe to establish the rigid-flexible coupling model of the whole car. The modal analysis of the subframe takes into account the influence of its modal frequency on the vibration. (b) The seven-degree-of-freedom vehicle dynamics equations are derived for vehicle vibration characterization, and the influence of subframe flexibility on ride comfort is explained. (c) Random input and impulse input simulation analysis of ride comfort is carried out to analyze the influence of flexible subframe elastic deformation on vehicle ride comfort and the changing trend. (d) The bushing stiffness at the articulation points of the subframe with the body and the suspension is selected as a design variable, and the non-dominated sorting genetic algorithm II (NSGA-II) algorithm and multi-objective particle swarm optimization (MOPSO) algorithm are used to carry out the multi-objective optimization design of the vehicle ride comfort, and the optimization results obtained by the two optimization algorithms are compared, analyzed and verified.
The article is structured as follows: The “Establishment of a rigid-flexible coupling model of the whole vehicle” section focuses on the flexible treatment of the subframe and establishes a rigid-flexible coupling model for the entire vehicle. The “Analysis of vehicle vibration characteristics” section theoretically analyzes the impact of the flexible subframe on vehicle vibration characteristics. The “Effect of flexible subframe on ride comfort” section conducts simulation experiments to study how the flexible subframe affects vehicle ride comfort. To enhance ride comfort, a multi-objective design optimization method is proposed in the “Multi-objective design optimization method” section, with discussion and verification of optimization results in the “Optimization results and validation” section. Finally, conclusions are presented in the “Conclusion” section.
Establishment of a rigid-flexible coupling model of the whole vehicle
Establishment of finite element model of front and rear subframes
In general, the subframe is commonly represented as a rigid body in ride comfort simulation research, resulting in notable disparities between the simulation outcomes and real vehicle conditions. To mitigate this discrepancy, the study imported the three-dimensional (3D) geometric model of an actual car subframe in CATIA software into HYPERMESH software. It established finite element models for both the front and rear subframes and employed the Craig-Bampton (C-B) modal method to perform modal calculations on these models. Considering analysis time and file size constraints, calculations were conducted for the first 16 orders, resulting in the generation of modal neutral files for both front and rear subframes. The material properties of the front and rear subframes are shown in Table 1.
Material properties of the subframe.

During the establishment of the finite element model for the front and rear subframes, the complexity of the 3D geometric model, along with numerous connectors, posed challenges in mesh division and quality assurance. To address this issue, certain bolts and connectors between subframe components were omitted to simplify the geometry. Subsequently, a shell unit with a size of 4 mm was used for meshing, resulting in the generation of finite element models for both front and rear subframes as depicted in Figures 1 and 2, respectively.

Finite element model of the front subframe.
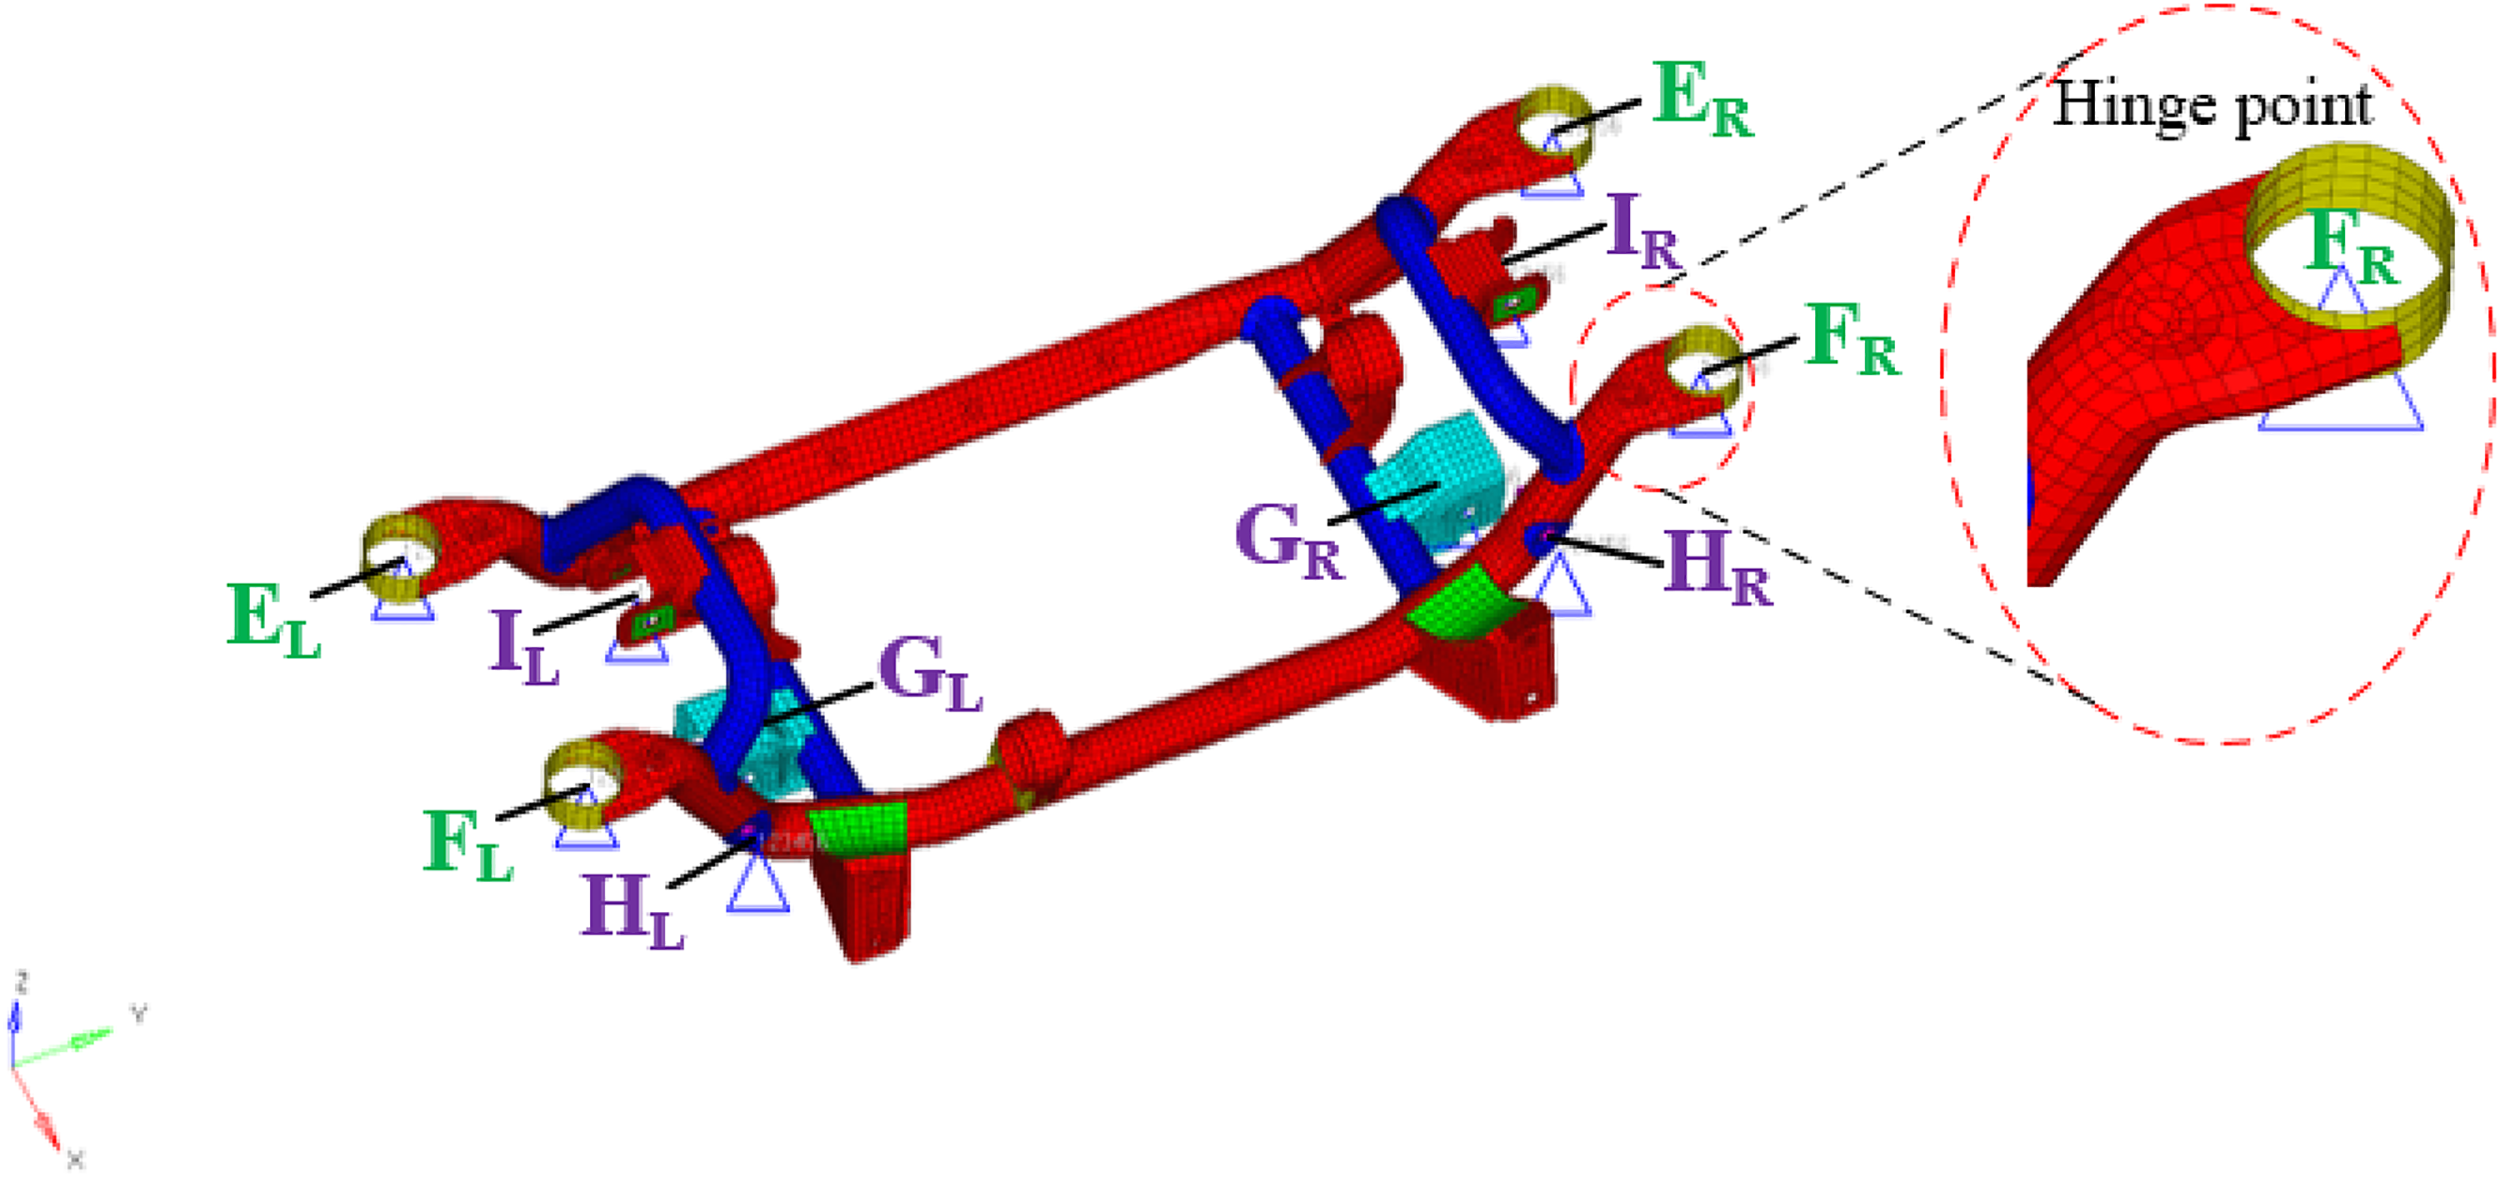
Finite element model of the rear subframe.
There are 454,732 nodes and 1,339,927 elements in the finite element model of the front subframe. In Figure 1, AL, AR, BL, and BR are the four hinge points between the front subframe and the body, and CL, CR, DL, and DR are the four hinge points between the front subframe and the bottom arm of the suspension, using bush connections. The rear subframe model, on the other hand, consists of 12,373 nodes and 12,363 elements. In Figure 2, ER and FR represent the left and right hinge points of the rear subframe connecting to the body, respectively. GR and GL are the left and right hinge points of the rear subframe connecting to the lower arm of the rear suspension, respectively. HR and HL denote the left and right hinge points of the rear subframe connecting to the front beam adjuster, respectively. IR and IL represent the left and right hinge points of the rear subframe connecting to the upper arm of the rear suspension, respectively. These hinge points are crucial connection points within the rear subframe, and they are all connected via bushing connections.
Modal analysis
In order to mitigate the adverse effects of road surface excitation and engine vibrations, subframe components are integrated into the vehicle's suspension system. However, a potential issue arises when the natural frequency of the subframe overlaps with the excitation frequency range of the vehicle, leading to resonance and potentially damaging the car's ride comfort performance. To address this concern, our study focuses on investigating the structural dynamic characteristics of both front and rear subframes through modal analysis, aiming to understand their natural frequencies and mode shapes.
In order to accurately analyze the low-frequency modes that have a more significant impact and are more susceptible to excitation, the study uses the EIGRL card in HYPERMESH, specifically employing the Lanczos method. This approach involves imposing constraints on the bushings that connect the front and rear subframes with the body and suspension, allowing for constrained modal analysis. The constrained positions are indicated in Figures 1 and 2, which represent the connection points between the subframes, body, and suspension. Ultimately focusing on analyzing the first four modes is essential for accurately studying these low-frequency modes that are more susceptible to excitation. Figure 3 illustrates the vibration patterns of some of these modes of both front and rear subframes. Additionally, Table 2 presents the first four orders of modal frequencies for both front and rear subframes.

Modal analysis diagrams of the subframe: (a) first-order mode of the front subframe, (b) second-order mode of the front subframe, (c) first-order mode of the rear subframe; and (d) second-order mode of the rear subframe.
Material properties of the subframe.

The vehicle dynamics model used in this study has an engine idle speed of 800 r/min and a rated speed of 2700 r/min, resulting in an engine excitation frequency range of 26.7–90 Hz. The suspension and body excitation caused by road conditions typically fall within a frequency range not exceeding 25 Hz. As indicated in Table 2, the natural frequencies of the front subframe and rear subframe are significantly different from those of the body and engine, thus avoiding resonance and meeting the vibration performance requirements for subsequent ride comfort simulation. These results provide an important basis for understanding the potential resonance sensitivity of the subframe and subsequent optimization of ride comfort.
Establishment of rigid-flexible coupling model of complete vehicle with flexible subframe
In order to comprehensively and effectively investigate the impact of the subframe on vehicle ride comfort, a rigid-flexible coupling model of the vehicle is established based on multibody dynamics theory. The subframe modal neutrality file generated in the “Establishment of finite element model of front and rear subframes” section is imported into ADAMS software to replace the original rigid subframe. This model incorporates 3D test data and real vehicle parameters, as depicted in Figure 4.

Rigid-flexible coupled vehicle multibody dynamics model.
Figure 4 also shows the subframe's installation position and connection mode in the rigid-flexible coupling model of the whole vehicle, which is connected to the suspension and the body through the bushing. In addition, the tire model used is the PAC2002 tire model with good stability, and the main parameters of the tire model and the whole vehicle are shown in Table 3.
Main parameters of tires and vehicles.

Analysis of vehicle vibration characteristics
Vehicle seven-degree-of-freedom (7-DOF) vibration model
In order to comprehensively and accurately describe vehicle movement and analyze dynamics, this study established a classical 7-DOF vibration system to investigate the impact of subframe flexibility on ride comfort. The model was developed under the assumption that the vehicle body is rigid, with 3-DOF for vertical motion (heave), pitch, and roll when the vehicle moves in a straight line at a constant speed. Additionally, the front wheels have 2-DOF for vertical motion, while the rear wheels account for their remaining 2-DOF. The configuration of the classical 7-DOF vibration system is illustrated in Figure 5.

A seven-degree-of-freedom model of a vehicle.
In Figure 5, x represents the forward direction of the car, mb is the mass of the car body, zb is the vertical displacement at the center of mass of the car body, mu is the unsprung mass, ms is the sprung mass, Ks is the suspension stiffness, Cs is the suspension damping coefficient, Kt is the tire stiffness, zu is the displacement of the unsprung mass, zs is the displacement of the sprung mass, and the subscript fl represents the left front position, fr represents the right front position, rl represents the left rear position and rr represents the right rear position. In addition, l1 is the wheelbase of the front axle, l2 is the wheel-base of the rear axle, lf is the distance from the center of mass to the front axle, lr is the distance from the center of mass to the rear axle, θ is the pitch angle of the vehicle, ϕ is the roll angle of the vehicle, and Ix is the roll moment of inertia, Iy is the pitch moment of inertia.
Mathematical model of vehicle vibration
When the pitch angle θ and roll angle ϕ are small, the vertical displacement at the four endpoints of the body has the following relationship:


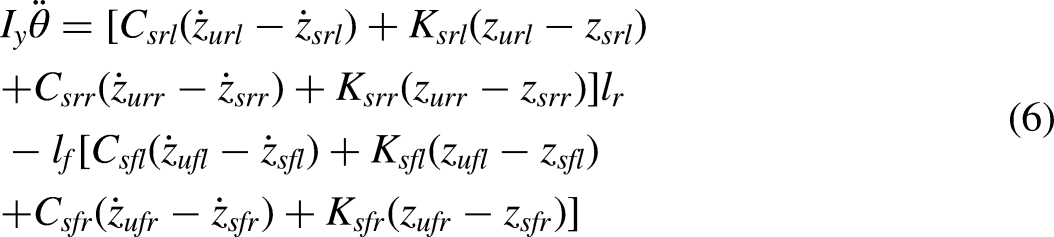
The vertical motion equation at the center of mass of the body is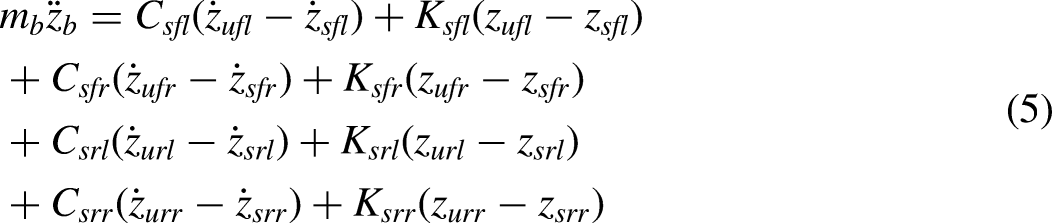


The intrinsic frequency of the system can be obtained by calculating the eigenvalues λn of the matrix 
Road excitation
Road excitation is the primary source of vehicle vibration during driving, significantly impacting ride comfort. Typically, vehicle vibration studies involve modeling random and convex roads. Random road roughness is categorized into eight grades (A–H) based on power spectral density. The main distinction between different road grades lies in their roughness, typically represented by the roughness coefficient Gq(n0). Equation (19) is used to fit the power spectra of longitudinal section elevation displacement of the road:
The 3D equivalent volume road model in ADAMS/Car software is used to simulate ride comfort on bump roads, as well as on bumpy, pitted, or irregularly undulating surfaces. This model accurately represents the road surface shape, providing a precise simulation environment and yielding more accurate data compared to other road models. It consists of a series of 3D planes composed of spatial triangular elements. When constructing the 3D equivalent volume road, the coordinates of each node are first specified in the road parameter coordinate system, followed by specifying three nodes and friction coefficients for each triangular element, as illustrated in Figure 6. Four triangular pavement elements A1, B1, C1, and D1 are defined by establishing nodes 1 to 6 with the normal direction of the triangular surfaces facing outwards.

Three-dimensional (3D) equivalent volume road schematic diagram.
Vibration response evaluation scale and its calculation
When a vehicle travels on the road, the impact and vibration are primarily caused by factors such as driving speed and random irregularities of the road surface. Subsequently, after traversing through a complete vehicle vibration system comprising tires, suspension, seat cushions, etc., equipped with elastic and damping elements, the resulting acceleration applied to the body by the seat is generated. Therefore, the ride comfort of a vehicle is assessed based on the human body's response to various vibration accelerations, i.e. riding comfort. In this study, the weighted root mean square (RMS) value of acceleration is used to assess the impact of vibration on human comfort and health.
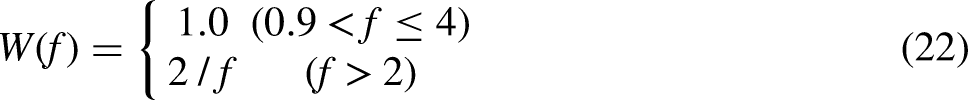
In practical studies, a commonly used method is spectral analysis, where the vibration acceleration time a(t) is converted to a power spectral density function Ga(f) acquired by the accelerometer, The weighted RMS value of acceleration aw is then calculated by the following equation:

Effect of the flexible subframe on ride comfort
The investigation of ride comfort typically involves the analysis of vehicle vibrations on various road surfaces and uneven terrain. Random input simulation for ride comfort assesses the response of a vehicle to random disturbances, such as road irregularities or bumps, in order to evaluate discomfort levels. Additionally, impulse input simulation is used to analyze the vehicle's response to specific excitations and evaluate ride comfort. In this study, the original model is referred to as the multi-body dynamics model with a rigid subframe, while the model with a flexible subframe is named the rigid-flexible coupling model. The focus of this research is on analyzing axial acceleration at the front seat of the vehicle.
This paper conducts a comparative analysis of the ride comfort random input simulation between the original model and the rigid-flexible coupling model under identical conditions, focusing on the impact of subframe flexibility on vehicle ride comfort simulation on random roads. The simulation parameters are set at a vehicle speed of 100 km/h, with the road file adopting the B-grade asphalt road model (based on ISO/TC108/SC2N67 standard).
For the ride comfort of the bump road, the 3D equivalent volumetric road model from the “Vibration response evaluation scale and its calculation” section is selected to simulate the bump road for the impulse input simulation. In the case of high speed, the rigid-flexible coupling model of the whole vehicle through the triangular bump is likely to cause the bump to jump or offset, forming a large error. Therefore, the vehicle model is driven at a constant speed of 30 km/h for comprehensive consideration. Additionally, in order to separately analyze the impact of front and rear subframe flexibility on ride comfort, the acceleration signal was windowed to obtain the Rmslocal curve. The first peak value of this curve represents the front wheel passing through an obstacle, while the second peak value represents the rear wheel doing so. The specific calculation method of the Rmslocal is as follows: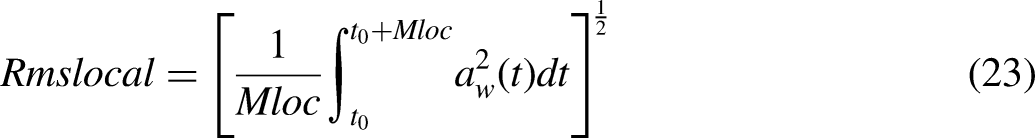
The pulse input simulation results are shown in Figure 7. The results of the acceleration and power spectral density curves in each axial direction at the front seat are shown in Figure 8.

(a) Longitudinal acceleration at the front seat rail, (b) longitudinal rmslocal at the front seat rail, (c) lateral acceleration at the front seat rail, (d) lateral rmslocal at the front seat rail, (e) vertical acceleration at the front seat rail, and (f) vertical rmslocal at the front seat rail.
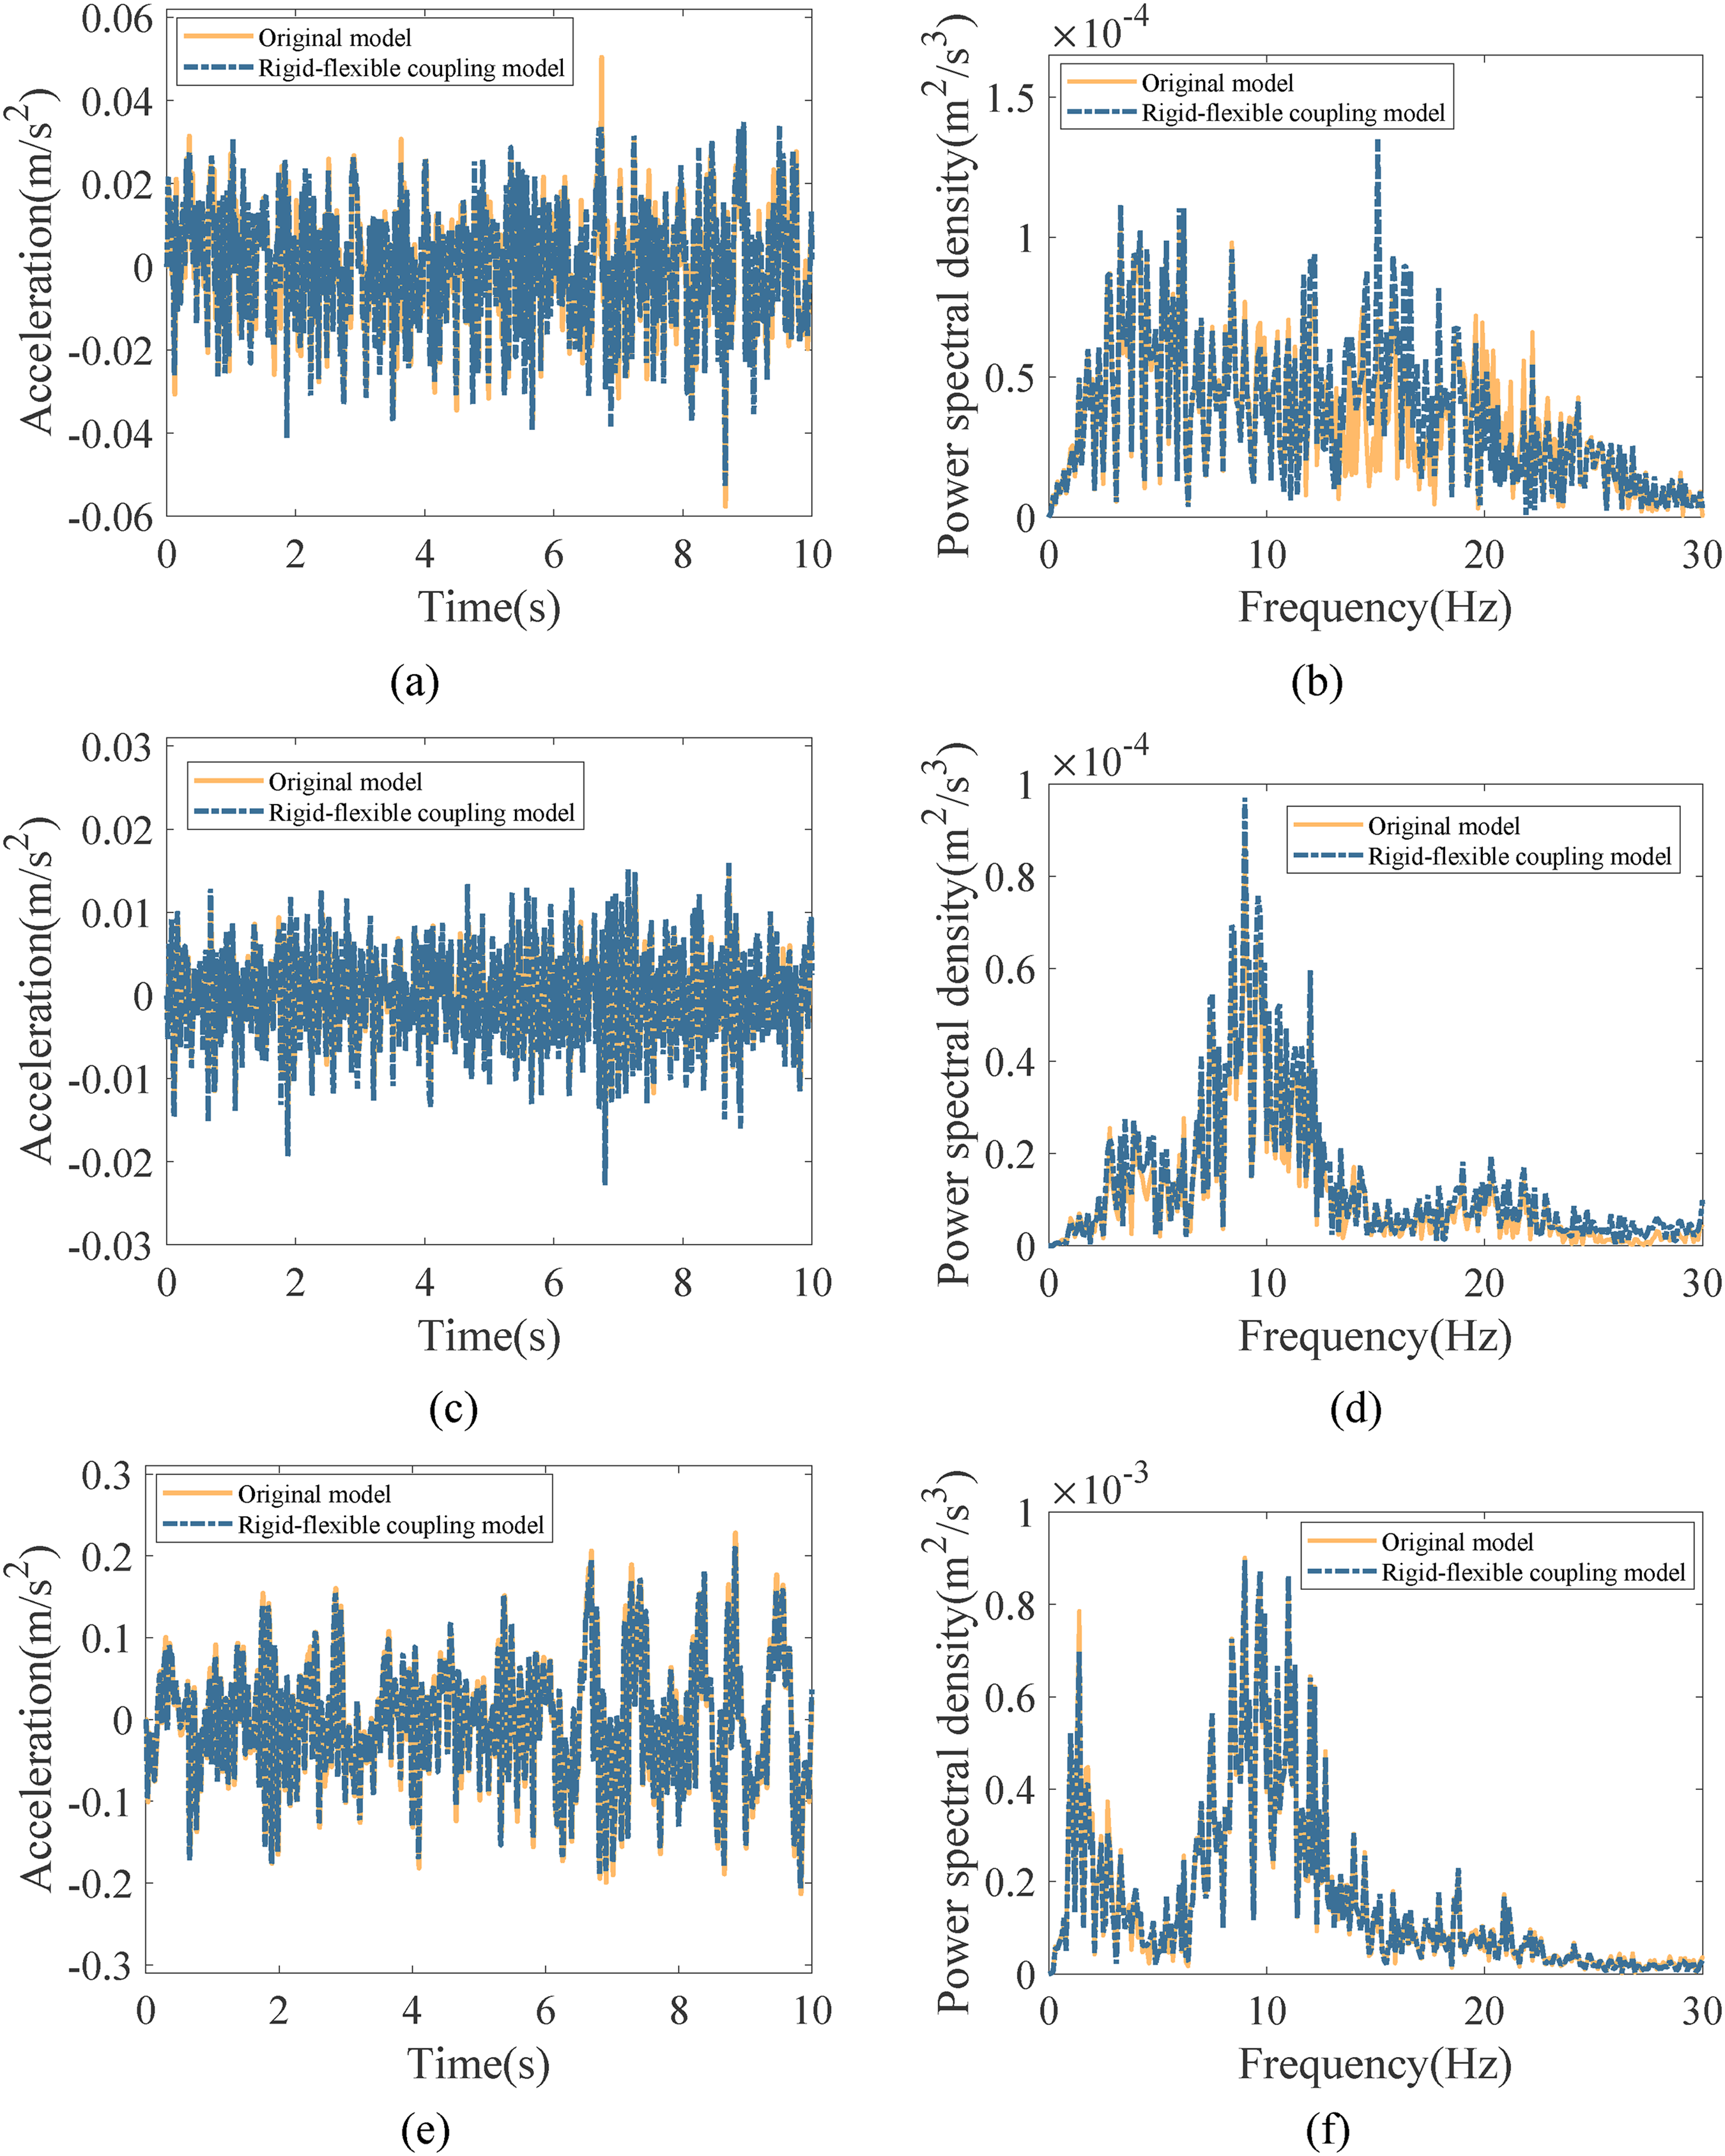
Random road ride comfort simulation results: (a) longitudinal acceleration of the front seat rail, (b) longitudinal power spectral density of the front seat rail, (c) lateral acceleration of the front seat rail, (d) lateral power spectral density of the front seat rail, and (e) vertical acceleration of the front seat rail, and (f) vertical power spectral density of the front seat rail.
Figure 7(a), (c), and (e) shows the time-domain comparison plots of each axial acceleration at the seat for the rigid and rigid-flexible coupled models, respectively. From Figure 7(a), (c), and (e), it can be seen that changing the front subframe and rear subframe from rigid to flexible will result in a decrease in the peak longitudinal and vertical acceleration of the seat and an increase in the peak lateral acceleration.
Figure 7(b), (d), and (f) shows the time-domain comparison plots of the Rmslocal in each axial direction at the seat for the original and rigid-flexible coupling models, respectively. From Figure 7(b), (d), and (f), it can be seen that the flexible subframe does not have the same effect on the Rmslocal in each axial direction at the front seat rail, with the change in the Rmslocal in each axial direction of the seat during the passage of the front wheels being more significant, whereas the Rmslocal in each axial direction of the front seat rail during the passage of the rear wheels is almost unaffected.
According to Figure 8, the flexibility of the subframe has a significant impact on the ride comfort of the rigid-flexible coupling model. Specifically, it results in a decrease in the vertical acceleration of the seat and an increase in both longitudinal and lateral accelerations. This is attributed to the deformation of the flexible subframe under lateral force during simulation, leading to heightened longitudinal and lateral accelerations at the seat. Additionally, the flexible subframe mitigates some downward vertical force, thereby reducing peak values of seat vertical acceleration.
Therefore, the flexible subframe will affect the ride comfort index of the vehicle, thus affecting the ride comfort of the vehicle, which is consistent with the theoretical analysis in the “Analysis of vehicle vibration characteristics” section.
The RMS values of the axial acceleration on the bump road depicted in Figure 7, as well as the Rmslocal value, and the RMS values of the axial acceleration on the random road shown in Figure 8, are presented in Table 4. These values were computed using a MATLAB program. Where each parameter is expressed as front seat rail longitudinal acceleration RMS value f1 = Rmsxbump, front seat rail lateral acceleration RMS value f2 = Rmxybump, front seat rail vertical acceleration RMS value f3 = Rmxzbump, front seat rail longitudinal Rmslocal f4 = Rmslocalx, front seat rail lateral Rmslocal f5 = Rmslocaly, front seat rail vertical Rmslocal f6 = Rmslocalz on the bump road. Front seat rail longitudinal acceleration RMS value f7 = Rmsxrand, front seat rail lateral acceleration RMS value f8 = Rmsyrand, and front seat rail vertical acceleration RMS value f9 = Rmszrand on the random road.
Root mean square (RMS) values and Rmslocal of each axial acceleration at the front seat rail.
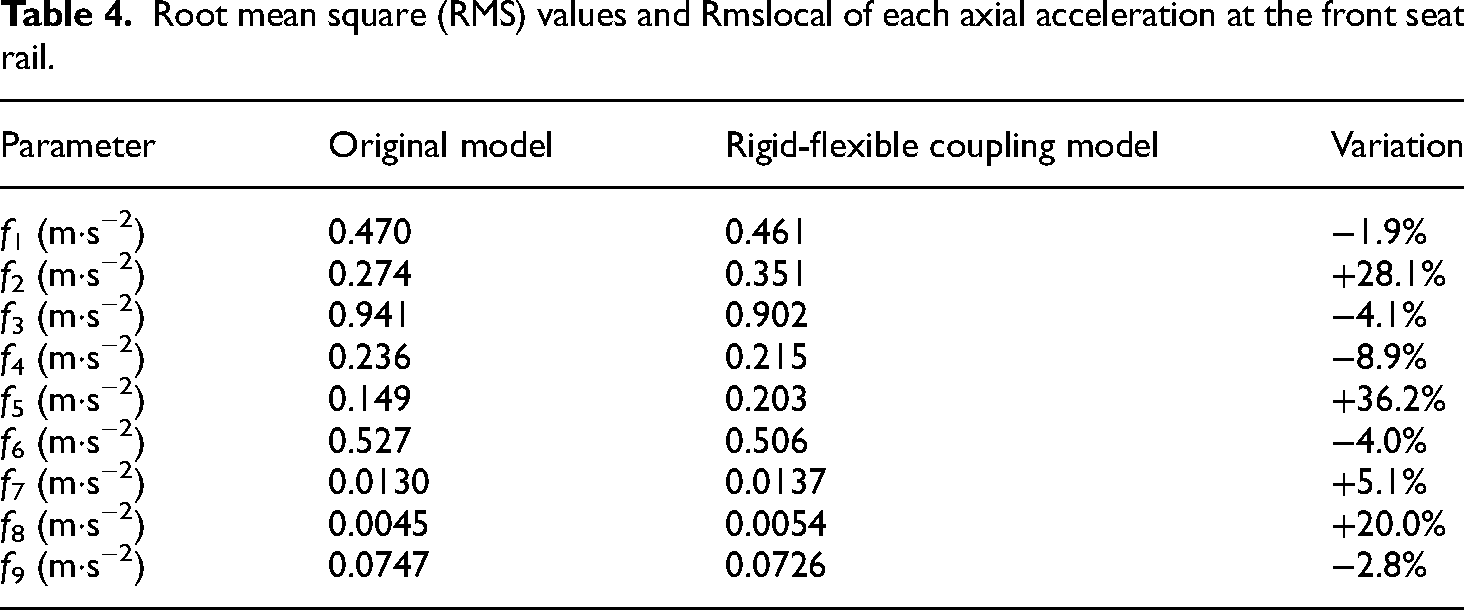
It can be seen from Table 4 that the flexible subframe will result in a decrease of f1, f3, f4, f6, and f9 by 1.9%, 4.1%, 8.9%, 4.0%, and 2.8%, respectively, while f2, f5, f7, and f8 will increase by 28.1%, 36.2%, 5.1%, and 20%, respectively.
Table 4 demonstrates that the ride comfort index of the rigid-flexible coupling model exhibits significant variations on convex block and random road surfaces compared to the original model, indicating a substantial impact of the flexible subframe on vehicle ride comfort. Previous research on vehicle ride comfort frequently modeled vehicle components, including the subframe, as rigid bodies excluding elastic elements. However, neglecting the influence of elastic deformation in the subframe during actual driving cannot be overlooked. Therefore, it is necessary to flexibilize the vehicle subframe and establish a rigid-flexible coupling model when conducting dynamic simulation of vehicles.
Multi-objective design optimization method
Sensitivity analysis of subframe bushing
It is evident from the above discussion that the flexibility of the subframe will impact the load on the bushings, thereby influencing the ride comfort of the vehicle. Consequently, the stiffness of the subframe bushings has been chosen as a design variable for multi-objective optimization. The front subframe is connected to the body through bushings C and D, and to the lower control arm through bushings A and B. The rear subframe is connected to the body through bushings E and F, while bushings G and I are linked to the upper and lower swingarms of the multi-link suspension, with bushing H connected to the front beam adjuster bar. There are a total of eight bushings on both sides of the front subframe, while there are ten on both sides of the rear subframe. Left and right positions are denoted by L and R, respectively. Each individual bushing possesses three translational stiffnesses in the x, y, and z directions along with rotational stiffness. Taking bushing A as an example, the three translational stiffnesses are denoted as kx A, ky A, and kz A, respectively, and the three torsional stiffnesses are denoted as kTx A, kTy A, and kTz A.
The flexible subframe will lead to changes in the ride comfort of the whole vehicle. In the rigid-flexible coupling vehicle model, the front subframe is subjected to forces and moments from eight bushings on the left and right, while the rear subframe is subjected to forces and moments from ten bushings on the left and right, and there are 108 stiffness values, which do not have the same degree of influence on the ride comfort. To streamline the complexity associated with optimizing the design variables, a sensitivity analysis of the bushing stiffnesses was conducted as a preliminary step before delving into the optimization analysis.
Sensitivity analyses of independent parameters were conducted using the design of experiment (DOE) method of Parameter Study in ISIGHT software. Because the left and right bushings of the subframe are symmetrical, the sensitivity analysis was performed with 54 stiffness values of the right bushings AR, BR, CR, DR, ER, FR, GR, HR, and IR of the subframe. The objective was to identify the bushing stiffness that exerts a greater influence on vehicle ride comfort and to streamline the calculation process for optimization analysis. Due to the space restriction of the article, only some of the results of the sensitivity analyses are shown in Figure 9.
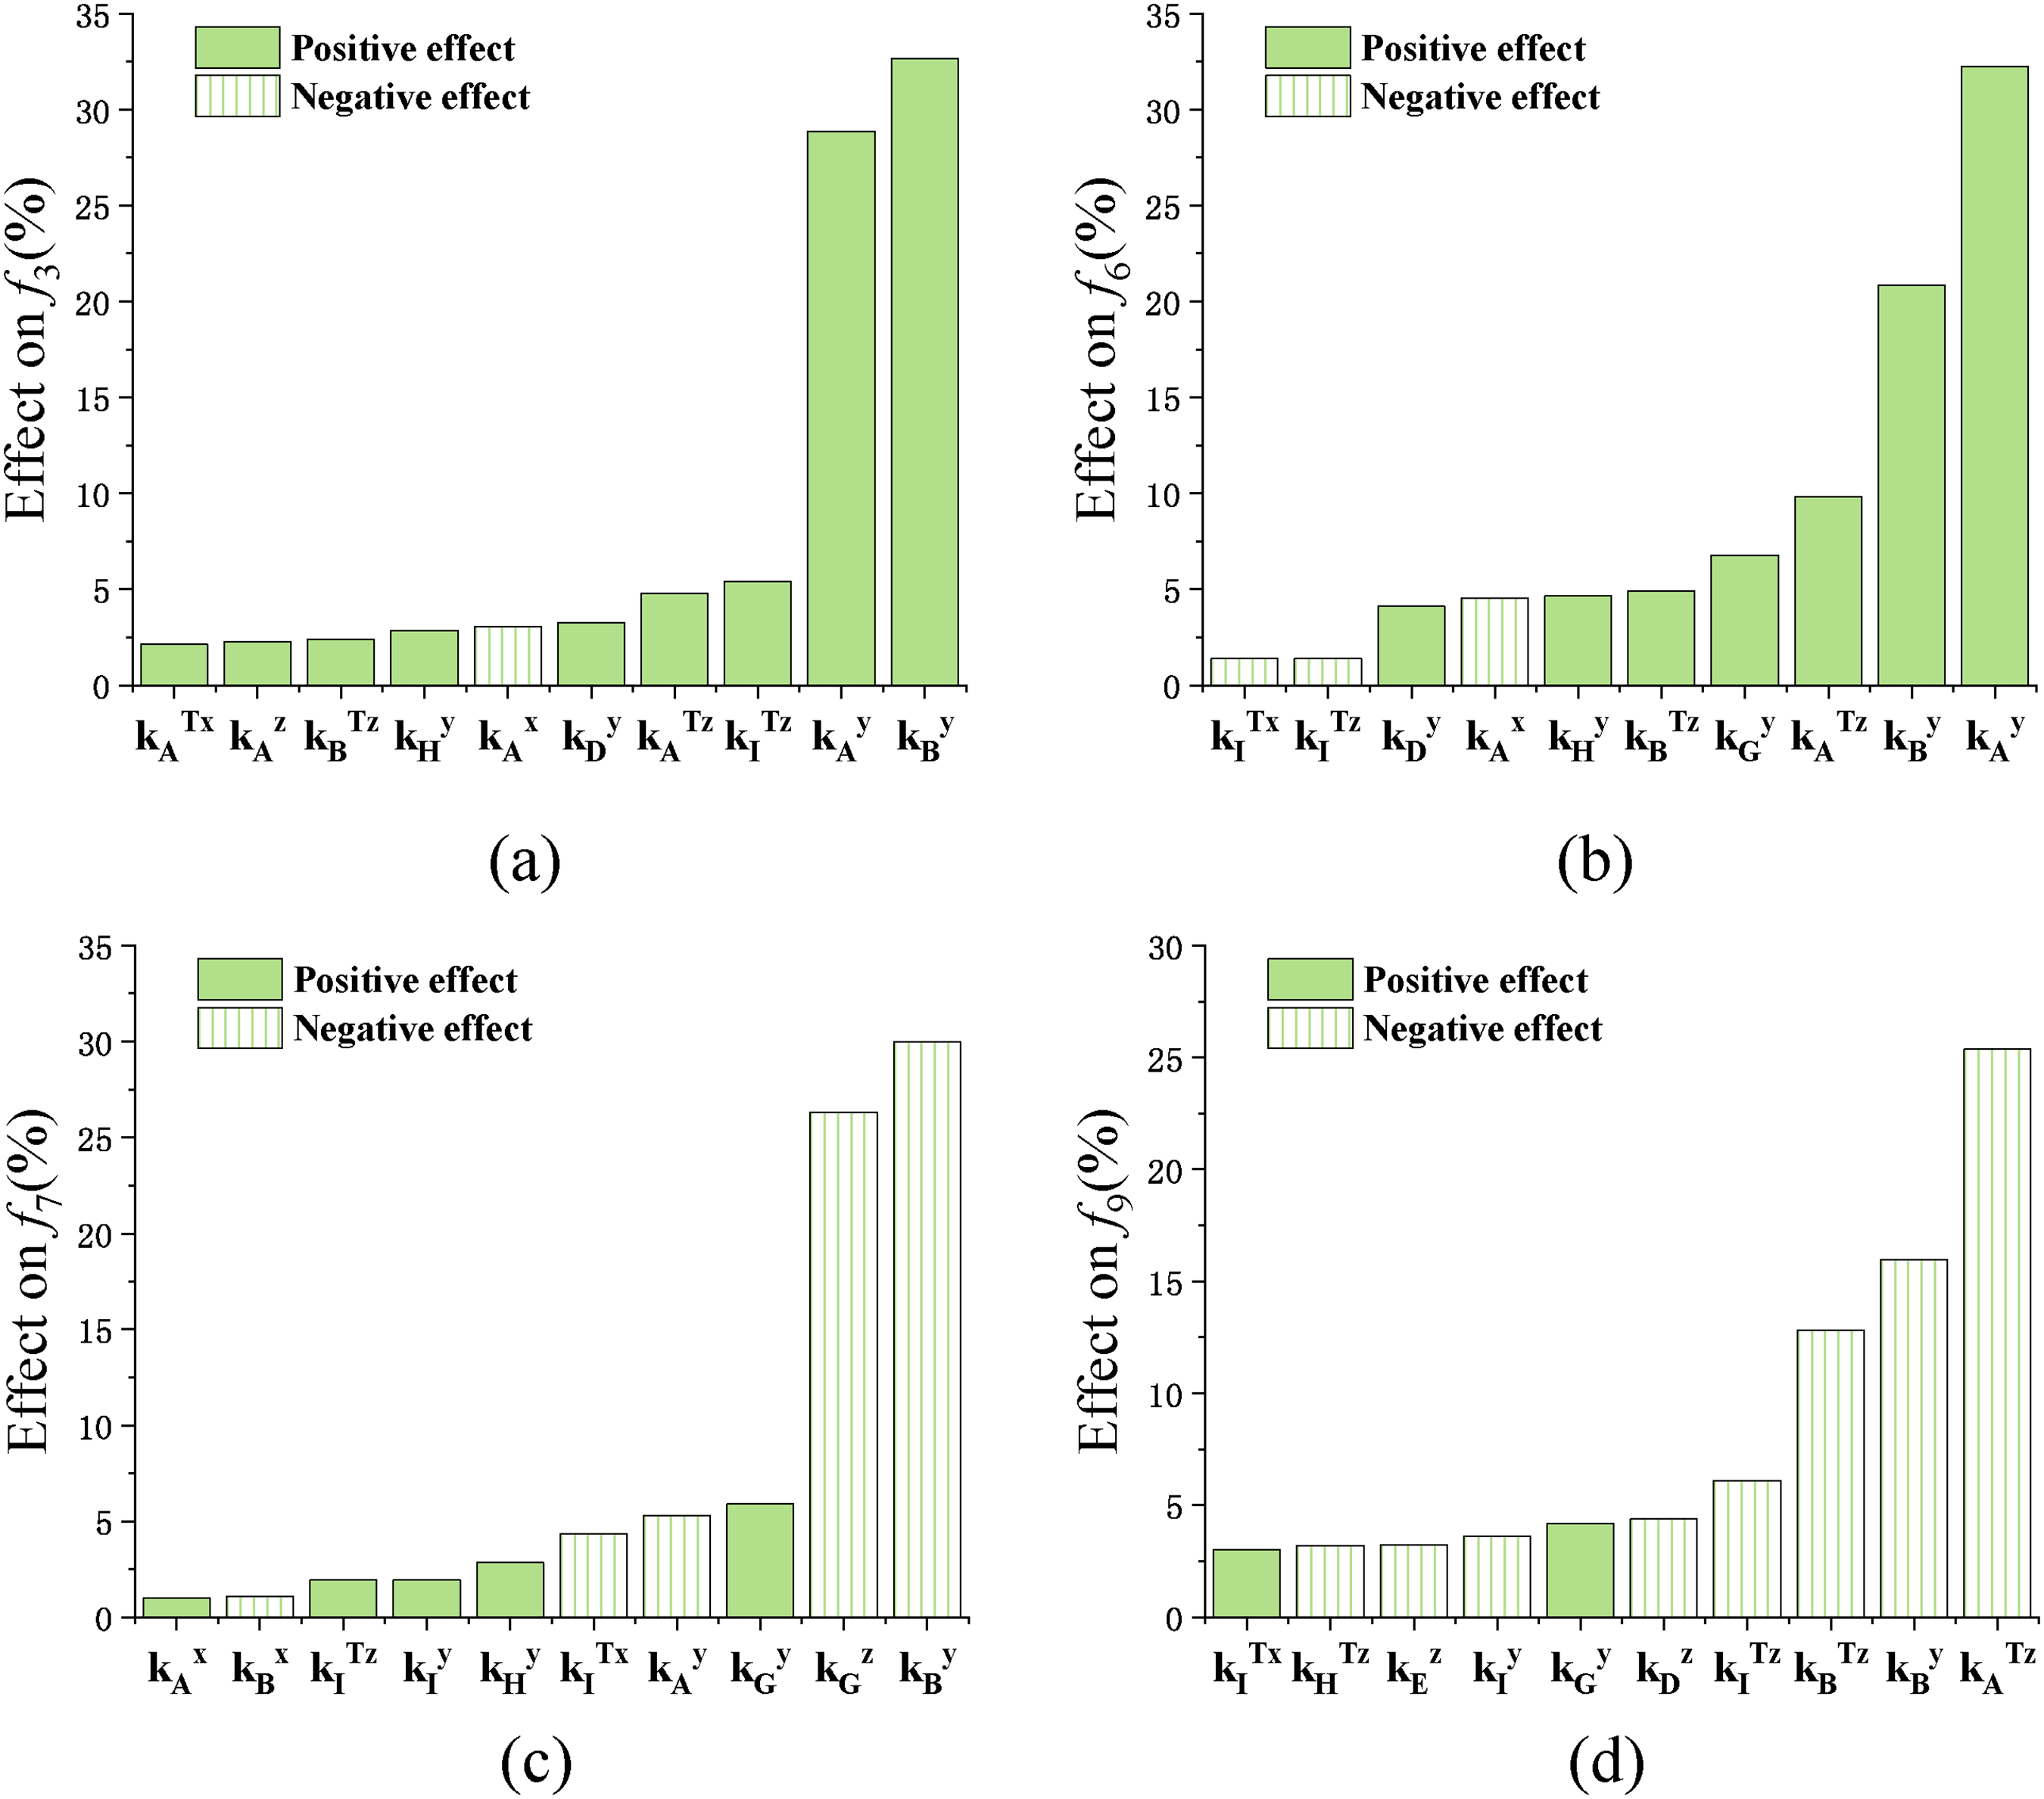
(a) The influence of bushing stiffness on f3, (b) the influence of bushing stiffness on f6, (c) the influence of bushing stiffness on f7, and (d) the influence of bushing stiffness on f9.
From Figure 9, it can be seen that the translational stiffnesses ky A and ky B of bushings A and B have a large influence on the vehicle front seat rail acceleration in each axial direction, and the evaluation index Rmslocal is positively correlated with stiffnesses ky A and ky B. The RMS value of front seat rail acceleration on random roads is negatively correlated with ky A and ky B. Taking into account the results of the sensitivity analyses, the bushing stiffness ky A, ky B, kz A, kz G, kTx A, and kTz I are selected as the design variables for the multi-objective optimization of ride comfort on bump road. The bushing stiffness ky A, kTz A, ky B, kTz B, ky G, and kTz I are selected as the design variables for the multi-objective optimization of ride comfort on random roads.
Radial basis function neural network approximation model
In order to enhance optimization efficiency, the original samples are acquired through ADAMS software dynamics simulation. Subsequently, a joint simulation model of ADAMS and MATLAB thus is established in ISIGHT, which is then sampled using the optimal Latin Hypercube design method. Following this, a radial basis function (RBF) neural network approximation model is developed for conducting the optimal design of ride comfort.
Then, the accuracy of the RBF model is analyzed for error. The commonly used evaluation indexes are RMS error (RMSE) and correlation coefficient (R2). R2 is the metric used to evaluate how well the approximate model fits the sample points. the closer R2 is to 1, the smaller the error. Both can be expressed as follows: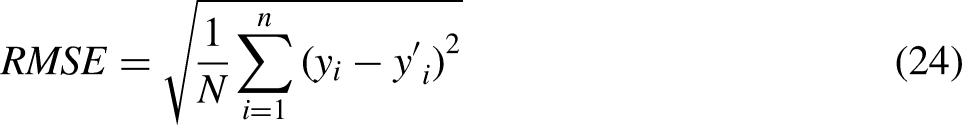

The accuracy metrics of the constructed RBF approximation model are shown in Table 5, and due to the length limitation of the article, only part of the fitting effect graph of the RBF approximation model is shown in Figure 10.
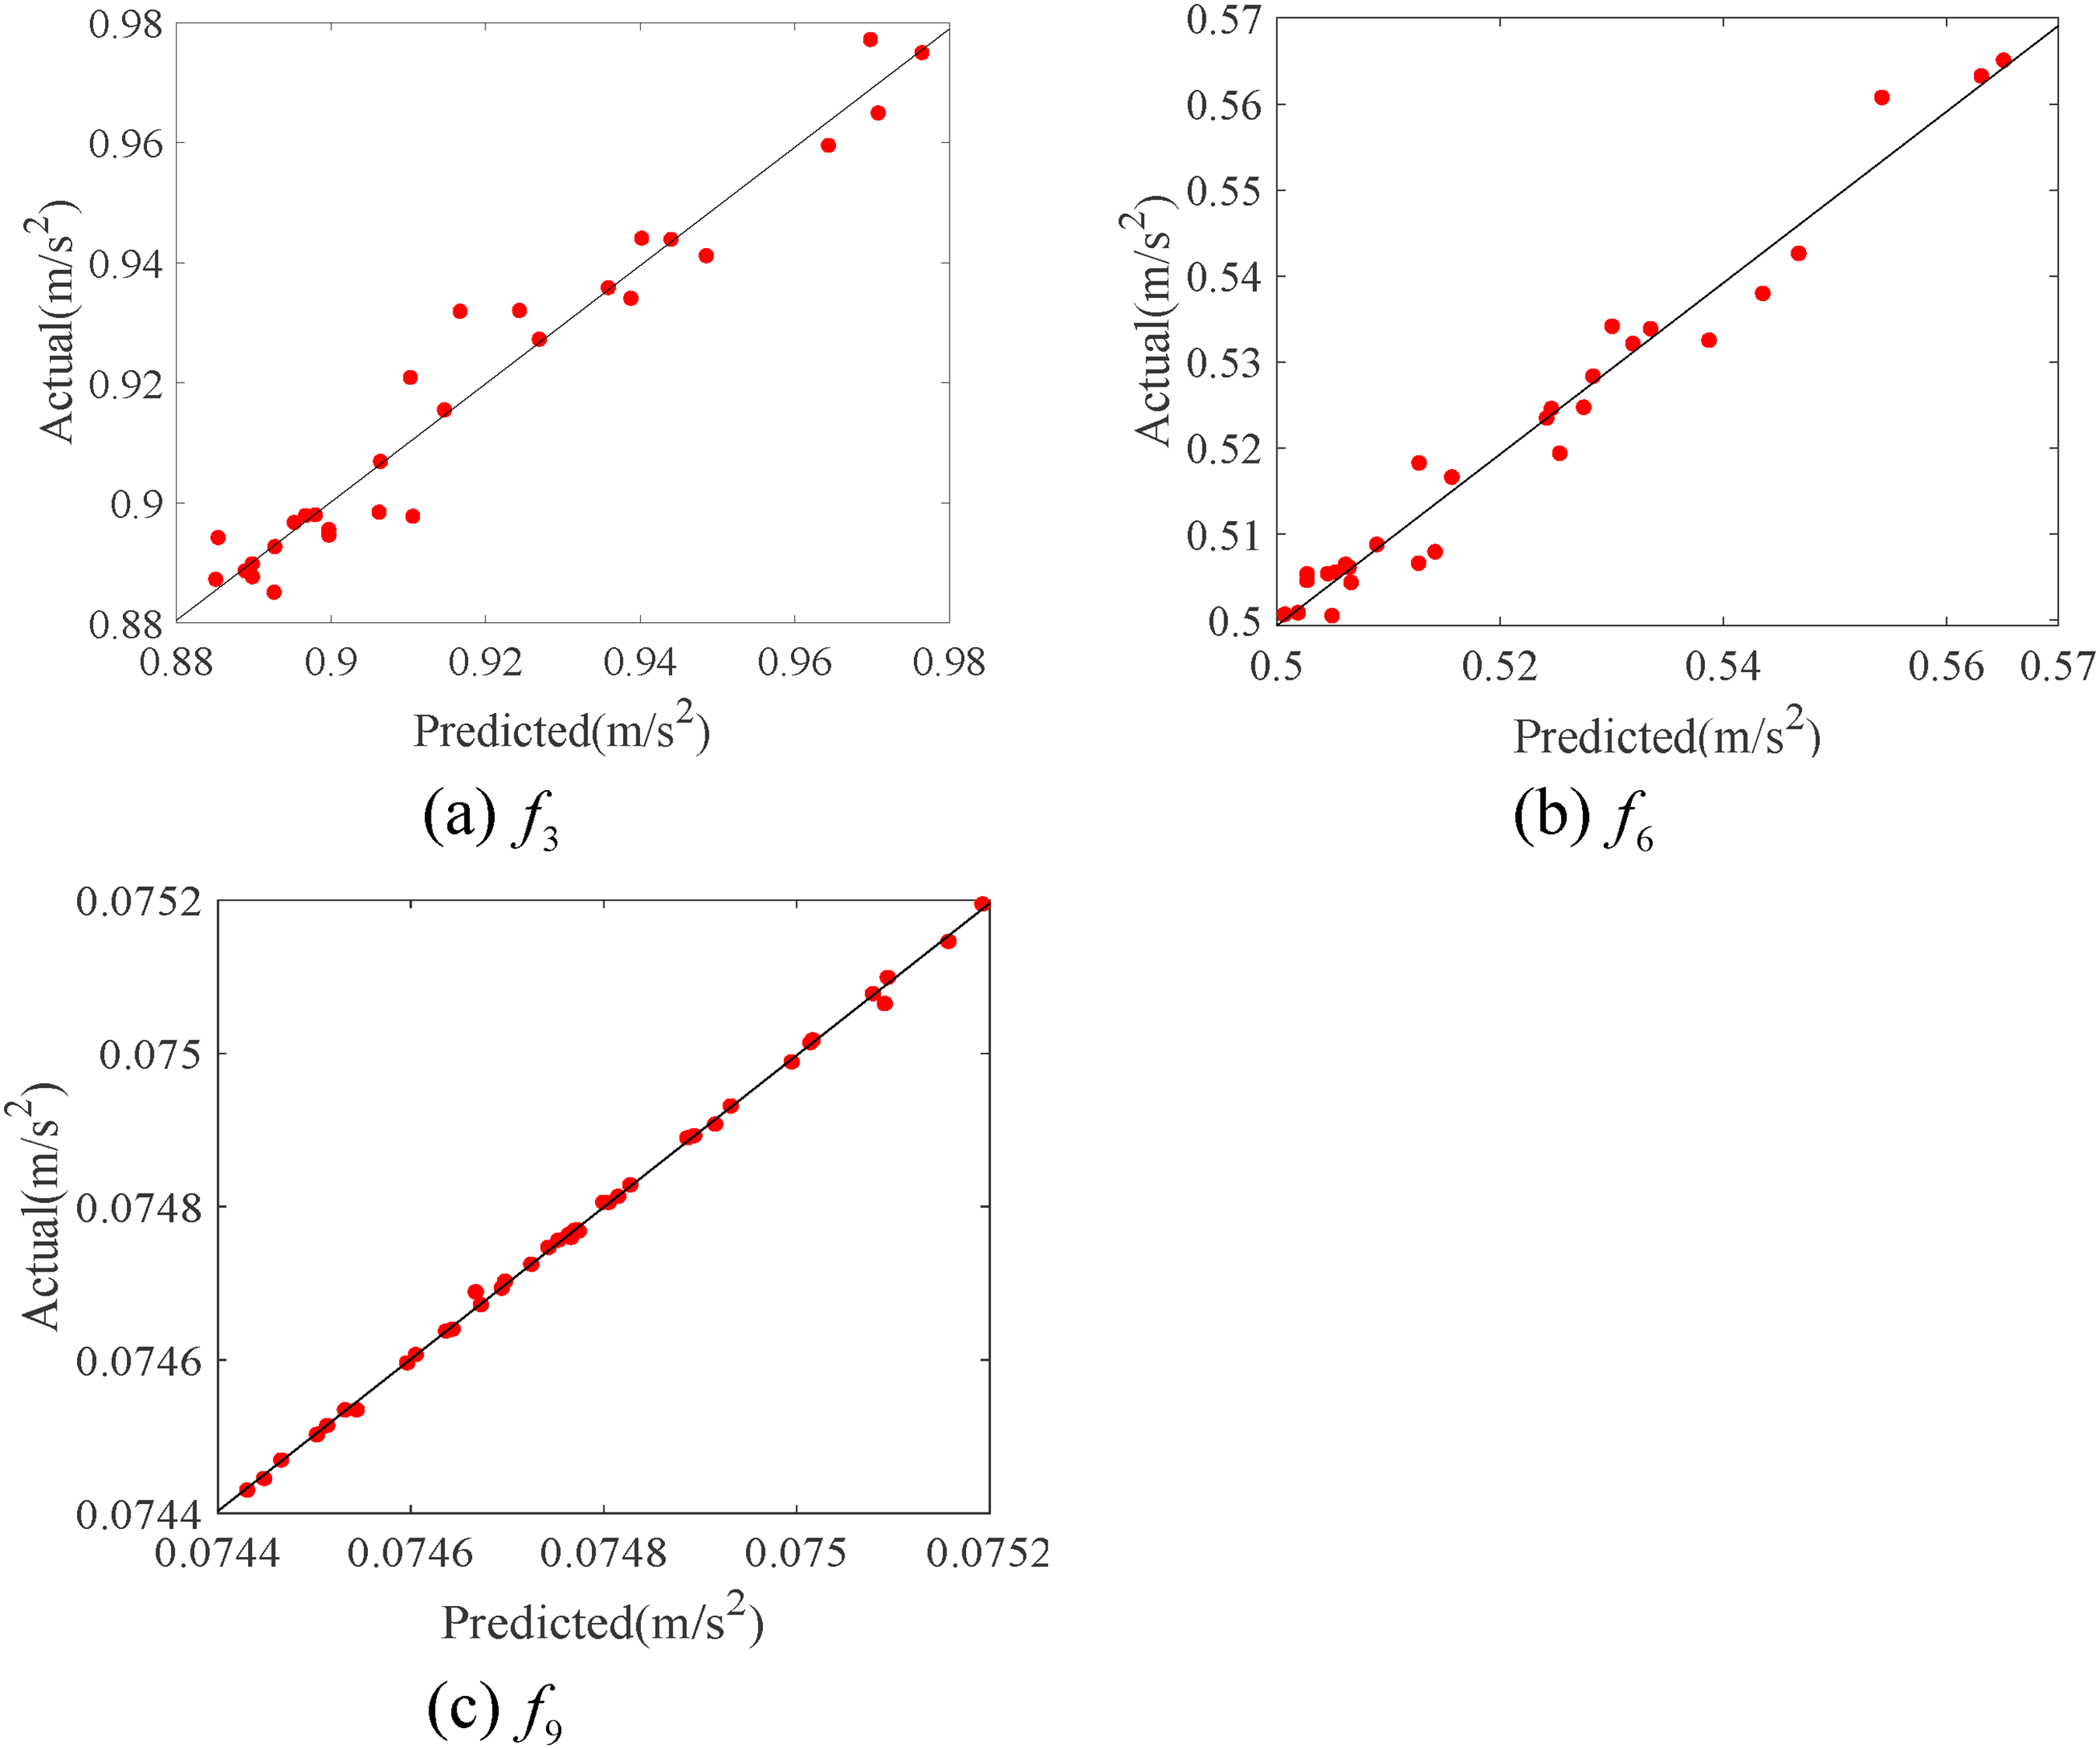
Radial basis function (RBF) approximation model error analysis diagram.
RBF approximation model fitting accuracy results.
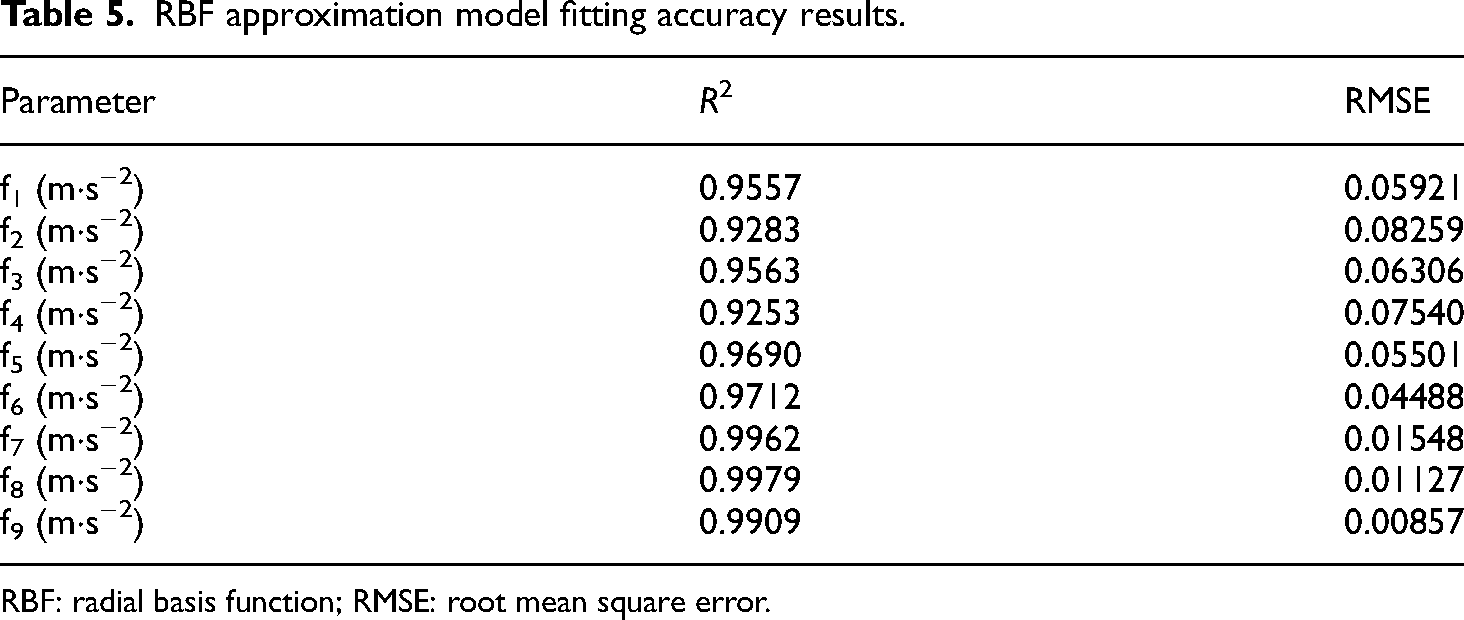
RBF: radial basis function; RMSE: root mean square error.
The results show that the accuracy indexes of the RBF approximation model are all within the error range, and the optimized design of the bushing stiffness parameters can be carried out based on the RBF approximation model.
Optimization algorithm
The NSGA-II algorithm is a well-established multi-objective optimization algorithm designed to address optimization problems with multiple conflicting objectives. 21 This evolutionary algorithm is rooted in the foundational principles of genetic algorithms and has been further refined with specialized techniques such as non-dominated sorting and crowding distance calculations.
NSGA-II is particularly distinguished by its ability to effectively maintain population diversity, a crucial aspect in multi-objective optimization. It accomplishes this by employing non-dominated sorting and congestion distance metrics. These techniques allow NSGA-II to generate a set of solutions that are close to being optimal, spread across the non-dominated frontier. This diverse set of solutions provides decision-makers with a range of trade-off options among different objectives.
Over the years, NSGA-II has found extensive applications in various fields, most notably in engineering design. Its adaptability and capability to handle multiple conflicting objectives have made it a tool for tackling complex optimization challenges. The following are the basic steps of the NSGA-II algorithm:
- Step 1: Initialize population: an initial population is randomly generated and each individual contains a set of values for the decision variables. - Step 2: Evaluate fitness: for each individual, the fitness is evaluated by calculating the value of the objective function. - Step 3: Non-dominated sorting: based on the fitness of the individuals and the value of the objective function, the individuals in the population are sorted nondominated. - Step 4: Calculate the crowding distance: To maintain the diversity of the population, the crowding distance of individuals needs to be calculated. - Step 5: Selection operation: Based on the non-dominated ordering and crowding distance, select the parent individuals that will generate the next generation of the population. Methods such as tournament selection or roulette selection are commonly used. - Step 6: Genetic operation: Generate offspring individuals by crossover and mutation operations. Crossover operations simulate the recombination of genes by exchanging certain parts of two-parent individuals. The mutation operation introduces randomness and generates diversity by modifying certain genes in individuals. - Step 7: Generate a new population: parent and offspring individuals are merged to form a new generation of population. - Step 8: Repeat Iteration: Repeat steps 2 to 7 until a predefined stopping condition is reached, such as reaching the maximum number of iterations or finding an optimized solution that satisfies the requirement.
The main steps of the NSGA-II algorithm are shown in Figure 11.

Steps of non-dominated sorting genetic algorithm II (NSGA-II) algorithm.
The particle swarm optimization (PSO) algorithm uses a swarm of particles to search after the optimal particles in the solution space without the crossover and mutation operations of genetic algorithms. Therefore, compared with genetic algorithms, PSO has the advantage of being simple and easy to implement, and there are not too many parameters to be adjusted. The main steps of the PSO algorithm are as follows:
- Step 1: Initialize the particle swarm size m, initial position, and initial velocity and set the adaptive value. - Step 2: Evaluate the adaptability of each particle, find the current individual optimal solution of each particle, find the current individual optimal solution of the whole particle swarm, and finally find the current global optimal solution of the whole particle swarm. - Step 3: Update the position and velocity of each particle according to the position and velocity formulas in equation (26). - Step 4: If the end condition is not reached (usually a good enough fitness value or reaching a preset maximum number of generations), go back to step 2 until the optimal solution is output.
The MOPSO algorithm preserves the non-inferior solutions obtained in each generation and updates them as the evolution progresses, effectively addressing the issue of local optima commonly encountered in PSO algorithms.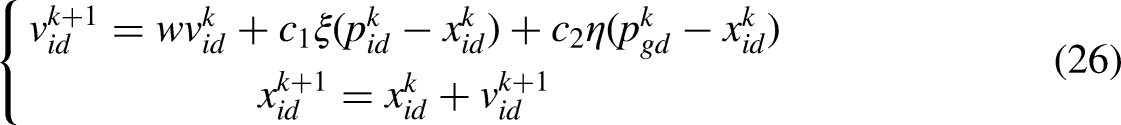
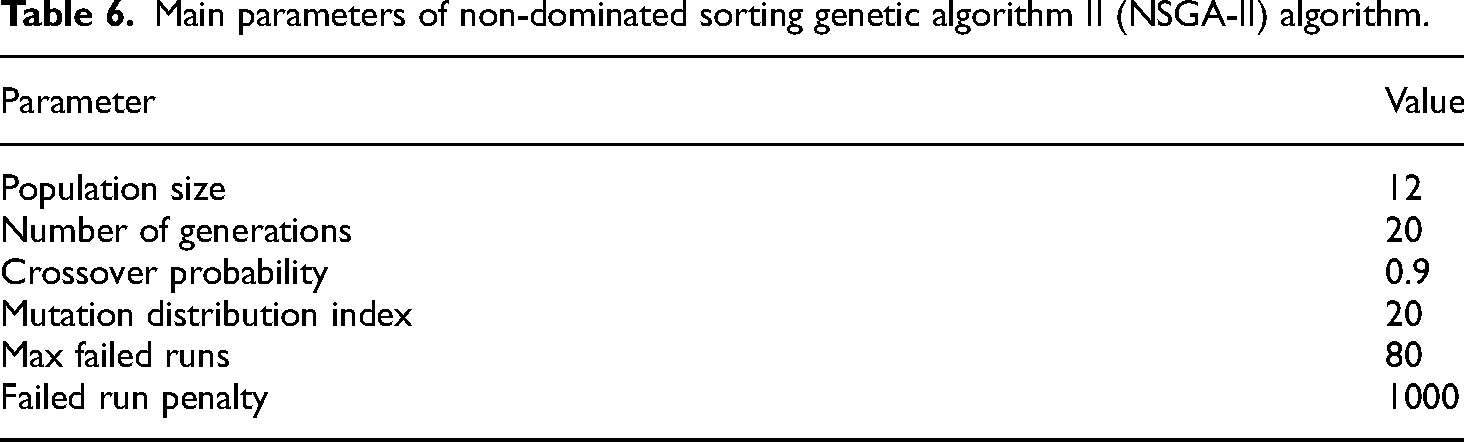
In this article, the NSGA-II and MOPSO algorithms are chosen to solve the multi-objective problem, and their flow charts are shown in Figure 12, and the main parameters are shown in Tables 6 and 7, respectively.

NSGA-II and MOPSO algorithm flow chart: (a) NSGA-II algorithm and (b) MOPSO algorithm.
Main parameters of non-dominated sorting genetic algorithm II (NSGA-II) algorithm.
Main parameters of multi-objective particle swarm optimization (MOPSO) algorithm.

Objective function
To enhance the ride comfort, the NSGA-II and MOPSO algorithms are employed for optimizing the bushing stiffness of the subframe and the joint between the body and suspension.
For bump road, the parameters minimized include the RMS value of each axial acceleration at the front seat rail f1 = Rmsxbump, f2 = Rmxybump, and f3 = Rmxzbump, and the Rmslocal of each axial acceleration at the front seat rail f4 = Rmslocalx, f5 = Rmslocaly, and f6 = Rmslocalz.
For random roads, the parameters minimized include the RMS value of each axial acceleration at the front seat rail f7 = Rmsxrand, f8 = Rmsyrand, and f9 = Rmszrand.
Combined with the optimized design variables selected in the “Sensitivity analysis of subframe bushing” section, the multi-objective optimization problem for the bushing stiffness at the subframe and body and suspension joints can be expressed as follows for different road surfaces, respectively,

Optimization results and validation
Due to the space limitation of the article, the optimized part of the Pareto front after the two optimization algorithms is shown in Figure 13. The comparison results of the bushing stiffness parameters for the subframe, suspension, and body joints selected after sensitivity analysis in the “Sensitivity analysis of subframe bushing” section before and after optimization are presented in Table 8. The values of the bushing stiffness parameters are derived from real vehicle measurements. Given the nonlinearity of the bushing, the value of the bushing stiffness parameters in the optimization design is determined as a scale factor.
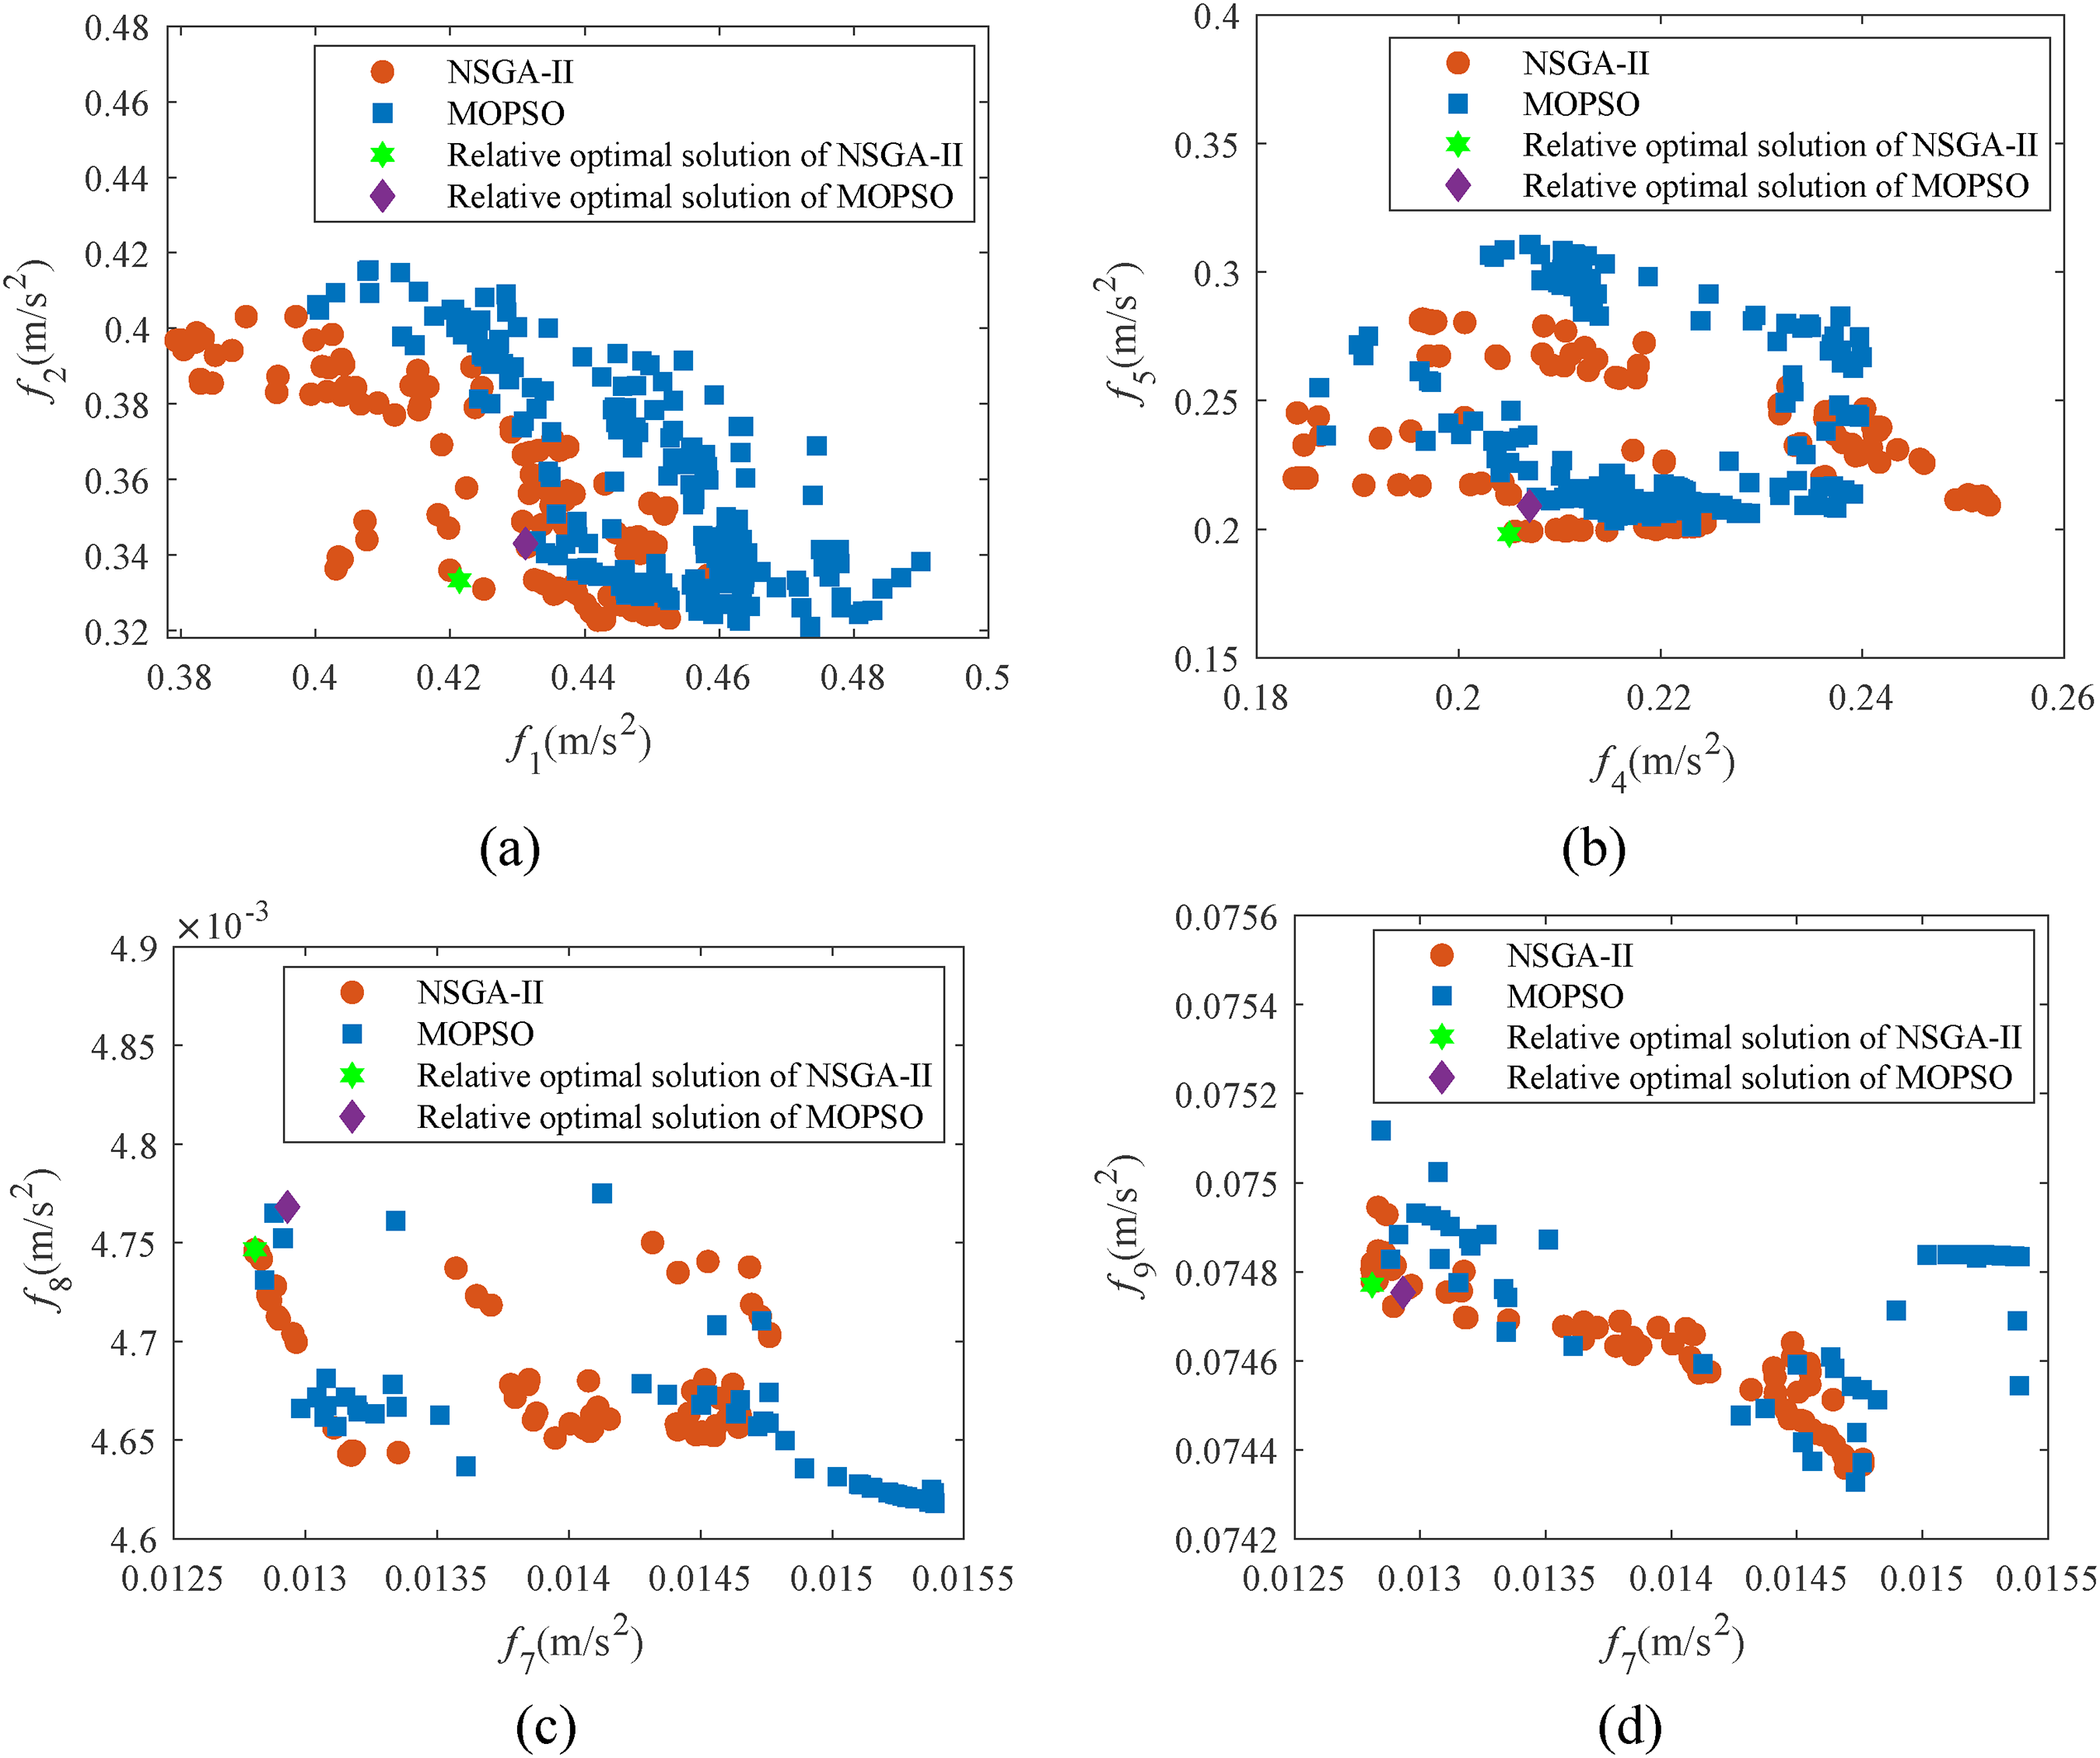
Pareto front: (a) f2 and f1, (b) f5 and f4, (c) f8 and f7, and (d) f9 and f7.
Change in bushing stiffness before and after optimization.
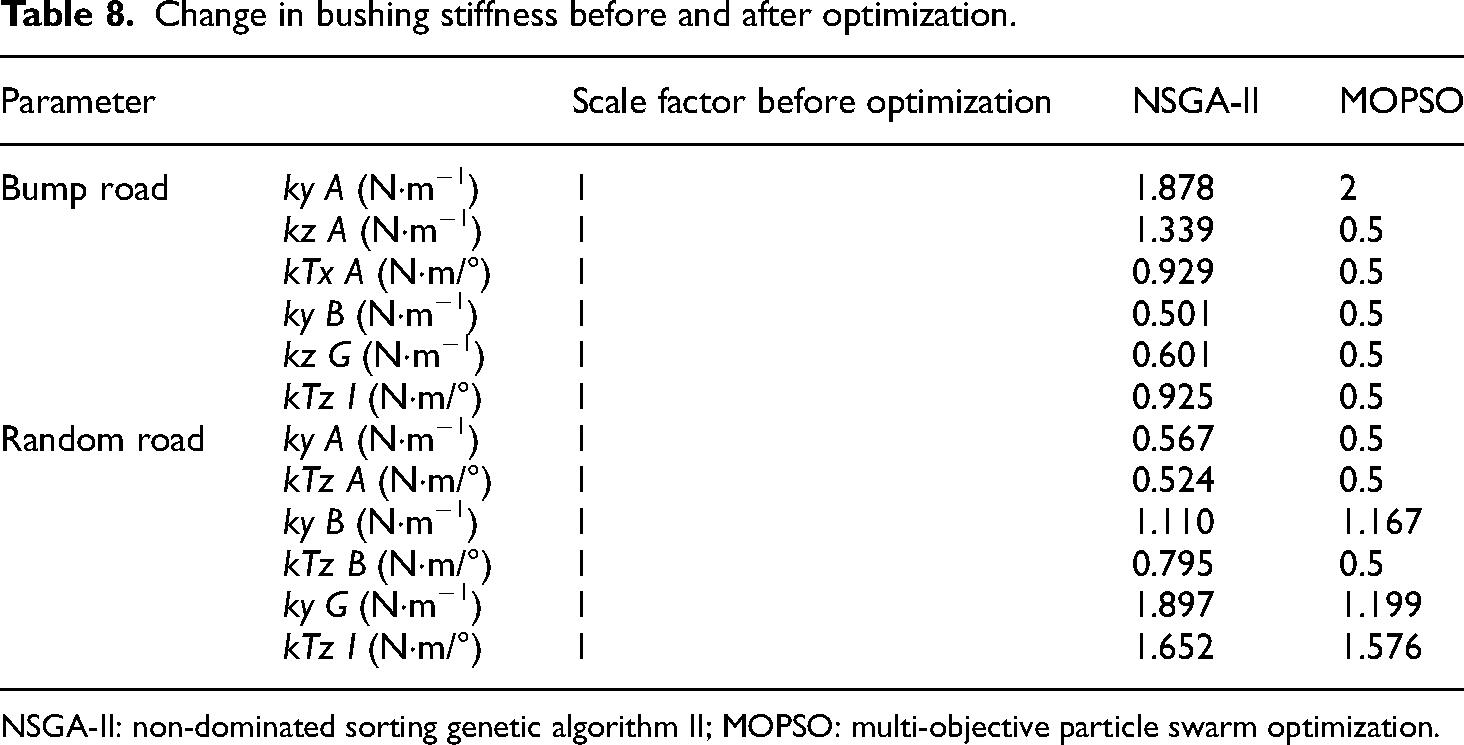
NSGA-II: non-dominated sorting genetic algorithm II; MOPSO: multi-objective particle swarm optimization.
The optimized bushing stiffness is changed in the same proportion according to the value of the scaling factor, and the optimization results are verified by ADAMS dynamics simulation, and the results of the rigid-flexible coupling model before and after the optimization are shown in Figures 14 and 15. The peak acceleration value of the front seat of the rigid-flexible coupling model of the vehicle changes significantly before and after optimization.

Comparison results of pulse input simulation optimization: (a) longitudinal acceleration at the front seat rail, (b) longitudinal rmslocal at the front seat rail, (c) lateral acceleration at the front seat rail, (d) lateral rmslocal at the front seat rail, (e) vertical acceleration at the front seat rail, and (f) vertical rmslocal at the front seat rail.

Comparison results of random input simulation optimization: (a) longitudinal acceleration at the front seat rail, (b) longitudinal acceleration power spectral density at the front seat rail, (c) lateral acceleration at the front seat rail, (d) lateral power spectral density at the front seat rail, (e) vertical acceleration at the front seat rail, and (f) vertical power spectral density at the front seat rail.
Table 9 shows the specific indexes of the rigid-flexible coupling model before and after multi-objective optimization. The optimized results of the NSGA-II algorithm are better than MOPSO on bump roads, and the optimized results of the two algorithms are not obvious on random roads.
Comparison of optimization results.

NSGA-II: non-dominated sorting genetic algorithm II; MOPSO: multi-objective particle swarm optimization.
Figure 14(a) to (f) shows the results of simulation validation by bringing the optimized bushing stiffness into the original vehicle dynamics model with proportional changes in the values of the scaling factors on the bump road. The results show that each evaluation index of the bump road is reduced after optimization by the NSGA-II algorithm compared to the original vehicle, and it can be seen in conjunction with Table 9 that the RMS values of each axial acceleration at the front seat rail, f1, f2, and f3, have been reduced by 8.7%, 5.1%, and 3.3%, respectively, and the each axial Rmslocal f4, f5, and f6 at the front seat rail, have been reduced by 4.7%, 2.5%, and 2.4%, respectively. The MOPSO algorithm optimized f1, f2, and f3 decreased by 6.5%, 2.3%, and 1.1%, f4 and f6 decreased by 3.7% and 0.8%, respectively, and f5 increased by 3.0%, but it was still within reasonable limits. The vehicle ride comfort on the bump road was improved by both algorithms optimized. NSGA-II algorithm yields better evaluation metrics.
Figure 15(a) to (f) shows the results of simulation validation on a random road by bringing the optimized bushing stiffness into the original vehicle dynamics model by varying the values of the scaling factor in the same proportion. The peak acceleration in each axial direction at the front seat rail and the peak acceleration power spectral density at the front seat rail of the vehicle optimized by NSGA-II and MOPSO algorithms are reduced. Combined with Table 9, it can be seen that the RMS f7, f8, and f9 of each axial acceleration of the vehicle optimized by the NAGA-II algorithm are reduced by 5.1%, 1.9%, and 2.2%, respectively, compared with the original vehicle. The RMS f7, f8, and f9 of each axial acceleration of the vehicle optimized by the MOPSO algorithm are reduced by 5.8%, 1.9%, and 2.3%, respectively, compared with the original vehicle. The difference between the evaluation indicators obtained by the two optimization algorithms is not significant.
Conclusion
In this study, the impact of a flexible subframe on vehicle ride comfort is investigated through the establishment of a seven-degree-of-freedom vehicle dynamics equation and model. Using the RBF approximate model, a multi-objective optimization design for subframe bushing stiffness is conducted using NSGA-II and MOPSO algorithms to enhance vehicle ride comfort. The main conclusions are as follows:
The elastic deformation induced by the flexible subframe will impact the bushing force, thereby influencing the dynamic equation of the 7-DOF vehicle model, altering the vehicle's vibration characteristics, and subsequently impacting its ride comfort. The axial acceleration of the front seat rail of the vehicle on bump and random roads is mainly affected by the translational stiffnesses ky A and ky B of the bushings A and B at the hinge of the front subframe with the front suspension. The evaluation index Rmslocal is positively correlated with ky A and ky B, while the RMS value of the acceleration of the front seat on class B roads is negatively correlated with ky A and ky B. On bump roads, the flexibility of the subframe does not have the same effect on the vehicle ride comfort, with the Rmslocal in each axial direction at the front seat varying more dramatically for front-wheel passes than for rear-wheel passes. The ride comfort evaluation indices for bump roads obtained by NSGA-II outperform those obtained by MOPSO. While the ride comfort evaluation indices for random roads obtained by MOPSO are marginally better than those obtained by NSGA-II, the difference is not significant. Therefore, the NSGA-II algorithm is deemed more suitable for optimizing the problem addressed in this article.
Footnotes
Author contribution
JG and MD: conceptualization; JG and MD: methodology; JG and MD: software; JG and MD: validation; JG and MD: formal analysis; JG and MD: investigation; JG and MD: resources; MD: data curation; JG and MD: writing–original draft preparation; JG: writing–review and editing; JG and MD: visualization; JG: supervision; JG: project administration; JG: funding acquisition. All authors have read and agreed to the published version of the manuscript.
Declaration of conflicting interests
The author(s) declared no potential conflicts of interest with respect to the research, authorship, and/or publication of this article.
Funding
The author(s) disclosed receipt of the following financial support for the research, authorship, and/or publication of this article: This work was supported by the National Natural Science Foundation of China (grant number 51965026).
Author biographies
Jin Gao is currently an associate professor in the Faculty of Transportation Engineering, at Kunming University of Science and Technology, China. His research interests focus on vehicle system dynamics, analysis, and optimization of suspension systems.
Mingyang Du is a master's student at the Faculty of Transportation Engineering, Kunming University of Science and Technology, China. His research interests are vehicle dynamics and simulation.