
Abstract
The bearing and deformation characteristics of monopile foundation under the monotonic and cyclic loads are key factors to consider in the design of the transmission tower structure or offshore wind energy converters. The model tests and numerical simulations of monopile foundation under monotonic and cyclic horizontal loads were performed in sand to explore the bearing characteristics and the deformation characteristics of pile. The potentially affected factors including loading height, relative density of soil, displacement amplitude were analyzed. The results show that with the loading height varies from 1D to 4D, the horizontal static bearing capacity of the pile under different the soil relative density decreased by 1.63–1.9 times, and the peak bending moment increased by 22.9%–36.8%. Under the cyclic loads, the peak load on the pile top increased by 31.7%–56.1% for each 1 mm increase in displacement amplitude. The stiffness of soil around pile varies as the number of cycles increases with the development trend of decreases first and then increases gradually. As the horizontal load and cycle number increase, the range of the displacement of soil extends towards the bottom of pile, until it covers the entire lower part of the model.
Keywords
Introduction
Monopile foundations are most frequently used for transmission tower structures or offshore wind energy converters. Safety and stability of these towers are very important for ensuring the safe operation of electric power network. However, these structures are often subjected to horizontal loads such as wind and waves. The foundation of monopile will produce large horizontal cumulative deformation under the long-term action of horizontal loads. 1 In addition, these structures are most highly flexible and dynamic sensitive structure. In the design of the monopile foundation, the bearing capacity and deformation behavior of pile under horizontal loads, especially long-term load, should be principally considered, which aims to avoid collapse of the structures. 2
Extensive experimental and numerical simulations have carried out to investigate the lateral behavior of monopile under monotonic and cyclic horizontal loads.3–25 The effects of the pile-soil relative stiffness,6–9 pile diameter D,15,16 soil relative density,18–20 loading rate, 17 loading frequency, 5 loading amplitude, 21 loading direction (e.g. unidirectional or bidirectional),22–24 the number of cycles, 6 existing vertical load, 25 and inclination angle3,4 on the lateral behavior of pile were mainly focused. The pile-soil relative stiffness was considered to govern the mechanisms of pile–soil interaction, and the criteria was proposed to distinguish between flexible and rigid piles.6–9 The pile-soil stiffness of large diameter monopiles was usually overestimated, which may result in an insufficient pile length design.15,16 There were differences of opinion regarding the effect of soil relative density on the lateral behaviors of monopile. Achmus et al. 20 reported that secant stiffness of medium dense and dense sands degraded with the increasing cycle number of load. On the contrary, other model studies suggested that the foundation stiffness for loose and dense sands increased with cycle number.18,19 The accumulation rate of excess pore pressure around the pile would be accelerated with the increase of loading rate, which resulting in the increase of the initial stiffness of p-y curve. 17 The bearing capacity of pile increased with the increase of loading frequency and loading amplitude.5,21 Some researchers proposed that compared with unidirectional lateral loading, bidirectional lateral loading resulted in a higher lateral strain accumulation rate in the surrounding soil.22,23 Peng et al. 24 believed that the opposite was the case. The existing vertical load would increase the soil stiffness and reduce the lateral displacement of pile under lateral load and it cannot be ignored on the lateral capacity of piles. 25
According to the location of construction, the horizontal load on transmission tower structure or wind power tower may have different loading positions. 26 However, the studies on the effect of loading height on the lateral behavior of monopile foundations under horizontal loads were rarely reported in the literature. The monopile of the structures usually subjected to the long-term action of horizontal loads. 27 However, the cyclic load with a large cycle number was usually calculated by numerical method.28,29 The model test with large cycle number and high-accuracy should be further carried out to promote the development of relevant research.
The soil deformation may change the frequency eigenvalue of the structure-soil system, which increasing the risk of the structure. 30 Therefore, the deformation of soil around pile under horizontal loads should be paid more attention, which has been observed both in the field 31 and in the experiments.32,33 The experiments studies were usually conducted using model tests on a model pile with several colored sand bands preset around, which was used to highlight the sand migration pattern.34,35 It was found that the sand moved towards the pile at the initial stage of loading, and the movement continued throughout the loading process. Eventually, the soil will be divided into convective zone and static zone. The pile diameter, loading frequency and loading amplitude have significant influence on the sand movement pattern. Increasing either the loading amplitude or frequency will increase the deformation rate and the final disturbance range of soil. 34 Although there have been relevant studies on soil deformation around pile,30–35 the number of studies is still insufficient and many problems have not been solved.
Aim to the above issues, model tests of pile foundation under monotonic and long-term cyclic horizontal loads were conducted to explore the bearing characteristics of pile. The effect of cyclic number and amplitude on displacement and moment of pile was investigated. The variation of soil stiffness around pile under cyclic loading was further analyzed. Finally, combined with numerical simulation analysis of pile foundation, the deformation characteristics of pile were studied. It may provide important theoretical support for the design of monopile foundation and provide more abundant test data.
Materials and methods of model test
Soil and model pile
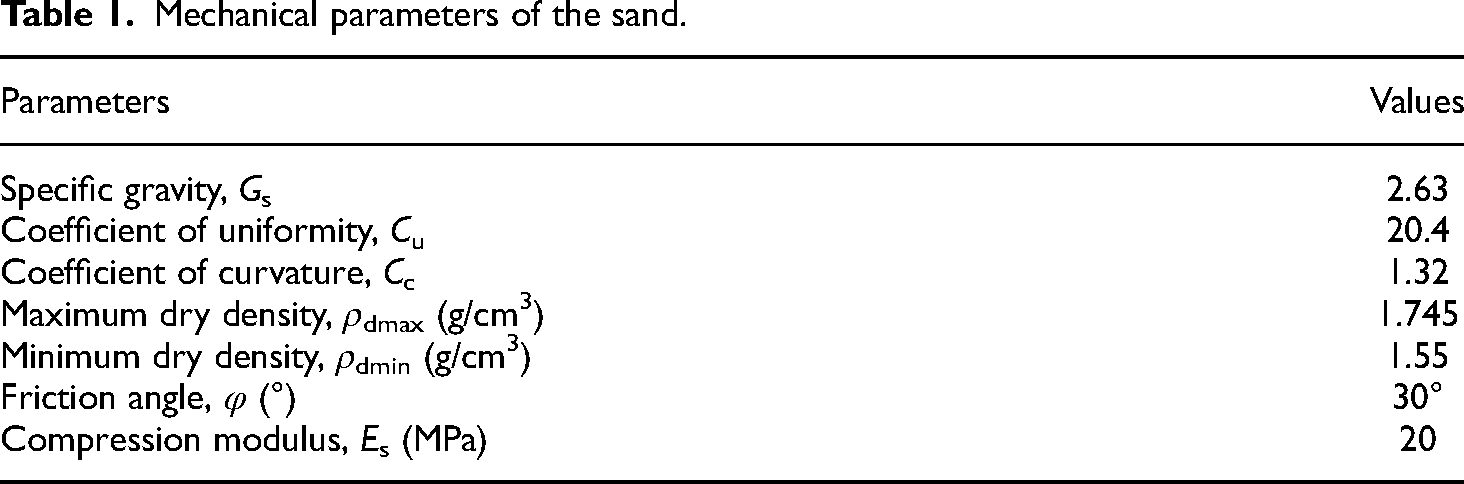
The Fujian standard sand was used for the test, which is commonly used in engineering in China. The particle distribution curve of the sand is shown in Figure 1. The soil was classified as silty sand (SM) according to the Unified Soil Classification System. All relevant mechanical parameters are listed in Table 1.

Gradation curve of the sand.
Mechanical parameters of the sand.
To better simulate the pile-soil interaction in actual engineering, the similarity ratio of the model was set to 1:20 combined with the performance and size of the test equipment. The aluminum alloy pile was final applied in this study. The diameter, length, and elastic modulus of the model pile were D = 0.03 m, L = 0.6 m, E = 71 GPa, respectively. The relative soil-pile stiffness can be represented by a non-dimensional term as proposed by Poulos and Hull
9
:
Test apparatus
A general view and schematic figure of pile foundation model used in this study is shown in Figure 2. The test apparatus is mainly composed of model box, model pile, motor servo actuator, reaction frame, stress-strain measurement and analysis system, laser displacement sensor and computer. The dimensions of the model box were 600 mm × 600 mm × 800 mm. The model pile was strictly installed in the center of the model box. The distances from the pile to the edge and bottom of the model box were controlled at 9.5D (285 mm) and 9D (280 mm), respectively, at which the boundary effect can be ignored. 36
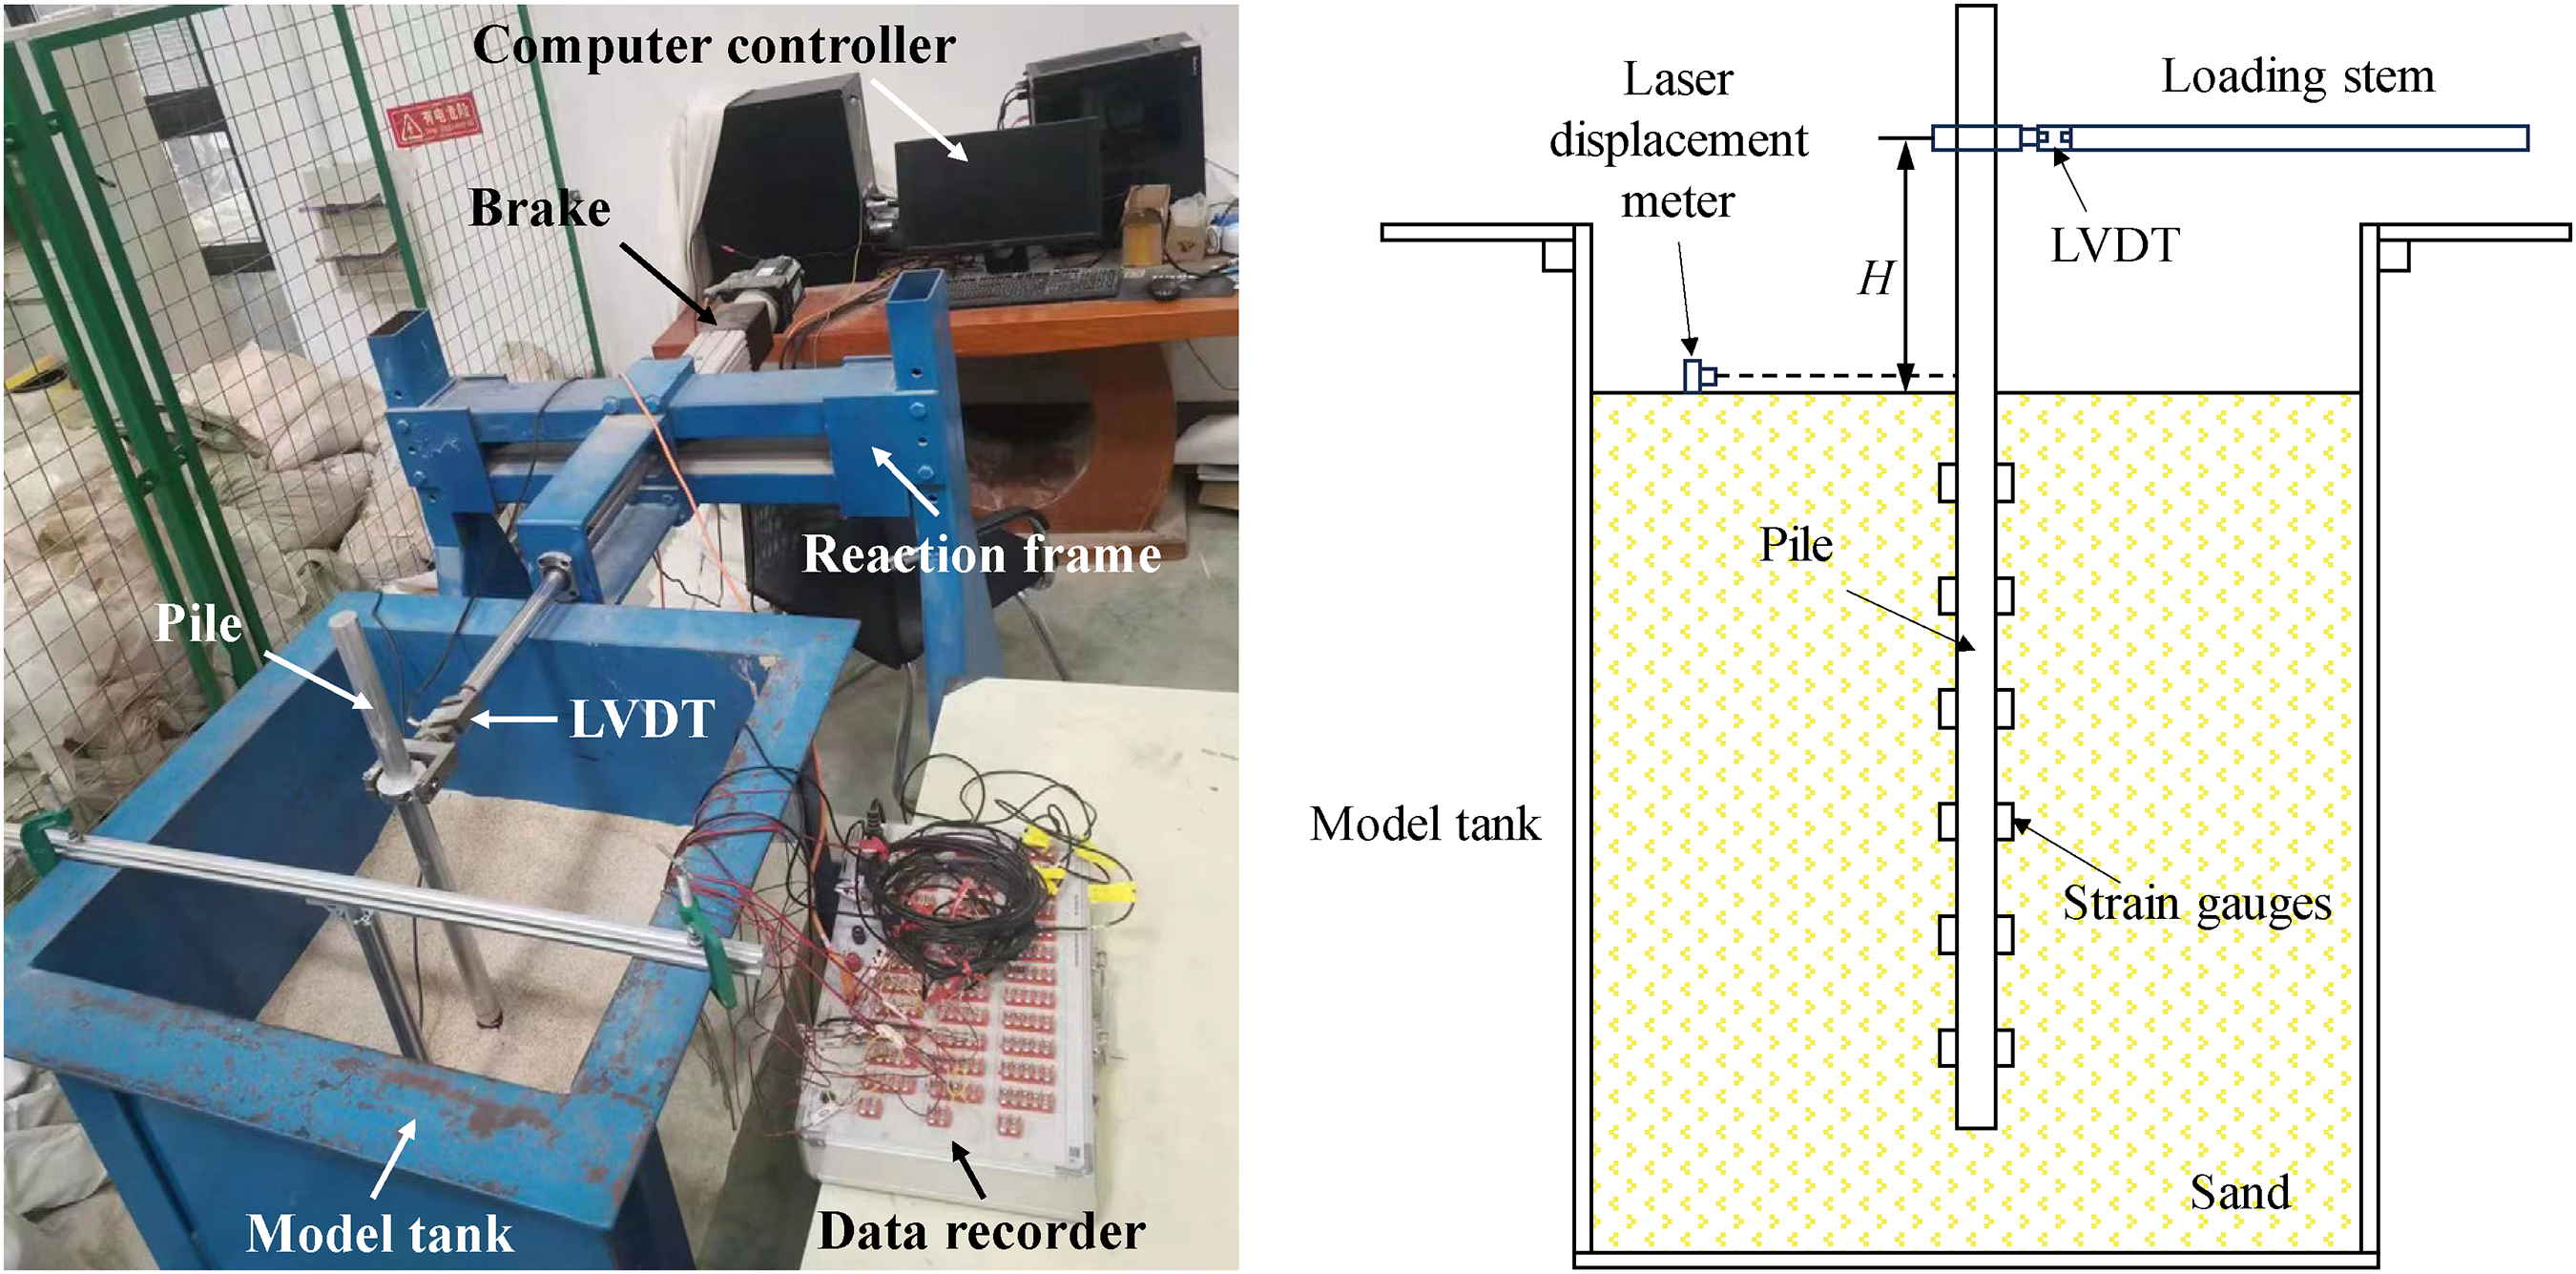
Physical and schematic figure of pile foundation model.
A horizontal load, including monotonic and cyclic loads, was applied to the model pile at the top by using a motor servo actuator. The distance between the loading point and the sand ground surface was expressed by the height of loading point (H).
The measurement system mainly includes strain gauges, linear variable differential transformers (LVDTs), and laser displacement meters. The LVDT was used to monitor the load and deformation at the loading point, while the laser displacement meter was used to monitor the horizontal displacement of the pile at the sand ground surface. The difference between two measured displacements can be used to calculate the rotation of the pile head. To measure the strain of the pile, 12 strain gauges were symmetrically distributed on both sides of the pile with a fixed spacing of 70 mm along the embedded length. The distribution diagram of strain gauges on the pile was shown in Figure 2(b).
Test program and progress
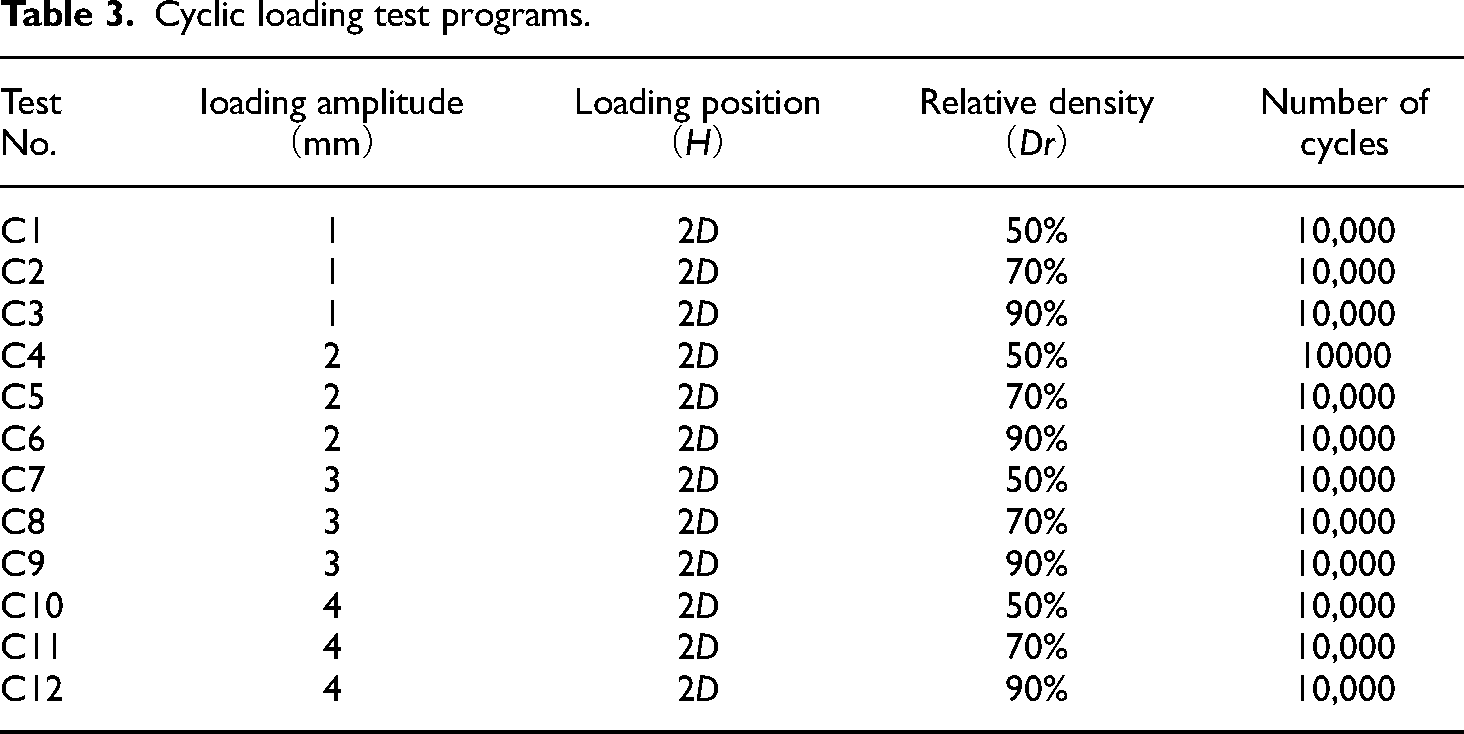
The height of load application (H) and the relative density of soil (Dr) have a significant impact on the horizontal bearing performance of pile foundations. In order to investigate the influence of H and Dr on the monotonic bearing characteristics of pile foundations, a total of 9 sets of monotonic horizontal loading tests were conducted under different H and Dr The specific test arrangements are shown in Table 2. Twelve groups of cyclic horizontal loading tests were carried out under different loading amplitude (A) and Dr to investigate its influence on the cyclic bearing characteristics of pile, as shown in Table 3. The burial depth of the pile for all the test was fixed at 480 mm.
Monotonic lateral loading programs.

Cyclic loading test programs.
The displacement control was chosen for all the monotonic and cyclic loading tests. Before the test, the model pile was adjusted to the central position of the model box. The pile was kept naturally vertical by gravity and fixed at that position. The sand was poured in to the model box using the air pluviation method. The sand was then compacted to achieve a relative density of 50%, 70%, and 90%. 37 After the soil preparation was completed, monotonic or cyclic loading tests were carried out. During the loading process, the load and displacement at the loading point, horizontal displacement of the pile at the sand ground surface, and the strain of the pile were measured.
The loading ratio for the monotonic horizontal loading test was 0.02 mm/min according to the results of trial test. For the tests under cyclic loading, the loading waveform was a sine wave type and the loading frequency (f) was 1 Hz. To ensure the direction of the cyclic loading was positive, an initial displacement value was set before loading. In each cycle, the pile was loaded forward from a displacement of 0 mm to the peak displacement, and then unloaded to 0 mm. The test terminated when the number of cycles reached 10,000.
Bearing characteristics of pile
Bearing characteristics under monotonic load
The typical normalized load-displacement curve of the pile top in the monotonic horizontal loading test is shown in Figure 3 (where L is loading amplitude, γ is effective unit weight of soil; y is displacement of pile). It can be observed that the curve shows a continuous increasing trend, without any obvious failure turning points, which is consistent with many other researches.21,36,38 Given the lack of yielding point for the load-displacement curve, the horizontal bearing capacity was defined as the load with a lateral displacement of 0.1–0.2D. 39 In this study, the load as lateral displacement of 0.2D was defined as the horizontal bearing capacity.
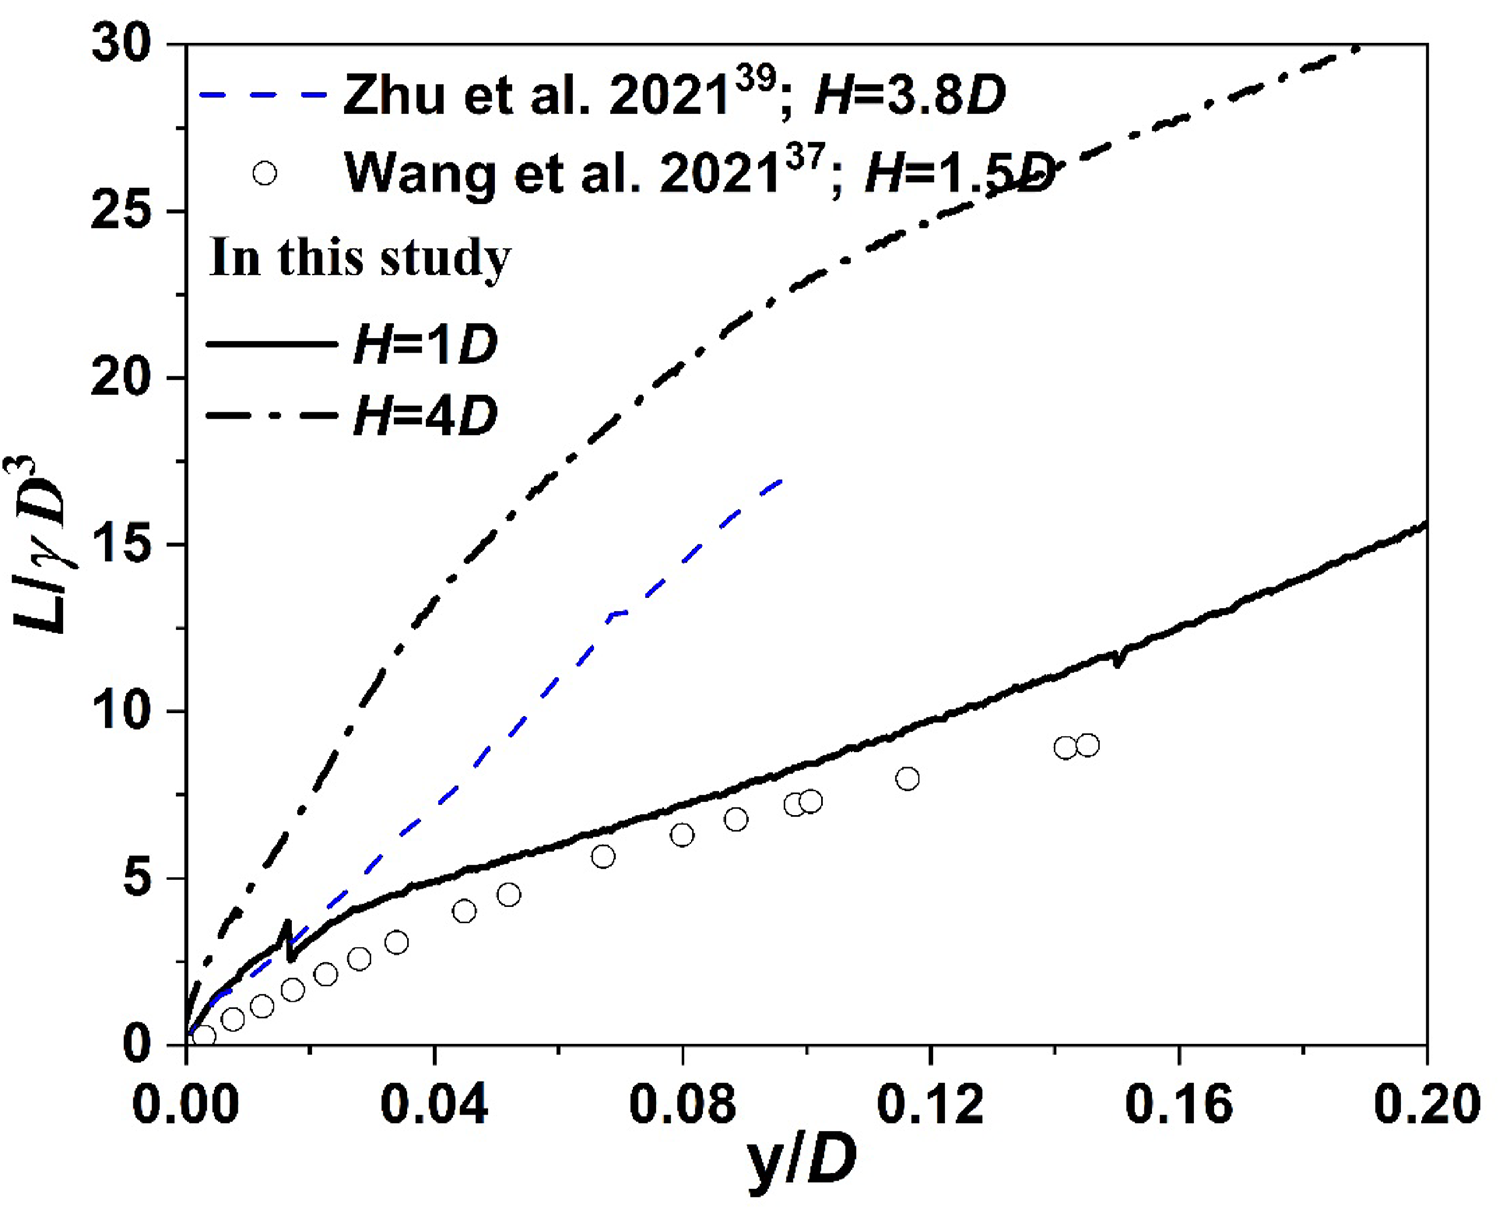
Typical normalized load-displacement curve of the pile top in the monotonic horizontal loading test.
The horizontal load-displacement curve of the pile top under different H is shown in Figure 4. It can be observed that the horizontal load on the pile top increases rapidly in the early stage of loading. The increasing rate of the horizontal load gradually slows down as the displacement increases. There is an obvious effect of H on the bearing characteristics of pile. As H decreases, the horizontal bearing capacity of pile significantly increases. For instance, when the relative density of soil is 50%, the horizontal bearing capacity of the pile foundation corresponding to H of 1D, 2D, and 4D mm is 240.6, 192.3, and 123.8 N, respectively. It means that the horizontal bearing capacity of the pile decreases by 1.9 times with the loading height varies from 1D to 4D. Moreover, with the increase of soil relative density, the influence of loading height decreases gradually.

Horizontal load-displacement curves with different loading height at different Dr: (a) Dr =50%; (b) Dr =70%; (c) Dr =90%.
Figure 5 presents the horizontal load-displacement curve of the pile top under the different relative density of soil (Dr). As the increase of Dr, the horizontal bearing capacity of the pile improves. For example, when the height of loading point H is 1D, the horizontal bearing capacity of the pile corresponding to Dr of 50%, 70%, and 90% is 240.6, 371.5, and 578.4 N, respectively. The horizontal bearing capacity of the pile increases by 1.4 times when the relative density of soil Dr increases from 50% to 90%. It also should be noticed that the effect of the soil relative density becomes more obvious with the increase of loading height.

Load-displacement curves with different relative soil density at different H: (a) H = 1D; (b) H = 2D; (c) H = 4D.
Figure 6 shows a comparison of the bending moment of model pile with different loading height H at the same loading level (0.1 kN). As the embedded depth increases, the bending moment of the pile increases firstly and then decreases. The peak position of bending moment is within the embedded depth ranging from 5 to 7 times pile diameter. And the position shows an upward trend with the increase of H. The value of the peak bending moment is significantly influenced by H. When the loading height H increases from 1D to 4D, the peak bending moment of pile in the test with a soil relative density of 50%, 70%, and 90% increases by 22.9%, 36.4% and 36.8%, respectively. This is because the pile embedded in the soil presents a cantilever beam shape with one end fixed and one end free. An increase in the loading height H indicates an increase in the lever. Under the same horizontal load, the peak bending moment of the pile increases.

Comparison of depth-bending curves with different loading height at different Dr: (a) Dr = 50%; (b) Dr = 70%; (c) Dr = 90%.
The bending moments of model pile under different relative density of soil at 0.1 kN are shown in Figure 7. As shown in the figure, the peak bending moment of the pile decreases as the relative density of soil increases with the same loading height. When the relative density of soil was increased from 50% to 90%, the peak bending moment of the pile with loading heights of 1D, 2D, and 4D decreased by 19.1%, 17.6%, and 17.3%, respectively. This is due to the higher stiffness of the soil under the high relative density of soil. Under the same level of horizontal load, the strain of the pile corresponding to the higher soil stiffness is smaller.

Comparison of depth-bending moment curves with different relative soil density at different H: (a) H = 1D; (b) H = 2
Bearing characteristics under cyclic load
The comparison of load-displacement curves at the pile top under different displacement amplitudes is presented in Figure 8. It can be observed that the load-displacement curve during a single cycle presents a closed hysteresis curve. As the number of cycles increases, the curve gradually shifts downwards. However, the influence of the number of cycles gradually weakens as the displacement amplitude increases. Moreover, the amplitude of displacement also has a significant impact on the load of the pile top. As can be seen, the pile top load increases obviously with the increase of displacement amplitude. For example, when cyclic number of 10,000, the peak loads on the pile top corresponding to displacement amplitudes of 1, 2, 3, and 4 mm are 148, 331, 482, 635 N, respectively. For each 1 mm increase in displacement amplitude, the peak load on the pile top increased by 31.7%–56.1%, respectively.

Comparison of load-displacement curves of pile top under different loading amplitudes: (a) 1 mm; (b) 2 mm; (c) 3 mm; (d) 4 mm.
Figure 9 shows the comparison of load-displacement curves at the pile top under different relative density of soil. As shown in Figure 9, the peak load on the pile gradually increases with the increase of the relative density of the soil. The positive peak load of pile increased by 56.5% when the relative density of soil increased from 50% to 90%, while the negative peak load increased by 1.78 times. In addition, it should be noticed that the load-displacement curve rotates counterclockwise as the number of cycles increases, which indicates the increases of the stiffness of the soil.

Comparison of load-displacement curves of pile top at different Dr: (a) Dr = 50%; (b) Dr = 70%; (c) Dr = 90%.
The comparison of soil stiffness variation under different soil relative density with the displacement amplitude of 2 mm is shown in Figure 10. With the increase of the cyclic numbers, the stiffness of the soil decreases first and then increases gradually. This may be due to the disturbance of the soil in the initial stage of loading. Additionally, it can be seen that the higher the relative density, the higher the stiffness of the soil. After 10000 cyclic loads, the soil stiffness increased by 23.1% compared with the initial value under the soil relative density of 50%. On the contrary, it does not reach the initial value with the soil relative density of 50% and 90%.

Comparison of soil stiffness under different relative density of soil.
The displacement amplitude is another important parameter that affects the soil stiffness around the pile. The soil stiffness after 10,000 cyclic loading is selected for comparison to analyze the influence of displacement amplitude on soil stiffness, as shown in Figure 11. It can be seen from Figure 11 that the soil stiffness presents a decreasing trend with the increase of displacement amplitude.

Comparison of the stiffness of soil around the pile under different displacement amplitudes.
Deformation characteristics of pile
The deformation development of the soil around the pile-top during the cyclic loading process is presented in the Figure 12. It can be observed that under the repeated action of cyclic horizontal loading, the soil within a small range around the pile undergoes depression, which is defined as dense subsidence effect. 34 The model tests have the limitation to accurately observe the displacement of the pile and the development of soil deformation around the pile under horizontal loading. In this section, a numerical model is used to study the displacement development of the pile and surrounding soil.
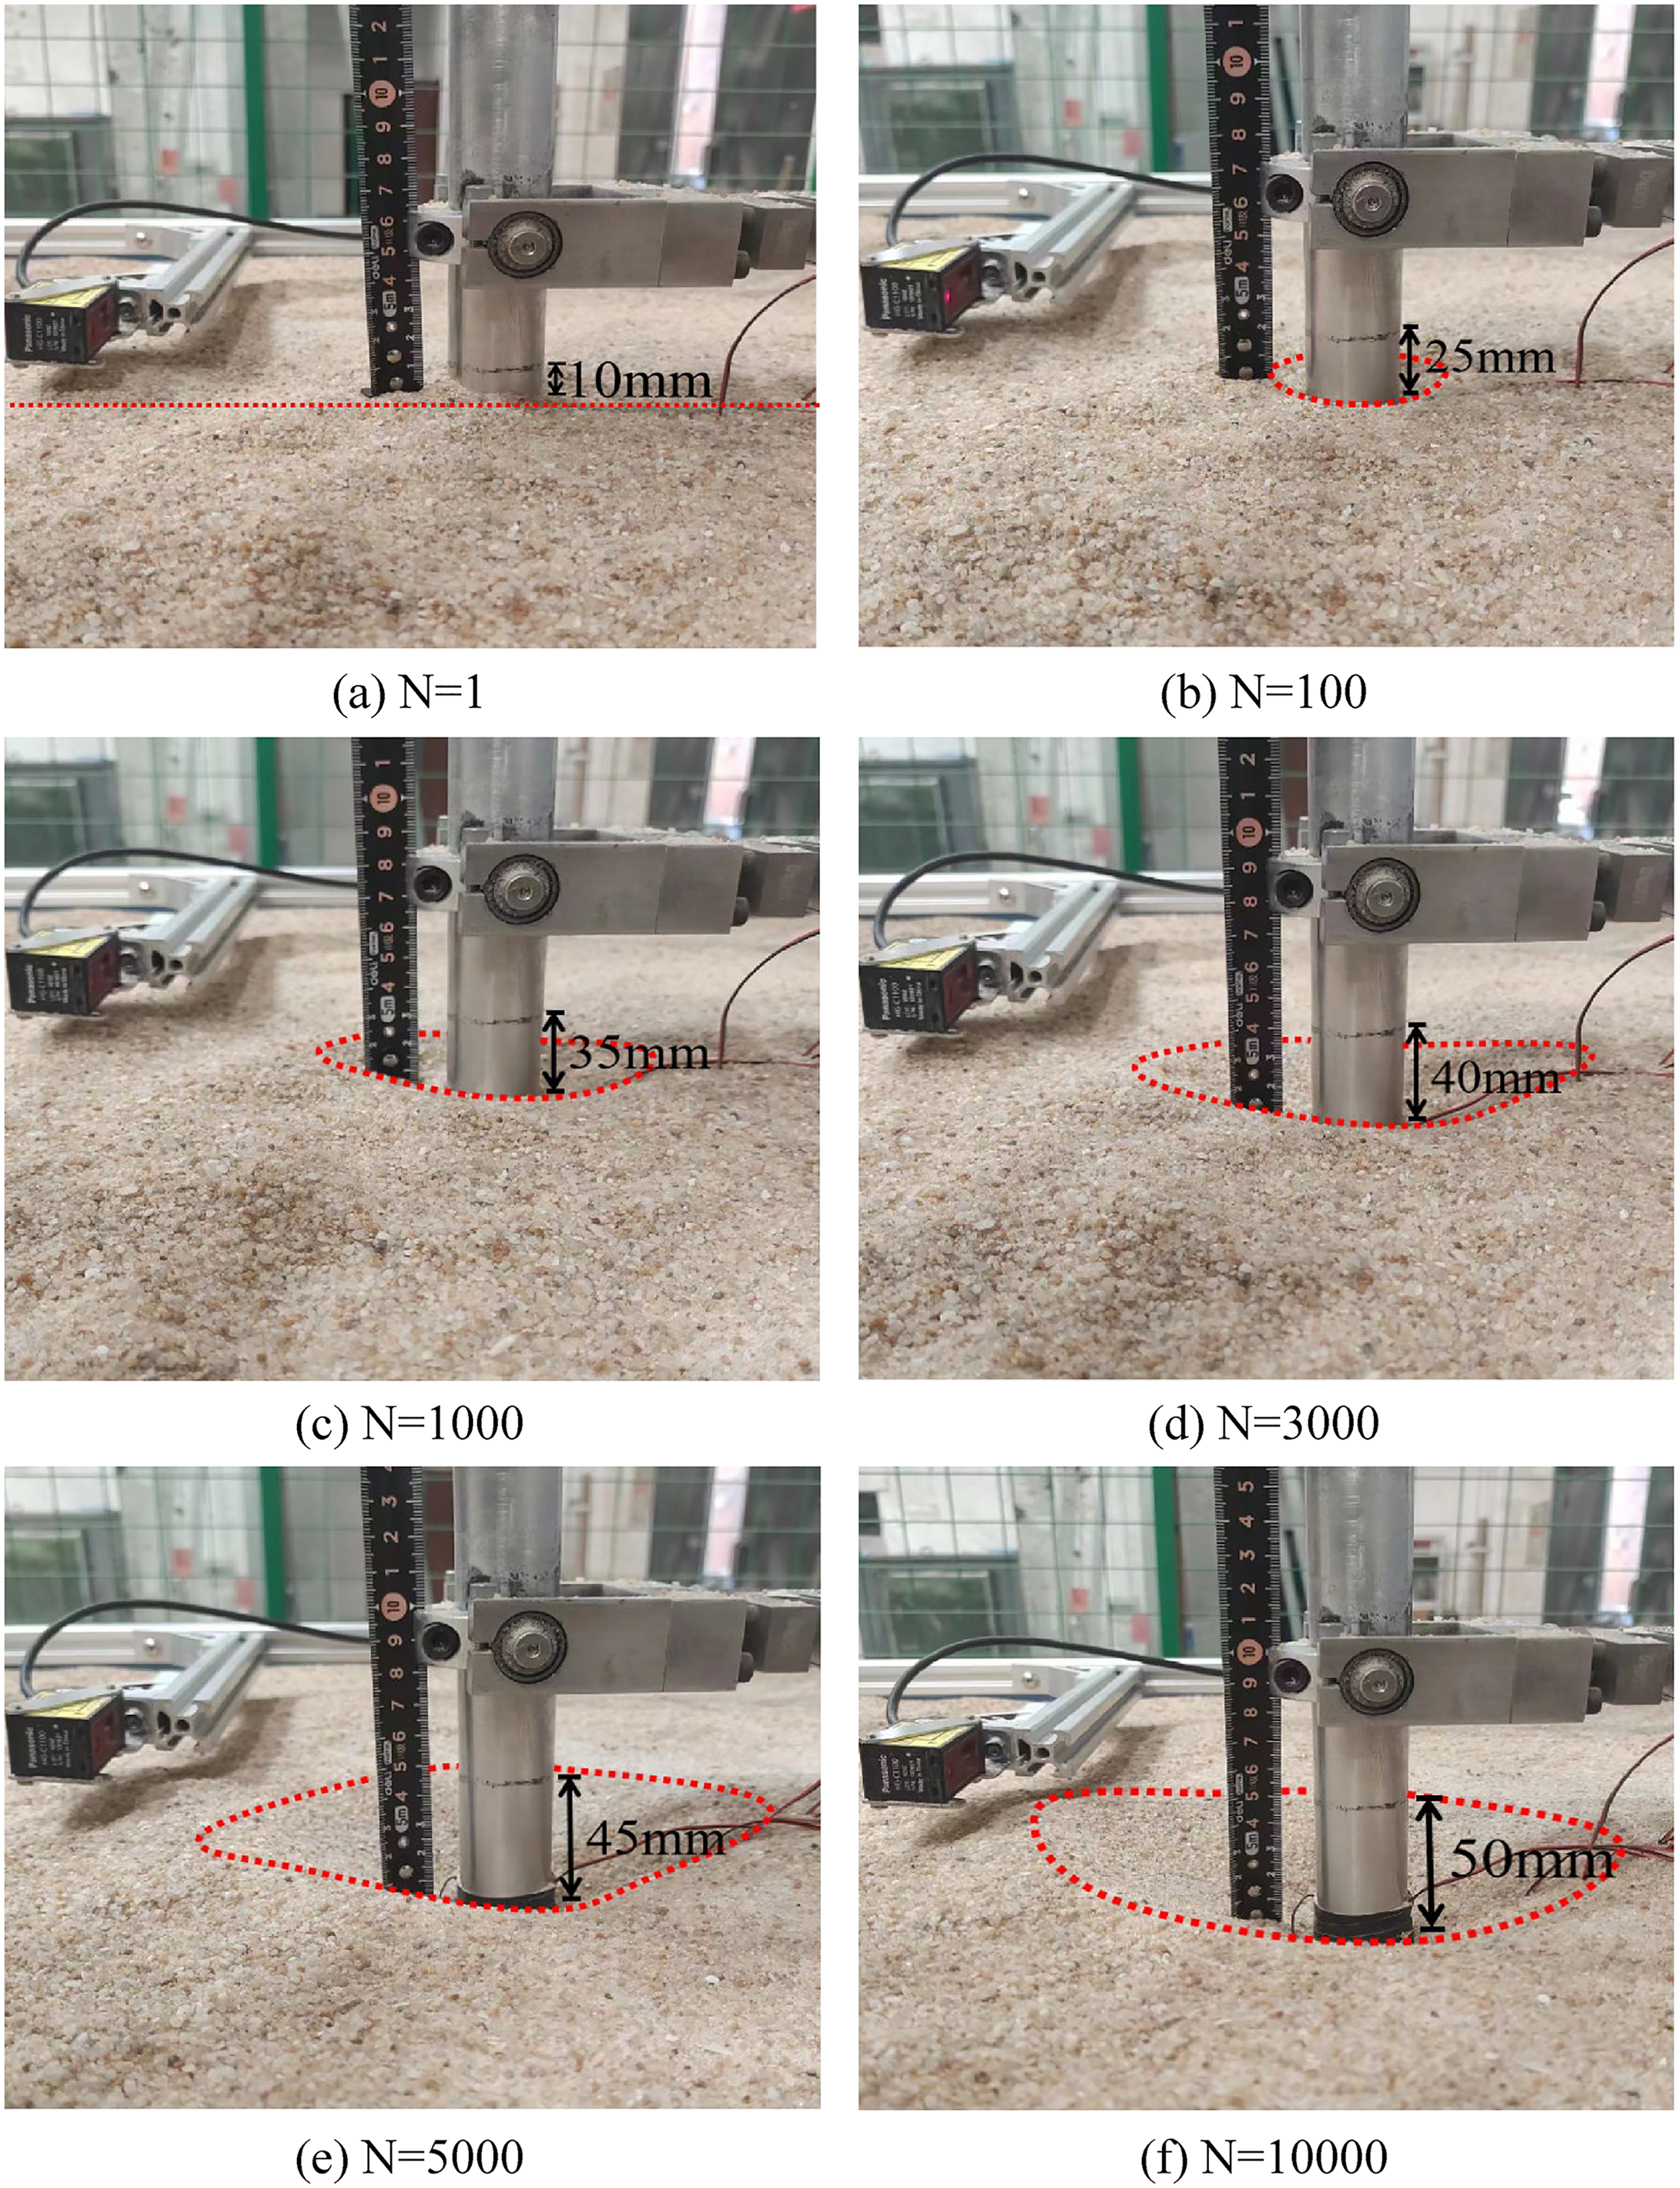
Evolution trend of dense subsidence area around pile under cyclic loading.
Numerical model and verification
The software of FLAC3D was employed for the establishment of pile-soil numerical model. The soil and pile in the model have the same size and properties as the model test. Mesh refinement is firstly investigated to ensure accurate results. The soil is established using the radical-cylinder command and pile is established using the cylinder command. To improve the efficiency of numerical simulation operations as much as possible, a reasonable grid division was carried out on the soil within the influence range of the pile foundation. The soil grid near the pile was dense, while the grid far away from the pile was slightly wider. The numerical calculation model diagram is shown in Figure 13.

Numerical calculation model.
The boundary conditions of the model are set to be fixed around and at the bottom, with the top free. The pile is assumed to linear elastic with an elastic modulus of 71 GPa and Poisson's ratio of 0.33. The soil is simulated as an elastic-plastic material according to the Mohr-Columb failure criterion. The soil parameters in the numerical model are the same as those in the model tests. Among them, the shear dilation angle of the soil is 10°, and the cohesive is 0.1 kPa.
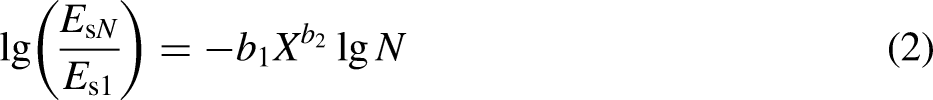
The cumulative deformation under cyclic horizontal loading is a key issue in the design of pile. Among the current methods for calculating the cumulative deformation characteristics of pile, the stiffness reduction is a relatively simple and effective method. Achmus et al.
40
established a stiffness reduction model based on the secant modulus attenuation of soil to calculate the cumulative deformation of pile under cyclic loading. The formula is as follows:


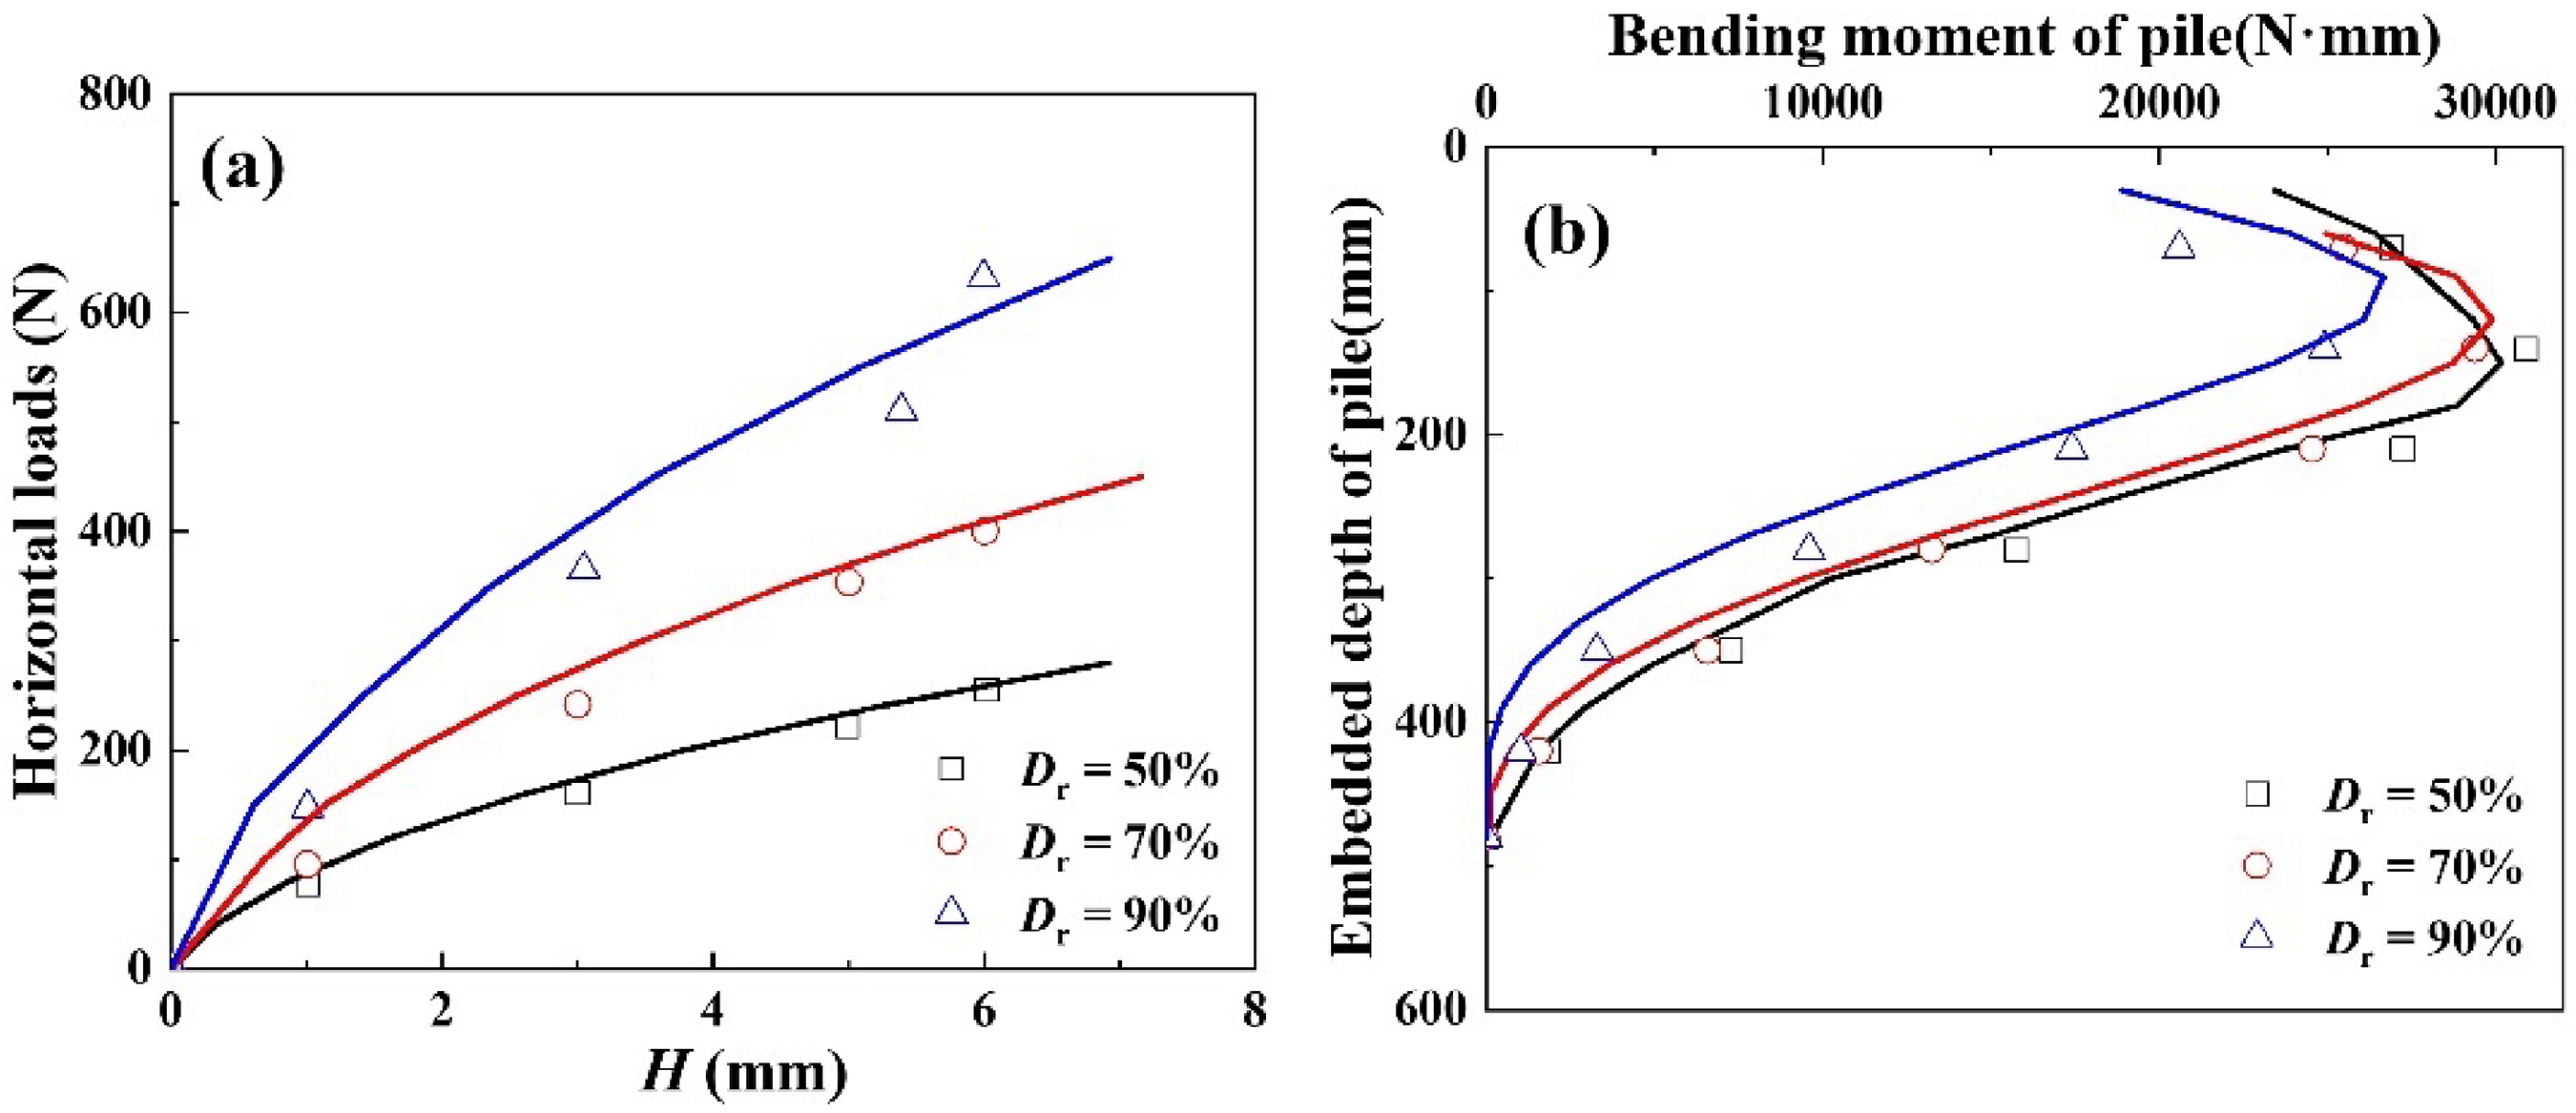
Comparison of numerical calculation and model test: (a) load-displacement curve; (b) bending moment of pile.
Horizontal displacement of pile under monotonic load
The horizontal displacements of the pile under the soil relative density of 50%, 70%, and 90% are presented in Figure 15. On the whole, the development of horizontal displacement is generally the same for the pile under the different relative density of soil. It indicates that the deformation of pile is very small during the initial stage of loading. With the increase of horizontal load, the displacement of pile increases. In addition, the displacement of pile decreases along the pile. The displacement approaches almost zero at a depth of 440 mm, indicating that the bottom of the pile almost not affected by horizontal loads.

Development of pile displacement under different monotonic lateral loads at different Dr: (a) Dr = 50%; (b) Dr = 70%; (c) Dr = 90%.
Figure 16 shows the horizontal displacement nephogram of soil around the pile. As the horizontal load increases, the zone of displacement of the soil extends towards the bottom of the pile. It indicates that the upper soil has reached its ultimate bearing state and is unable to continue bearing the horizontal load due to damage. The lower soil begins to exert shear resistance and continue to bear the load. When the horizontal load reaches 600 N, the pile reaches its ultimate bearing state. The upper load is transmitted to the pile bottom.

Horizontal displacement nephogram of soil around the pile under different monotonic lateral load.
Horizontal displacement of pile top under cyclic load
Figure 17 shows a comparison of the displacement development of pile under cyclic horizontal load of 50 N at soil relative densities of 50%, 70%, and 90%. As can be seen from the figure, the horizontal displacement of the pile top continues to increase as the number of cycles increases. After 1000 cycles, the horizontal displacement gradually stabilized, which is consistent with the results of the model tests. Moreover, as the relative density of the soil increases, the displacement of the pile top gradually decreases.

Displacement of pile top under cyclic load of 50 N at different Dr: (a) Dr = 50%; (b) Dr = 70%; (c) Dr = 90%.
The horizontal displacement nephograms of soil around the pile with the soil relative density of 70% and the cyclic load of 50 N is shown in Figure 18. As shown in Figure 18, with the increase of the number of cycles, the displacement of the pile significantly increases. And the displacement continues to develop towards the lower part of the pile until it covers the entire lower part of the model. This is because under long-term cyclic horizontal loads, the soil around the pile is disturbed and damaged, which unable to continue to withstand the horizontal load. The load gradually transfers to the deep soil, causing horizontal deformation of the deep soil, until it covers the entire lower part of the model.

Horizontal displacement nephogram of soil around the pile under cyclic load of 50 N.
Conclusions
In this study, the bearing and deformation characteristics of pile under monotonic and cyclic loading were explored by using model test and numerical simulation. The effect of loading height, relative density of soil, displacement amplitude on the lateral behavior of pile was investigated. The deformation of soil around the pile were also analyzed. The main conclusions are summarized as follows:
The monotonic load-displacement and bending moment curves of pile in different loading heights and soil relative densities show a very similar pattern. With the loading height varies from 1D to 4D, the horizontal bearing capacity of the pile under different the soil relative density decreased by 1.63–1.9 times, and the peak bending moment increased by 22.9%–36.8%. Moreover, the influence of loading height decreases gradually with the increase of soil relative density. Under the cyclic loads, the peak load on the pile top increased by 31.7%–56.1% for each 1 mm increase in displacement amplitude. The stiffness of soil around pile varies as the number of cycles increases during the cyclic loading with the development trend of decreases first and then increases gradually. After 10,000 cyclic loads, the soil stiffness increased by 23.1% compared with the initial value under the soil relative density of 50%. On the contrary, it does not reach the initial value with the soil relative density of 50% and 90%. During the cyclic loading or monotonic loading, the displacement of pile increases with the increase of horizontal load and cycle number, but it decreases with the increasing relative density of soil. The displacement approaches almost zero at a depth of 14.6D, which is a typical manifestation of flexible pile. As the horizontal load and cycle number increase, the displacement zone of soil extends towards the bottom of pile, until it covers the entire lower part of the model.
Footnotes
Declaration of conflicting interests
The authors declared no potential conflicts of interest with respect to the research, authorship, and/or publication of this article.
Funding
The authors disclosed receipt of the following financial support for the research, authorship, and/or publication of this article: This work was supported by the Innovative Research Project of Graduate Students of Zhejiang (grant number Y202351971). These financial supports are gratefully acknowledged.
Author biographies
Jian Ma, Doctor, senior engineer, mainly engaged in the research of pile bearing capacity.
Junyue Xu, Master, junior engineer, mainly engaged in the research of horizontal bearing capacity of piles.
Zhenkai Fan, Master, junior engineer, mainly engaged in the research of horizontal bearing capacity of piles.
Hui Li, Doctor, lecturer, mainly engaged in the research of pile-soil interaction.
Gang Xu, Master, junior engineer, mainly engaged in the research of horizontal bearing capacity of piles.