
Abstract
In this paper, the wing body fusion method is used to complete the design of underwater glider. On this basis, the traditional optimization algorithm of underwater gliding wing shape is improved. Based on the improved Hicks Henne algorithm and genetic algorithm, the shape optimization of underwater glider is completed. Through the further optimization of the overall performance, the overall shape of the glider is improved and the maximum lift drag ratio is increased. Finally, the physical experiment of the optimized shape is carried out according to the experimental water area of the circulating water tank. Through the comparative analysis of the data, the accuracy of the numerical calculation is verified.
Introduction
In modern society, countries all over the world are developing and designing excellent underwater machines for the huge resources contained in the ocean. 1 Underwater glider is a new type of underwater equipment invented and improved in such an environment. 2 Glider has the advantages of low energy consumption, long range and high efficiency. It can explore and monitor the ocean in a wide range. Based on the wide area characteristics of the ocean, the underwater glider with the advantages of wide working range plays a major role in the exploration of the ocean.3,4
The underwater glider with water drop shape as the main body shape is a common design concept of the main cabin shape, among which Slocum 5 and Spray 6 are therepresentative. This appearance often has a larer body volume, which can accommodate more functional devices. However, the traditional shape of the main cabin of the body of revolution usually can not have a relatively high lift drag ratio performance.7,8 The traditional shape of low resistance layer fluid will be designed to produce a relatively uniform pressure gradient, 9 which will significantly increase the size of laminar flow area when the underwater glider is moving, thus greatly reducing the size of viscous resistance. According to the relevant literature research, seaglider 10 with low resistance layer fluid shape can still achieve higher laminar length at very high speed. However, the low resistance layer fluid shape has a very high requirement for machining accuracy, and the small machining of the main surface will lead to the reduction of the length of the laminar layer, and then the advantage of the low resistance laminar layer will be lost. Dr Grave designed an underwater glider with a flat ellipsoid as the main shape. 11 The underwater glider with this design can achieve better lift drag characteristics and higher optimal lift drag ratio under the condition of equal internal volume.
Gliders currently serve as an important tool for oceanographic monitoring from coastal waters to open oceans owing to their capacity to operate autonomously in all weather conditions on missions lasting up to several months. Several commercial products are now widely used in integrated ocean observing systems eddy monitoring from the sub-mesoscale to mesoscale, upper ocean monitoring from the hurricane pathway, 12 and providing high-resolution in-situ data to data assimilation and model forecasts. 13 One of the most advanced underwater gliders is the Sea-Wing series, 14 Sea-Wing 7000 is in its debug and testing phase and has already had its marine trial in 2017. Sea-Wing 7000 is distinctly superior in its propelling system, which enables it to sail as an autonomous underwater vehicle. New editions of Sea-Wing have been launched recently, including Sea-Wing 1500 and Sea-Wing 4500.
In many performance calculation methods, the more mature CFD method is recognized as the more effective method. At present, there are two methods to optimize the performance of hydrodynamic shape. The first method is to get the gradient information of different key parameters on the overall performance while calculating the perfor- mance of different models, and then use some algorithms that can use this gradient information to optimize and improve the shape performance.15–17 The advantage of this method is that with the help of gradient information, the optimization speed is faster, the operation time can be saved, and the optimization cost can be reduced. But at the same time, this method has some limitations and short comings, it is difficult to control the overall situation, and it is easy to become a local optimal optimization. The other is based on the agent model.18,19 The advantage of this method is to replace the more difficult fluid performance calculation with the proxy model, and reduce the time consumption of the optimization process to a certain extent. This method can also achieve global optimization and has better credibility. But the bigger problem is that this kind of surrogate model is only a simplified model to reduce the complexity of calculation, so the hydrodynamic performance parameters calculated by this method are not accurate, and often have certain errors, which can not be avoided. There is no way to compare the accuracy with the optimization results of directly improving the shape in a large range. The optimization method selected in this paper accurately calculates the hydrodynamic performance of the glider from the perspective of global and high precision by using the idea of reference, 20 and iteratively calculates the performance of future generations with the help of genetic algorithm, so as to obtain a better improved model.21–22
The second chapter mainly introduces how to design an underwater glider that meets the performance requirements. 23 The third chapter starts with the wing section, plane shape and span thickness of the glider. Firstly, with the help of the improved Hicks Henne airfoil optimization algorithm, adjust the airfoil section of the initial glider to make it have higher lift drag characteristics. Then, the overall shape is controlled by the parameterization of plane shape and span wise thickness. Then some parameters are selected as variables to change within a reasonable range, so as to change the overall shape of the glider. Through iteration and high-precision performance calculation, the shape of glider with good performance is selected. In the fourth chapter, the accurate hydrodynamic performance calculation is carried out and analyzed in detail. In the fifth chapter, the optimized glider is selected for physical production, and physical experiments are carried out in the circulating water tank. Through the comparison of experimental data and simulation data, the accuracy and rationality of this method are verified.
Conceptual design
Initial design
This chapter focuses on the conceptual design of underwater glider. Through the study of the principle of underwater glider, the appropriate hydrodynamic shape is selected to complete a reasonable initial design of underwater glider.
Design objective and performance index.

Shape design of underwater glider
For the underwater glider designed in this paper, it needs to place certain carrying controls and motors in it. Considering that the main body is mainly based on the requirement of sufficient internal space and good lift drag ratio, the shape of the glider with flat ellipsoid is selected as the main body shape. At the same time, this shape can better realize wing body fusion and has higher hydrodynamic performance. In order to reduce the influence of the main cabin on the overall hydrodynamic performance, the section of the main cabin should be designed with a convex profile similar to the airfoil, which can also ensure that the main cabin has enough volume.
There are many kinds of airfoil, the choice of airfoil needs to select the appropriate lift drag characteristics of the airfoil. The speed of the underwater glider designed in this paper is 1m/s, which belongs to low speed, and needs a higher lift drag characteristics in performance. According to these requirements, the 00xx series airfoil with symmetrical lift drag characteristics is selected, and the NACA0024 airfoil with a certain thickness is selected on the maximum thickness of the airfoil, which can leave space for future motor layout.
The airfoil section of NACA0024 is shown in the following figure:
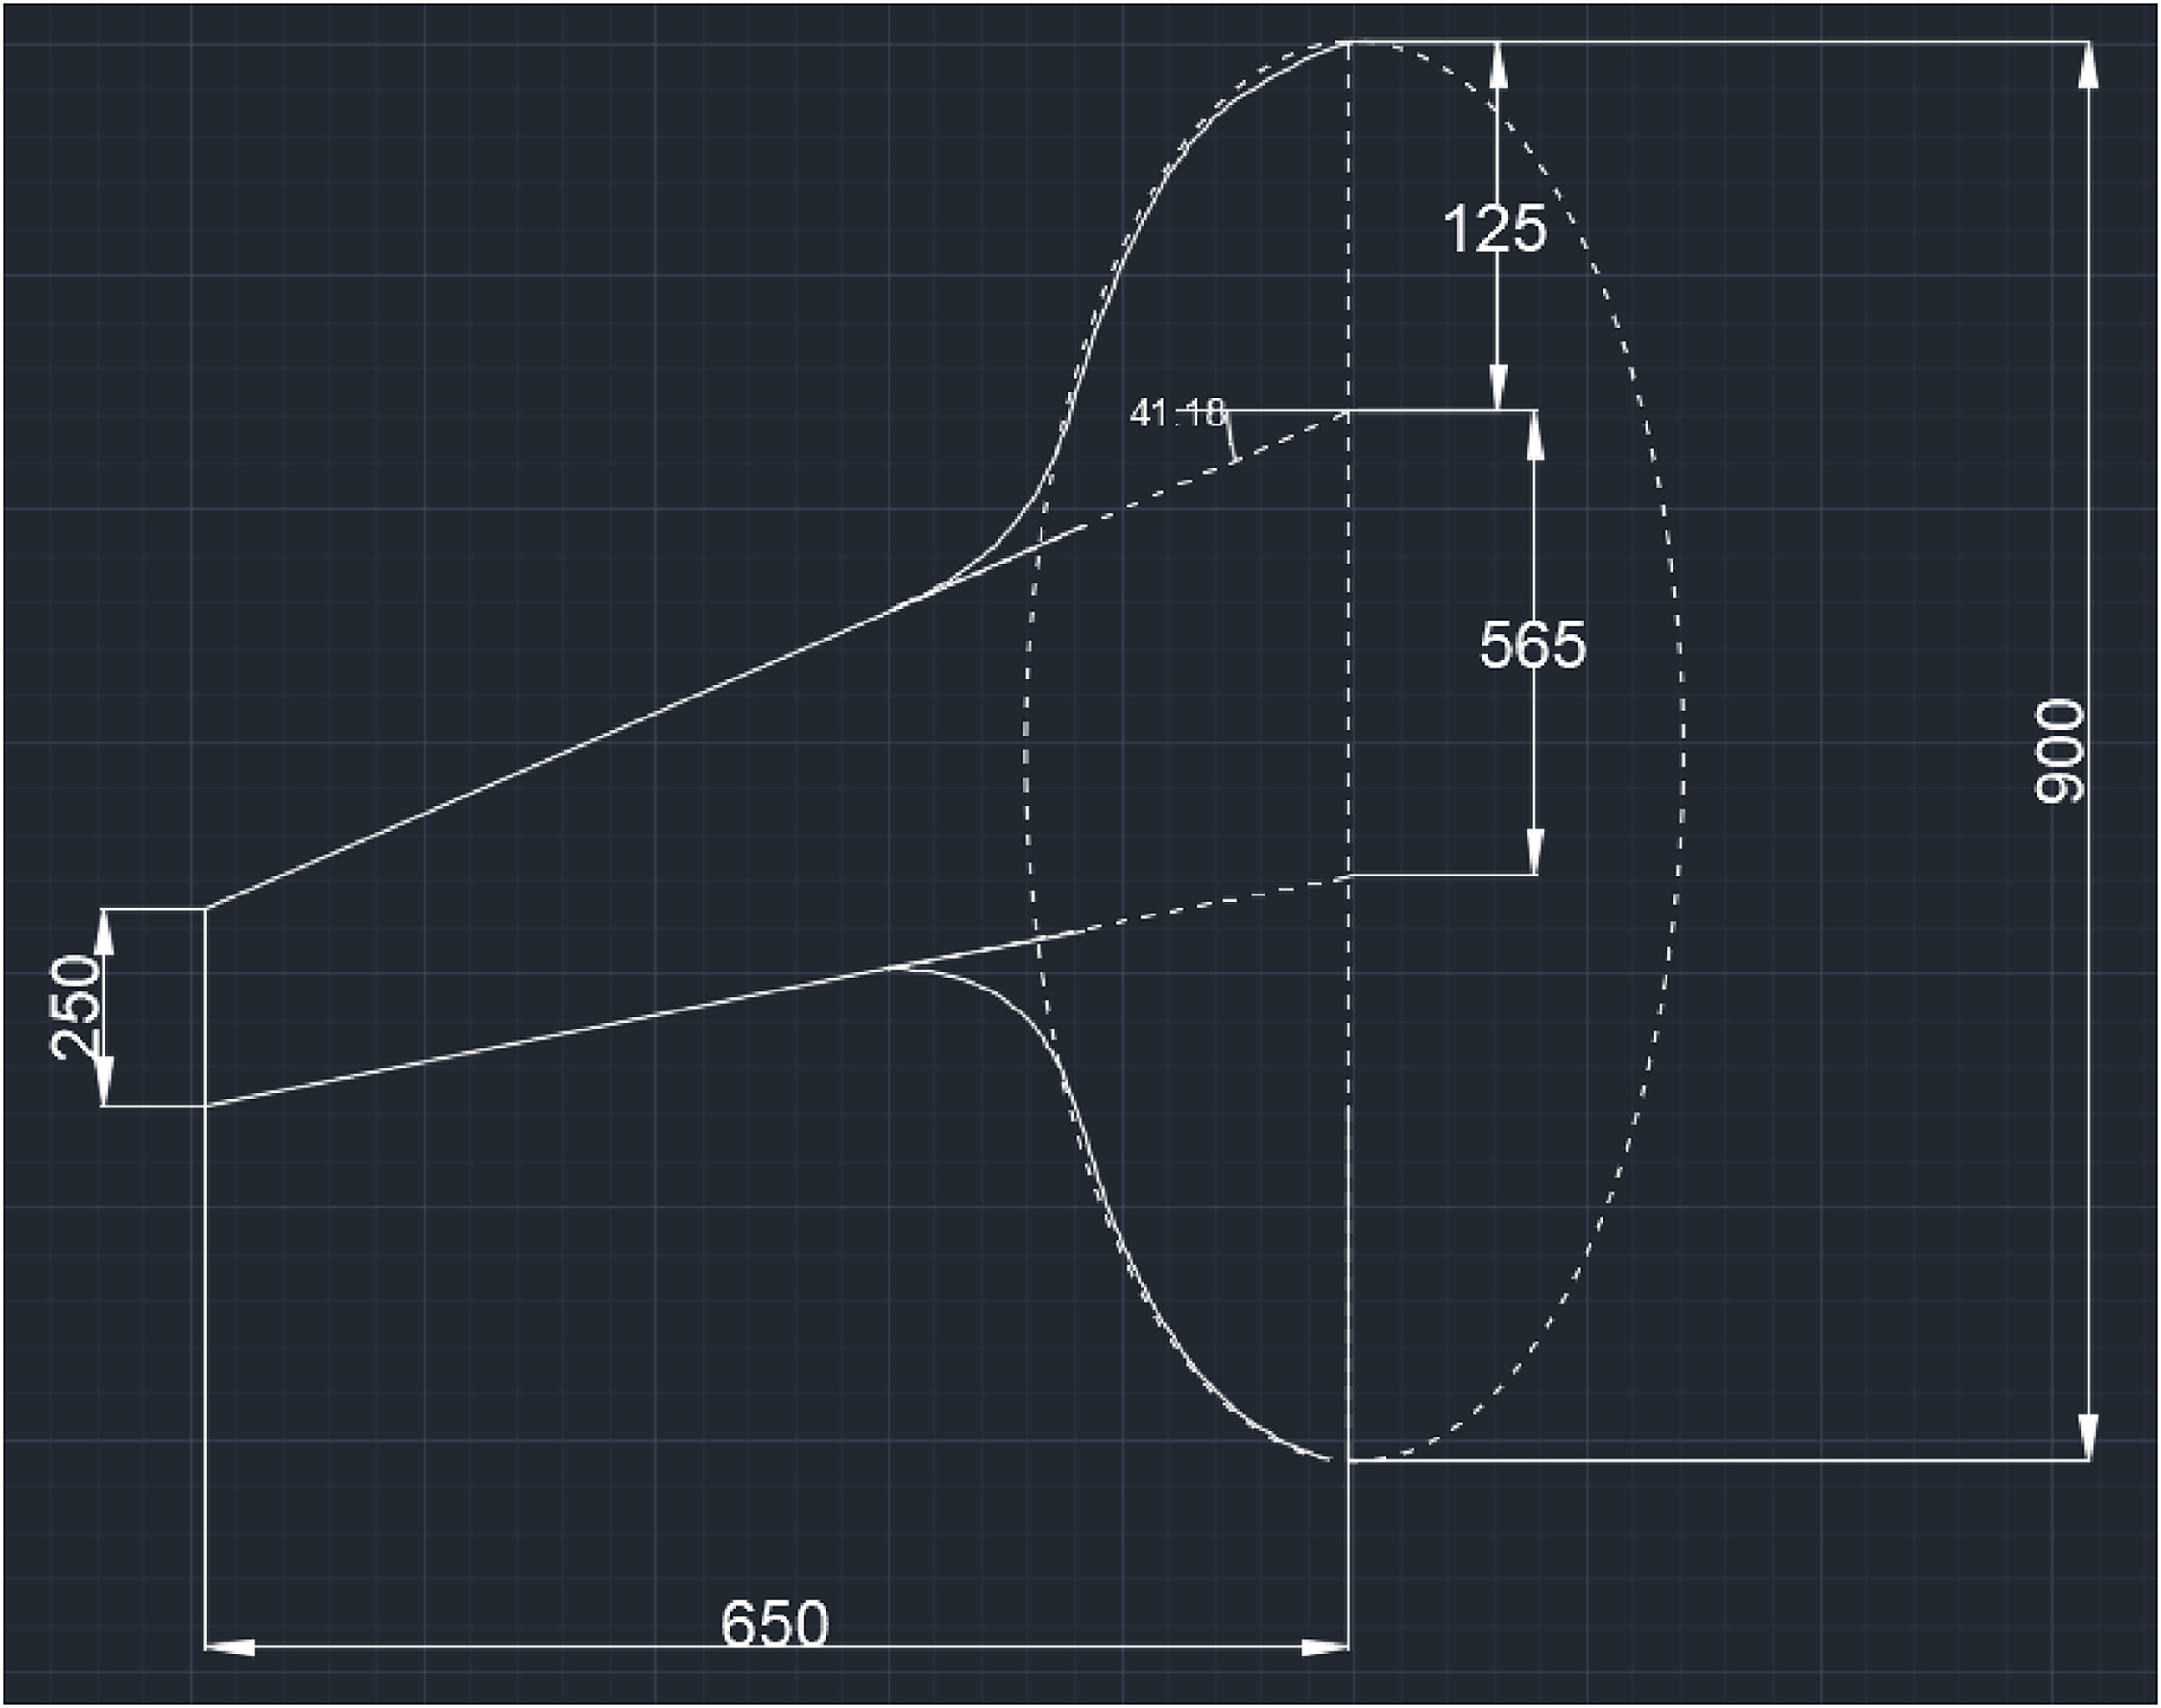
Considering the actual situation and the actual experimental conditions, the overall design of the main body shape is as follows:
The main body dimensions of the glider in the conceptual design are shown as follows:
The initial cabin volume of the underwater glider is 47 cubic decimeters.
Main body tail design
Under the same conditions, the stall angle of NACA0010 airfoil is larger, which makes the rudder get larger control torque with less drag. Therefore, NACA0010 airfoil is selected to design the tail of underwater glider, which can not only ensure good lift and drag performance, but also provide considerable damping force to overcome the main body shaking of small prototype.
Underwater glider performance optimization method
Analysis and improvement of traditional Hicks-henne algorithm
Firstly, the formula of the traditional Hicks-henne algorithm is as follows:
Where 

The image of the basis function of the traditional function is shown in Figure 5, where the value of

NACA0024 profile.

Outline of underwater glider.
Main dimensions of underwater glider.

Three dimensional shape of tail. (a) Tail side view. (b) Tail looking down.

Traditional Hicks-henne basis functions.
From the observation of the traditional shape function, it can be seen that the function values of the traditional shape function at the trailing edge are all 0, which means that if the improved method of the traditional shape function is used, the improved airfoil and the initial airfoil are almost not improved and modified at the trailing edge. The tail is the main part that affects the hydrodynamic performance of airfoil. The main idea to improve the traditional Hicks-henne algorithm is to increase the tail adjustment function, which makes the optimization space larger and easier to find the optimal solution.
Firstly, according to the analysis of the shortcomings of the traditional optimization algorithm, a trailing edge control basis function is added to the Hicks-henne algorithm as follows:

Image of trailing edge control function.
Flow chart of genetic optimization algorithm.

Profile of airfoil before and after improvement.
It can be seen from the figure that by changing the parameter b, the average value of the basis function in the leading edge and the middle of the airfoil is smaller, while the improvement degree in the trailing edge is larger, which can more effectively make up for the shortcomings of Hicks-henne algorithm in the trailing edge.
However, using the improved Hicks-henne algorithm in the actual optimization, it is found that the description of the tail root is limited to the precision of the designed trailing edge control function, and the modification of only one trailing edge control function is not enough to make it get faster improvement. Therefore, by adding a new trailing edge control function 
Where 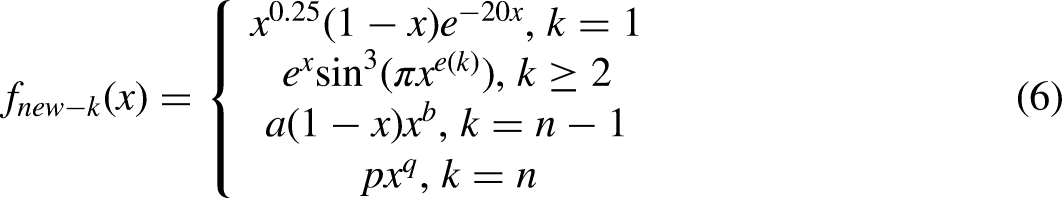

Wing NACA0024 optimization
Firstly, the NACA0024 used in this paper is parameterized. The description formula of NACA0024 digit series is as follows:
Selection of genetic algorithm
First of all, the requirement of high lift drag ratio is to have as little drag as possible and as much lift as possible, Then the choice of objective function is as follows:


Finally, the selection of constraints is based on the actual conditions. The constraints adopted here are as follows:
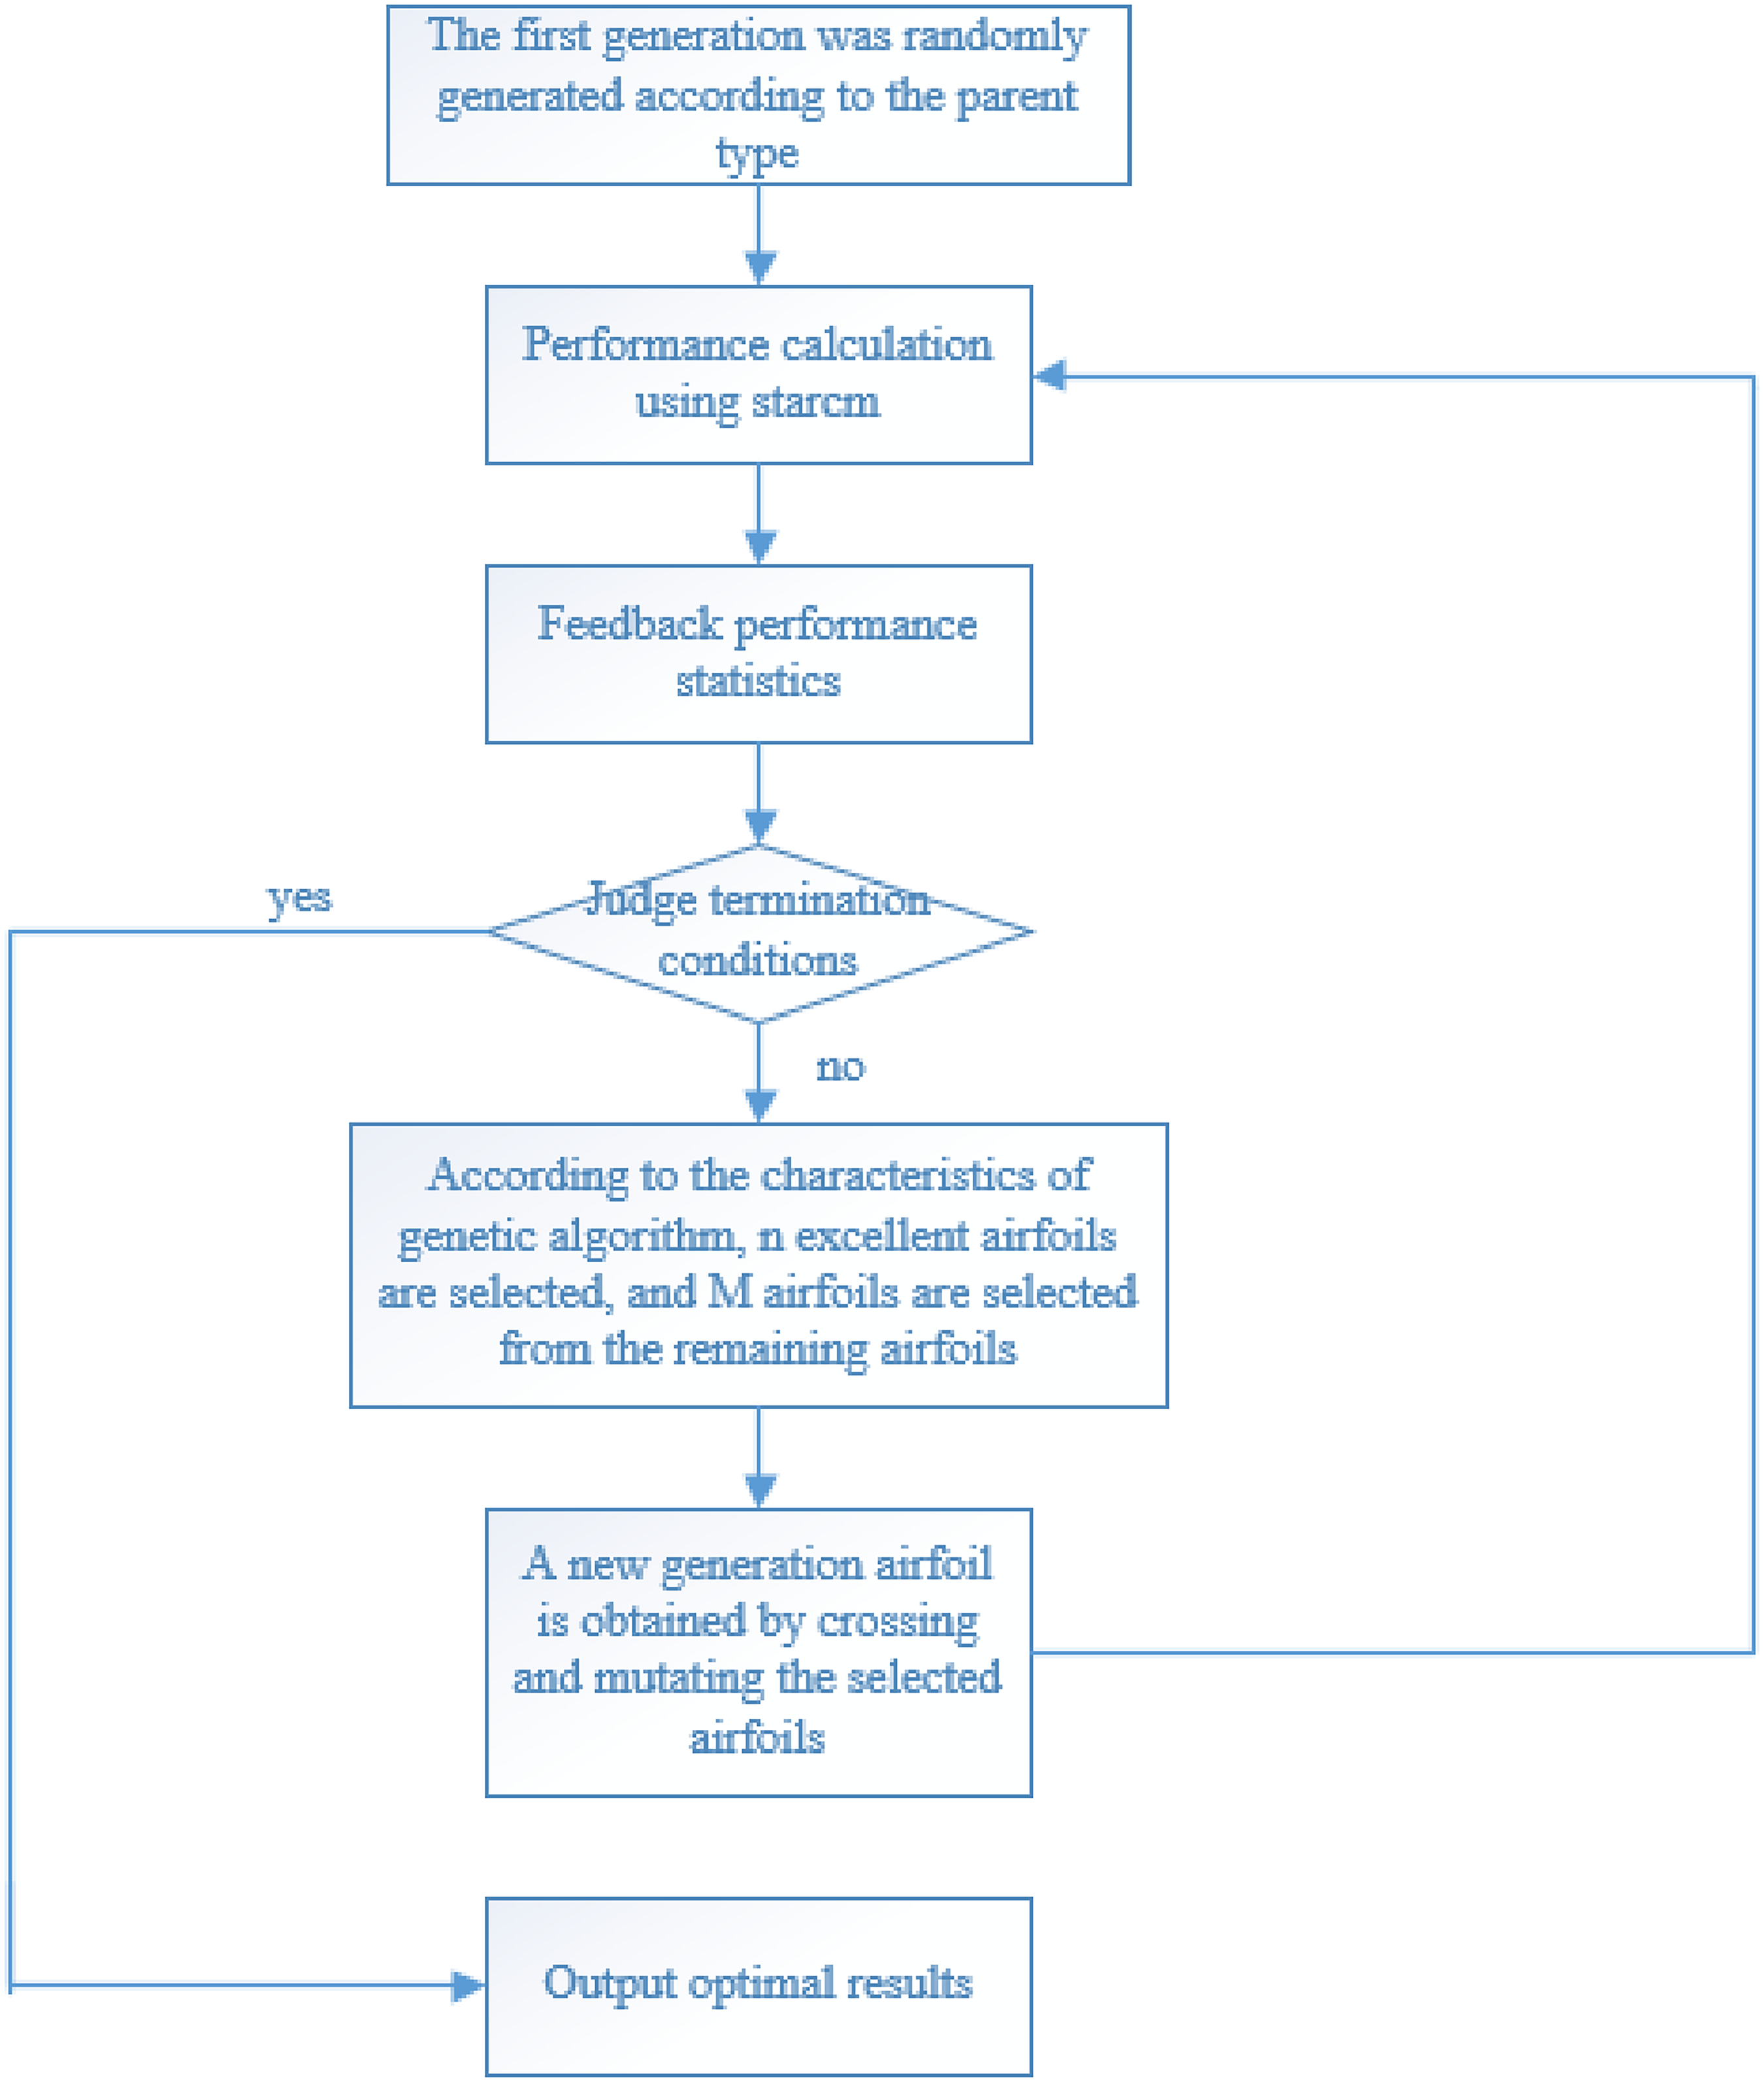
NSGA- II genetic optimization algorithm is used to optimize, The process is as follows:
Firstly, according to the parameter variable 6, considering the calculation speed, the initial population 21 is selected, and considering the calculation efficiency of the server, the evolution algebra is set to 10, the crossover probability is set to 0.8, and the mutation probability is set to 0.1.
Under the condition of 1.0m/s flow rate, the lift coefficient and drag coefficient of the two-dimensional airfoil section are optimized, in which the red line is based on the shape NACA0024, and the blue line is to improve the airfoil section shape through optimization. Here, because the airfoil is symmetrical, only the upper half of the airfoil is given. The performance comparison of lift drag ratio is shown in the table below (Figure 8, Table 3):
It can be seen from the figures and tables that the optimal lift drag ratio performance of the optimized profile is about 4% higher than that of the basic profile.
Parameterization based on plane shape and spanwise thickness
The plane shape is the projection of the underwater glider on the horizontal plane, which expresses the main geometric appearance of the underwater glider. 1
Figure 9 shows the plane shape of the glider. The cross-section shape of the glider can be described by parameterization, just like the optimization of the airfoil cross-section in the previous section. The smooth transition curve from wing to fuselage needs a reasonable way to ensure the performance of glider. The solution adopted in this paper is: smooth transition with cubic Bezier curve.

Plane shape of underwater glider.
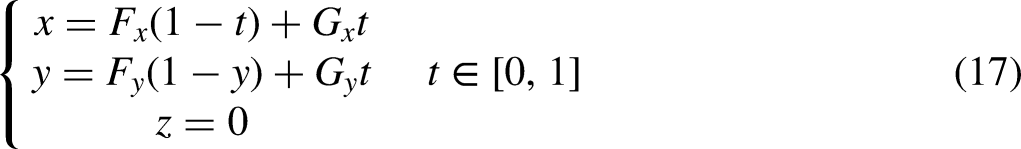
The definition of cubic Bezier curve is defined by the position of four control points. The formula of cubic Bessel curve is as follows:
Firstly, the plane shape and its key features are given:
The main parameters in the figure are defined as follows:
Then, according to the parameter values, we can get the coordinate values of the nodes used as follows (Table 4):
According to the coordinate expression of the above points, the parametric expression of the shape can be obtained as follows:
Bessel curve ABCD:


As shown in Figure 10, the relative spanwise thickness distribution of the underwater glider is divided into two sections, where is the position of the main cabin, and its thickness is linear distribution, and its relative thickness decreases linearly from the maximum value 
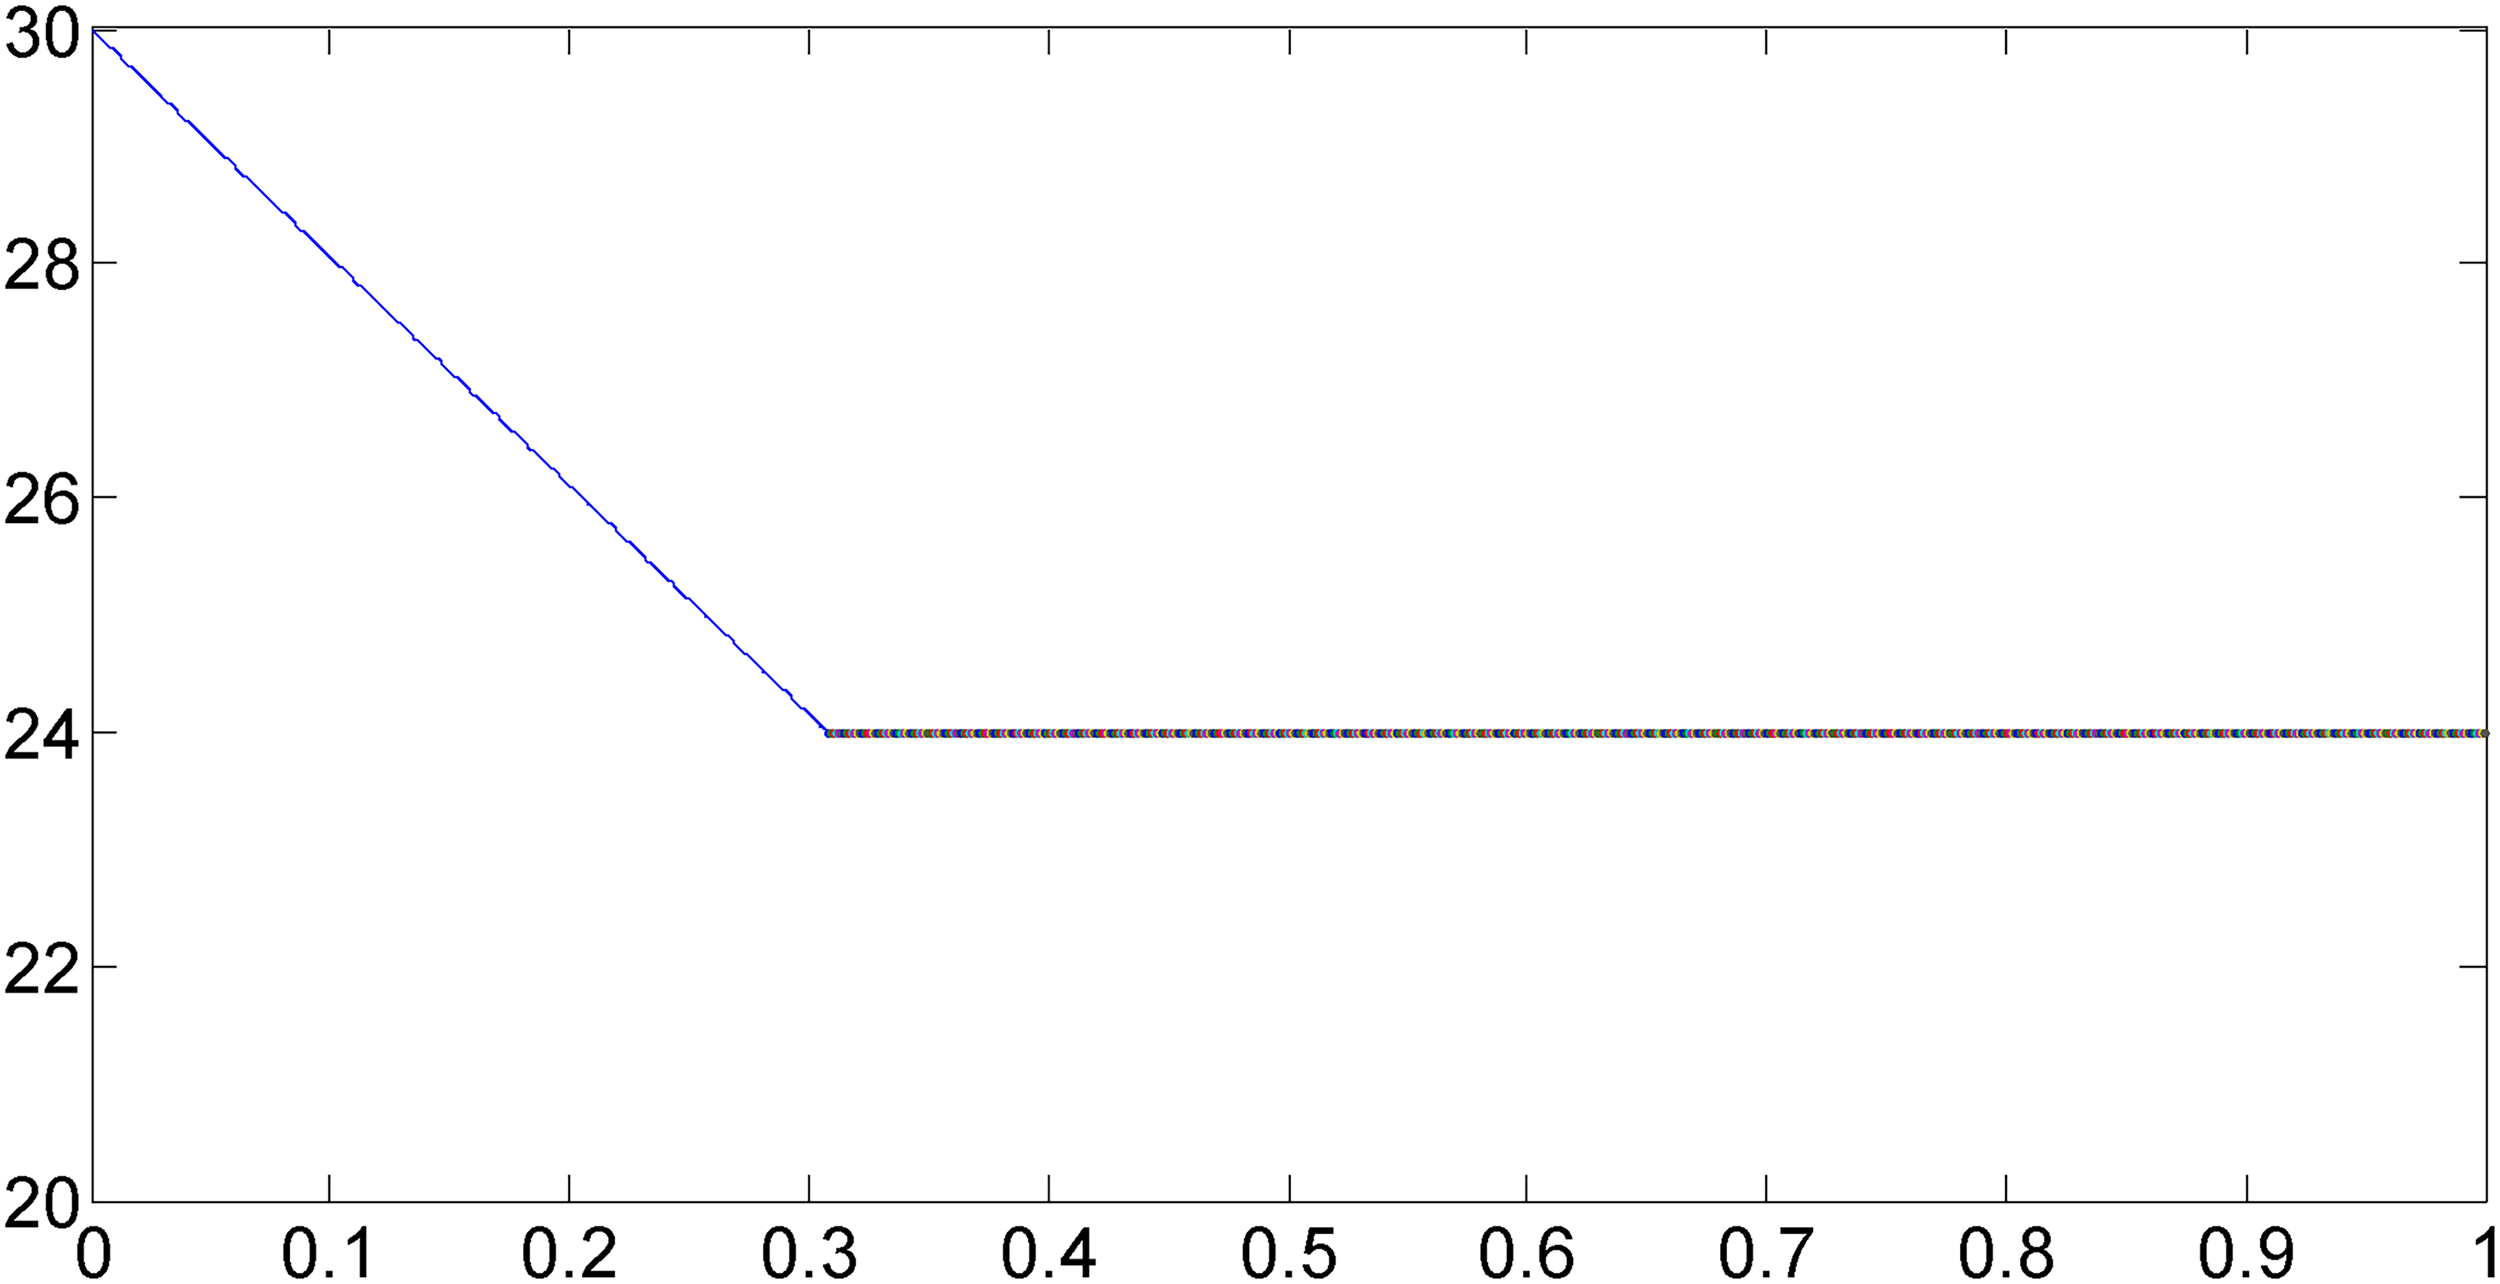
Relative spanwise thickness of underwater glider.
Where
First of all, before the optimization of the shape, it is necessary to unify the whole unit to reduce the possible trouble in the subsequent optimization process.
Therefore, in this paper, the above shape parameters are unified dimensionless, as shown in Table 5.
Design objective and performance index.

Comparison of lift drag ratio performance of airfoil before and after optimization.

Coordinate representation of main parameter points.

Dimensionless parameters of underwater glider.

Overall profile optimization
After the whole is parameterized, it can be optimized as a whole. Considering that this paper is based on the design of the actual project, there will be more actual size restrictions and actual requirements, so the selection of design variables and the determination of limiting conditions are carried out here.
In this paper, the multi-objective genetic algorithm NSGA - II, which is used in airfoil section optimization, is still used for the overall profile optimization
The comparison between the optimized shape and the basic shape is as follows:
The blue part is the optimized glider shape. It can be found from Figure 11 that compared with the basic shape, the optimized fuselage chord length increases, and the integration degree of wing and fuselage is smoother. The optimized design has a flatter shape and a higher degree of integration between fuselage and wing.

Outline comparison. (a) Plane contrast. (b) Comparison of spanwise thickness.

Mesh generation of SUBOFF model.
The final cabin volume of the underwater glider is 41.5 cubic decimeters.
Comparison of hydrodynamic performance of glider before and after shape optimization
Validation of numerical method
In this paper, starccm is used for numerical analysis of the model. Firstly, the effectiveness of the numerical analysis needs to be verified. The effectiveness of the numerical method is verified by using the SUBOFF model with detailed data and experimental data.17–19
According to the experimental data of SUBOFF, the SUBOFF model with full appendage is adopted, and four working conditions are adopted to carry out the numerical analysis with the speed of 5.93 knots, 10 knots, 13.92 knots and 16.0 knots at 0 degree angle of attack.
The grid appearance and model are shown in the Figure 12:
The results are as follows (Table 7):
Through the above data comparison, we can see that the experimental data and the calculated data are in good agreement, the error is about 2%, which effectively proves the effectiveness of the numerical calculation method used in this paper.
Model selection and mesh generation method of underwater glider
The main parameters of the underwater glider are as follows:
Taking the underwater glider as the research object, the numerical calculation model of the underwater glider is established by using the three-dimensional modeling software. The y-axis is the intersection line of the middle longitudinal section and the transverse longitudinal section, which points to the head of the underwater glider; the x-axis points to the left of the glider body, which is positive; the z-axis is positive. The basic dimensions of the underwater glider designed in this paper are shown in Table 8. The numerical model is shown in Figure 13:

Numerical model.
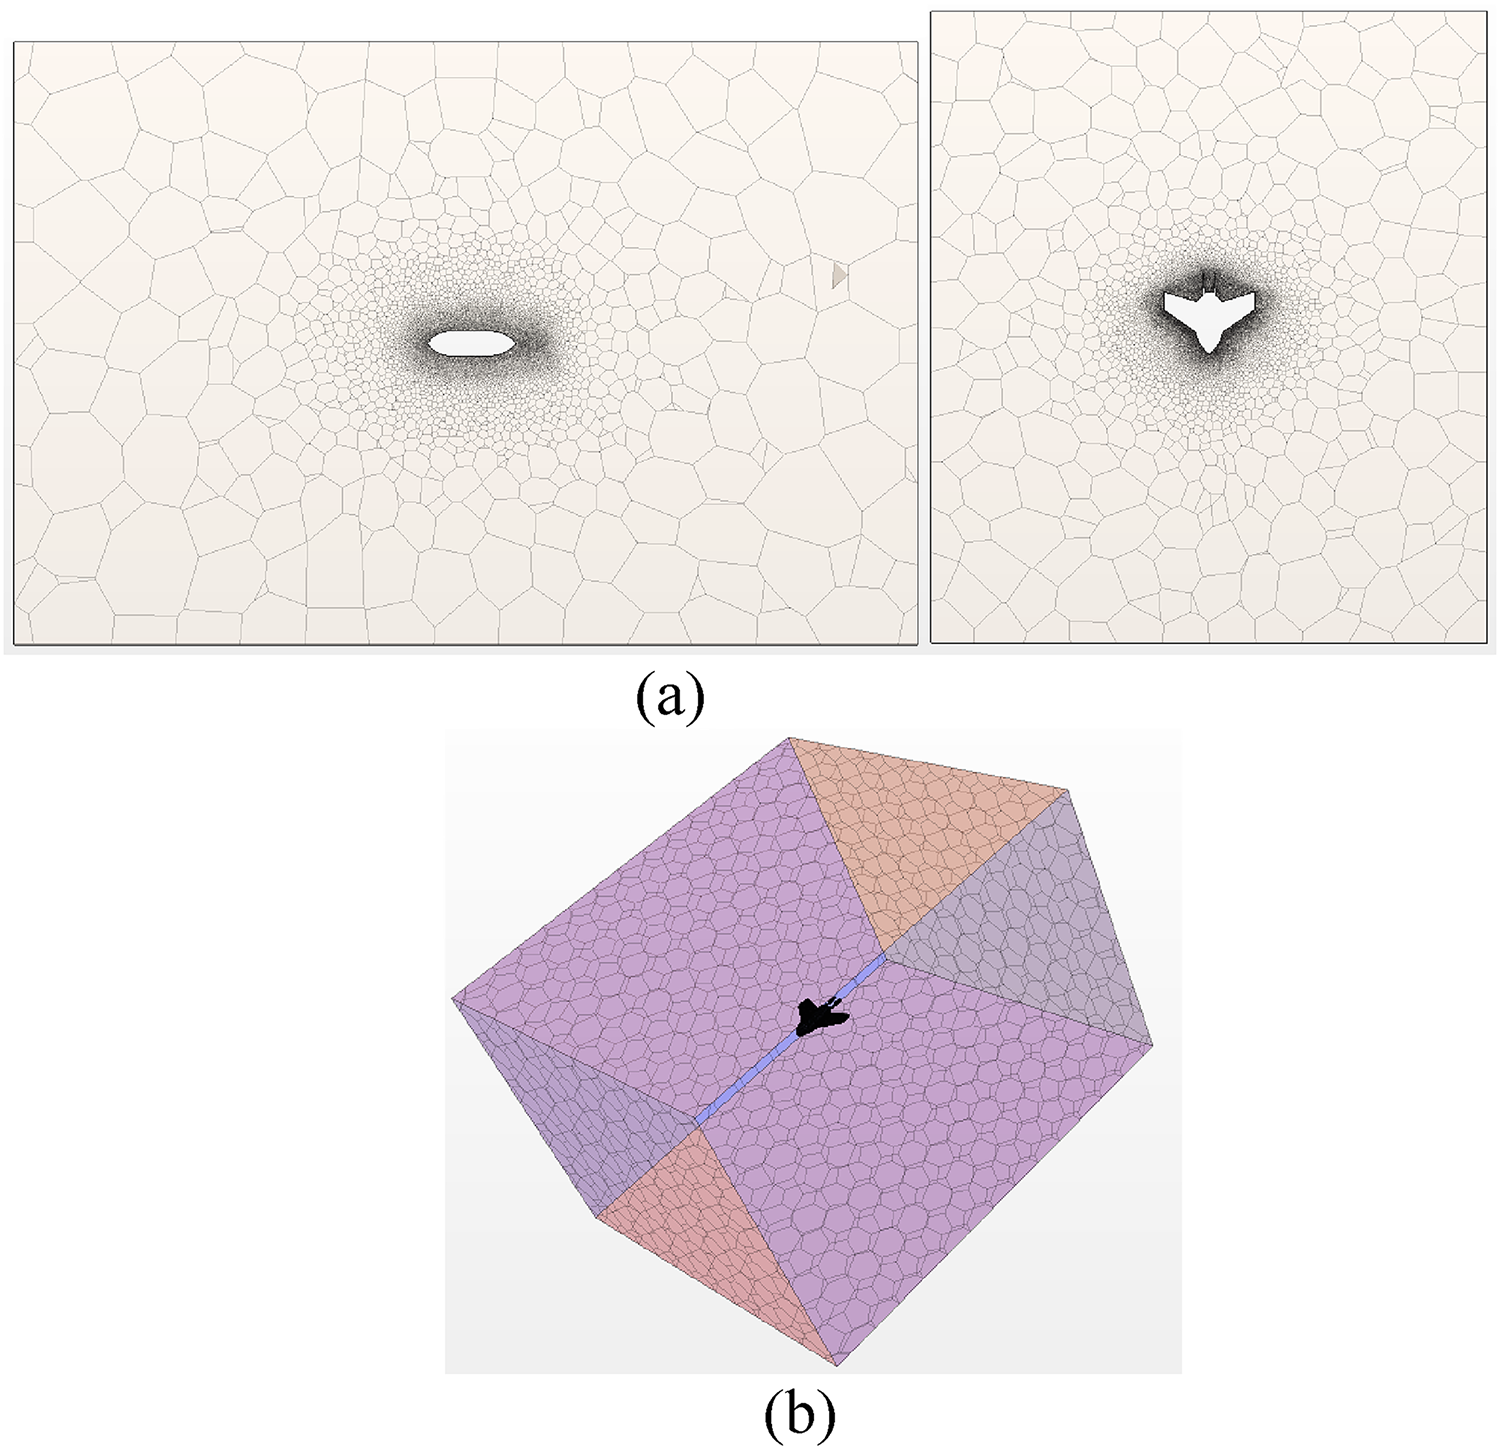
Grid generation. (a) Section grid observation. (b) Overall grid generation.
Optimization design variables and limiting conditions.

Comparison of SUBOFF numerical calculation and actual data.

Basic parameters of underwater glider.

Grid convergence data are as follows.

First of all, in order to ensure a large computing space, the cuboid with outer domain size of 9m·8m·6m is used for fluid computing, and the inner domain size of 2m·1.8m·1m is encrypted. In order to ensure the accuracy of the calculation, the polyhedral unstructured grid is adopted, following the principle of overall unstructured and local encryption. The whole grid is 1.2 million. The figure below shows the mesh refinement and overall mesh generation of the glider through the plane section (Figure 14).
Verification of grid convergence
In order to ensure the accuracy of numerical calculation, three different sets of grids are used to verify the convergence of grid independence. According to the hydrodynamic model of glider, three kinds of grids with different degrees of refinement are prepared. The performance of several grids is calculated, and the numerical comparison is carried out under the working condition of 6 degrees of attack and 1 m/s speed. The CPU is E5-2603v2, the single core processing frequency is 1.8GHz, the total number of cores is 8, and the memory is 32G. The results are as follows (Table 9):
It can be seen that when the number of grids reaches 1.2 million, the calculation results of underwater glider have converged and the error is less than 2%, indicating that the influence of the number of grids on the results can be ignored. In order to ensure the efficiency of calculation and save the cost of calculation, this paper uses 120W grid as the subsequent numerical calculation grid.
Selection of optimal angle of attack for glider
In order to ensure the efficiency of the underwater glider, it is necessary to calculate the overall optimal angle of attack. The performance of underwater glider under different working conditions is studied, and then the variation law of each parameter is studied. When calculating the optimal angle of attack, the calculation angle range is determined first. The design angle of attack of underwater glider is from 0 ° to 10° in order to ensure the accuracy of calculation and reduce the error reasonably, this paper selects 0 °, ±2°, ±4°, ±6°, ±8° and ±10° as the calculation parameters.
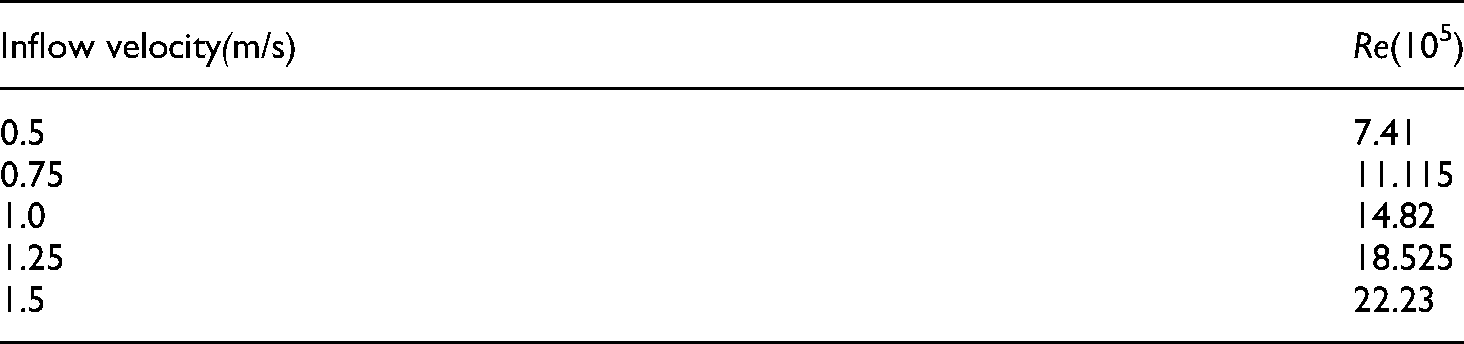
The design speed of underwater glider is 1m/s. In order to understand the relationship between different boundary layers and the overall characteristics of underwater glider, the velocities of four different boundary layers are selected as the calculation speed. It is generally considered that the critical Reynolds number is 5 × 10⁵. When Re < 5 × 10⁵, the outer boundary layer of the shell is laminar. When Re > 2 × 10⁶, it is turbulent boundary layer or mixed boundary layer dominated by turbulent flow. The velocity of incoming flow is shown in Table 10.
Reynolds number calculation of external flow field.
Solution settings
The CFD commercial software Starccm was used to solve the flow field, and the force on the model was obtained. Considering that it is a low-speed wide area water fluid, so the velocity
The boundary conditions of the numerical calculation are as follows: the upper, lower, front and rear boundaries are set according to the working conditions, the specified velocity inlet or pressure outlet is selected, the left and right boundaries are symmetrical plane boundaries, and the uniform flow field is taken as the initial condition of the numerical calculation. In the steady calculation process, the fluid parameters are set as 15°C seawater, the density is 997kg/m3, and the dynamic viscosity coefficient is 0.0009pa · s.
Calculation results and analysis
In this section, through the comparative analysis of the numerical data under different conditions, the performance improvement degree of the hydrodynamic shape before and after optimization is analyzed in detail.
As shown in Tables 11 and 12, the hydrodynamic performance data of the glider before and after optimization at the flow rate of 1.0m/s are shown:
Calculation results of various coefficients at the speed of 1m/s.

Calculation results of various coefficients at the speed of 1m/s.

Relevant parameters of planar motion mechanism.

Lift resistance data with water velocity of 0.3m/s.

Lift resistance data with water velocity of 0.5m/s.

As shown in Figure 15, the performance comparison diagram of the underwater glider before and after the optimization of this working condition.

Performance comparison before and after optimization. (a) Resistance comparison chart. (b) Lift comparison chart. (c) Pitching moment comparison diagram. (d) Comparison chart of lift drag ratio.
Model test
Experimental model
The main purpose of this experiment is to verify the accuracy of numerical calculation. Therefore, the optimized glider model is used to design and manufacture the physical shape. According to the experimental requirements, when measuring the hydrodynamic performance of the physical object, the six component balance measuring instrument should be used. There are two straight rods at the upper end of the balance. Then, the three-dimensional modeling should be considered to be processed such as opening to place the straight rod position of the balance. As shown in Figure 16. Because the size is appropriate and the experimental conditions are sufficient, the underwater glider of the actual size can be tested normally in the pool. Considering the simplicity of the experiment, the physical production is directly carried out in the form of 1:1. In the production process, considering that the opening is too small, which may limit the movement of the rod of the balance, the size of the opening is increased. Therefore, the final physical drawing is shown in Figure 17:

Three dimensional modeling of glider.

Physical drawing of underwater glider. (a) Top view of real object. (b) Physical side view. (c) Front view of real object.

Physical drawing of planar motion mechanism.
Selection of experimental environmental conditions and test conditions
Firstly, the circulating water tank used in the experiment is introduced. The size of the steady flow working section of the circulating water tank is 7m, and the flow velocity range is 0.3m/s ∼ 2.0m/s. The circulating water tank can realize the steady flow velocity in the working section. The main control system is vertical small amplitude planar motion mechanism. Its main components are stepper motor, gearbox, eccentric mechanism, photoelectric control device, limit bearing, yaw angle adjusting slide and amplitude adjusting slide. The relevant parameters are as follows (Figure 18, Table 13):
The main test instrument is six component balance, which can output six groups of data in real time. The main range of the balance is ±30N·m.
According to the actual measuring range of the instrument required in the experiment and the actual performance data of the optimized shape in infinite water area, in order to ensure the safety of the measuring range of the balance, two groups of speeds of 0.3m/s and 0.5m/s are selected to measure the lift resistance. At the same time, due to the inappropriate position of the front and rear openings of the model, the balance will easily touch the flange at the front end of the model when measuring the elevation angle. Considering that the model is symmetrical, only the elevation angle is measured. At the same time, in order to ensure the safety of the balance rod, the maximum angle is limited to ensure that the balance rod does not touch the back of the model opening, so the final working condition is 0 ∼ −8 degrees.
Numerical calculation and performance prediction of the model
This is still similar to the previous grid division and encryption method. For the whole, the local encryption method is adopted. Firstly, the water area is designed and calculated to be 7m · 1.5m · 1.7m. Taking the last point of the center line of the main cabin as the origin and the water area of 3m in front and 4m in back, the size of the local encryption area is designed to be 2.2m · 1.7m · 0.6m, and the surface of the underwater glider is further encrypted, and the final total grid number is 136w. The grid diagram is shown in Figure 19.

Overall grid diagram.
According to the actual experimental environment, both sides of the steady velocity part of the circulating pool are wall. Considering that there will be a large pool wall effect between the actual underwater glider and the wall, the wall boundary condition is adopted here. The velocity inlet and pressure outlet are selected for the front and rear surfaces respectively.
According to the selection of the appropriate grid, the calculation of multiple conditions is carried out,the hydrodynamic performance data are as follows (Table 14).
It can be seen from this data that the force on the model is within the range of the balance, which can ensure the safety of the experimental equipment and start the physical test.
Physical experiment
First, it is necessary to adjust the balance before the experiment. Through reasonable placement of foam and ballast, it can ensure that there is no change within two days of suspension in water. Therefore, it is possible to confirm that the floating material and ballast in the model have reached the designated location to ensure the balance of the model, as shown in Figure 20.

Model leveling diagram.
According to the pre specified test conditions, the corresponding experiments are carried out here. Firstly, the glider model is connected with the plane motion mechanism of the main experimental device. After the connection, adjust the output of the pool. First, make it stable at the flow rate of 0.3m/s. The underwater connection diagram of the glider is shown in Figure 21.

Link between top view glider model and planar motion mechanism.
After the flow rate is stable, clear the balance, record the value of 0 degree angle of attack at the moment, and then adjust the angle. To adjust an angle of attack, you need to wait until the data returned by the balance is basically unchanged before recording the data. Here, the balance has been set to return the average value in 20 s, so the data can be recorded directly. Figure 22 shows the side view of the glider at an angle of 8 degrees.
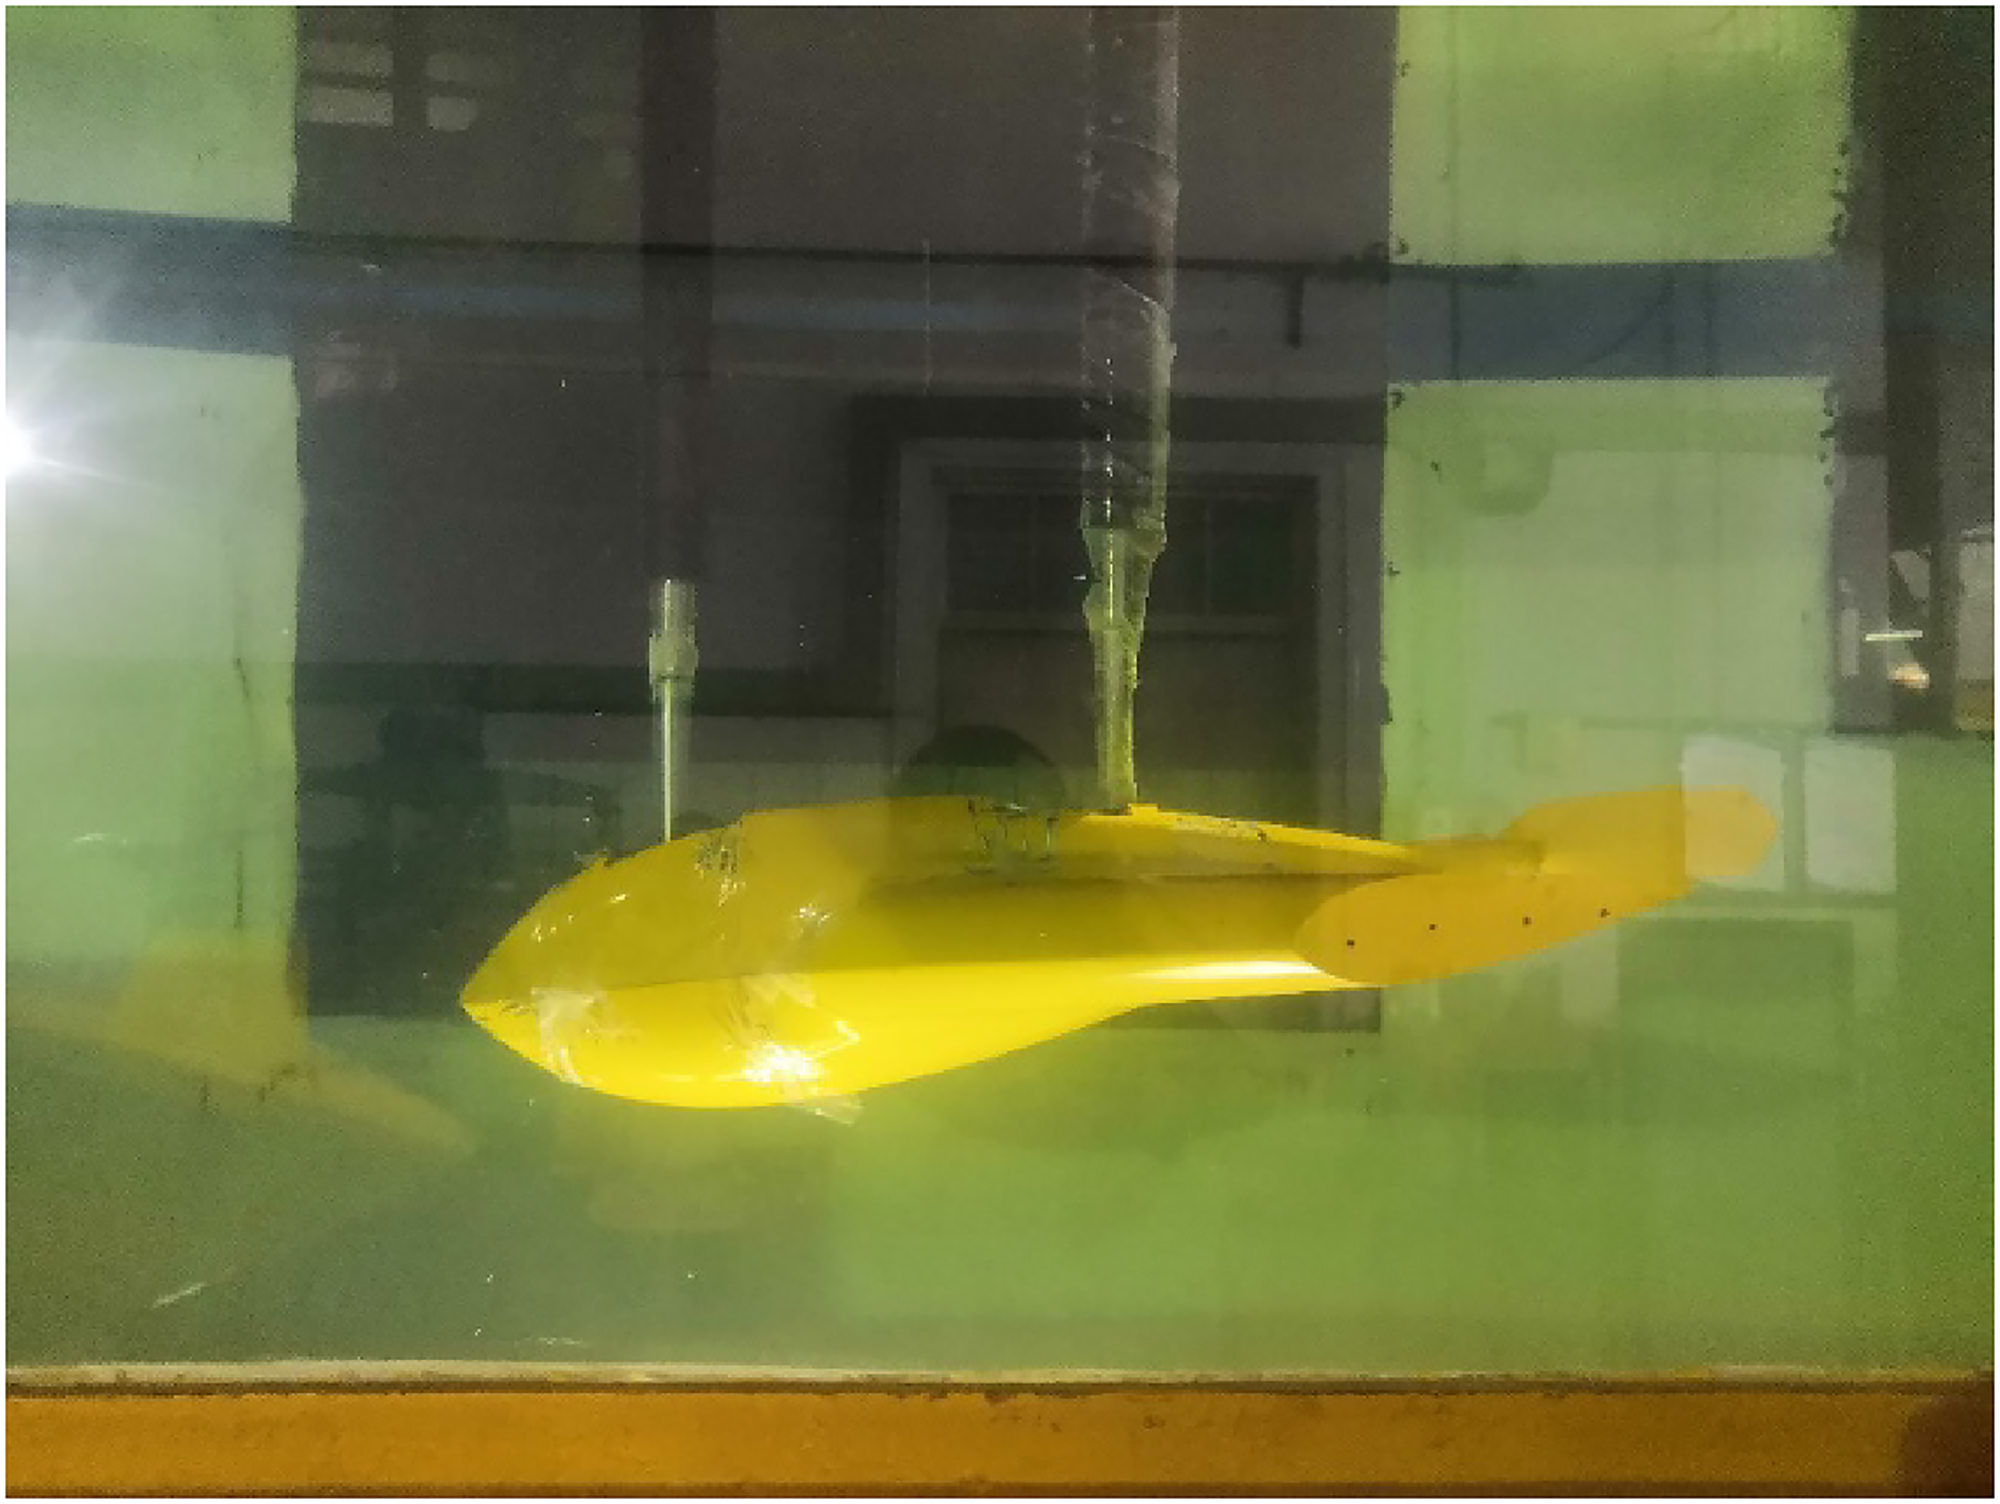
Attitude diagram of underwater glider with 8-degree depression angle.
After recording the multi angle data of 0.3m/s, it is necessary to return the model to the initial zero degree angle of attack state first, and it needs to be zeroed through the planar motion mechanism. Then the flow rate can be adjusted to 0.5m/s, and the data recording process can be repeated after the water speed of the pool is stable.
Through the above experimental process, the whole experiment is completed, and the statistics of the data returned by the experimental balance are as follows. Table 16 is the initial data returned by the balance (Table 17).
Original data of the balance when the water velocity is 0.3m/s.

Original data of the balance when the water velocity is 0.5m/s.
Initial reading of balance.

Lifting resistance of material object with velocity of 0.3m/s.

Lifting resistance of material object with velocity of 0.5m/s.

Data error.

Through the analysis of the above original data, first of all, the data returned by the balance is the data measured with the balance as the coordinate system, so it is not the lift and drag suffered by the glider. Therefore, the data is processed to obtain the lift and drag. The reference conversion formula is as follows:

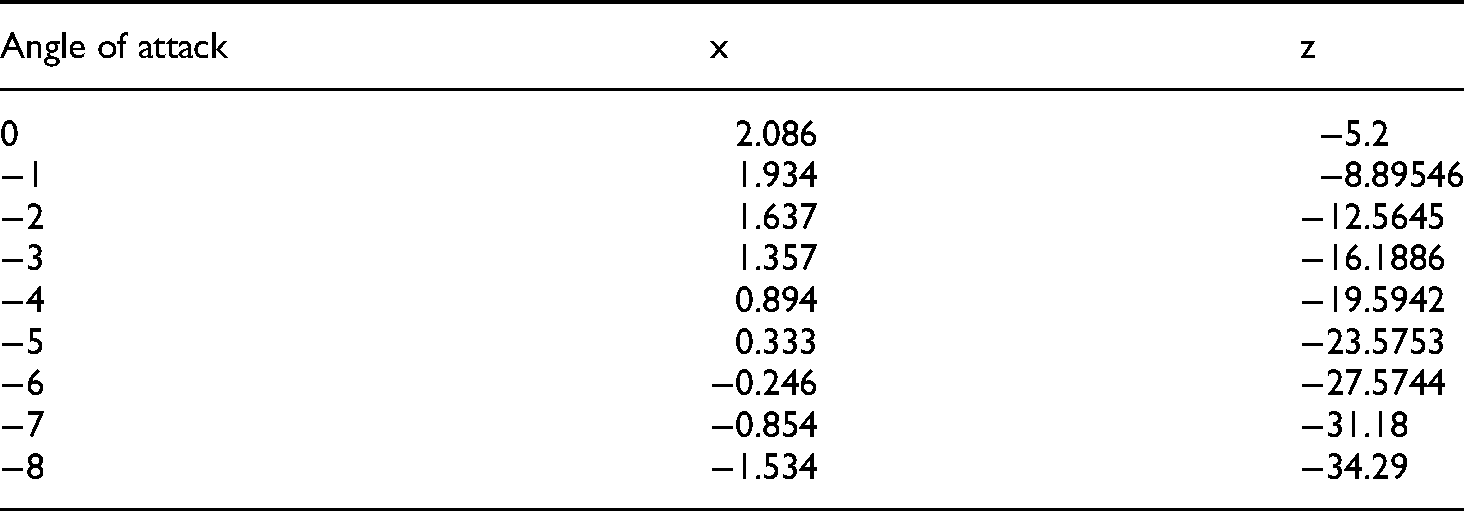
Then the experimental data of lift and drag of the model are obtained as follows (Tables 19, 20):
Data comparison and error analysis
The comparative analysis results of experimental data and numerical calculation are given here, as shown in Figure 23.

Comparison of experimental data and numerical calculation data. (a) 0.3m/s. (b) 0.5m/s. (c) 0.3m/s. (d) 0.5m/s. (c) 0.3m/s. (d) 0.5m/s.
It can be seen from the pictures that the effect of numerical calculation and physical simulation in terms of lift is very close, with high accuracy, while there is a slight gap in terms of resistance. Through the analysis of the two groups of data, the error table can be given as follows (Table 21):
By comparing the actual experimental environment with the water environment selected in the numerical calculation, it can be seen that, first of all, due to the accuracy of the model, the model used in the physical experiment needs to consider the balance placed in its internal space, and needs to open holes on the upper cover to ensure that the data can be transmitted back to the console, so the upper cover of the glider will be opened, and this kind of hole will directly lead to the failure of the glider In order to reduce this effect, the useless part of the hole is filled as much as possible by means of adhesive tape before launching, so as to ensure that the underwater shape is close to the ideal shape used in numerical calculation.
Another big influence is the accuracy of the model. The whole model is divided into two wings, the main cabin, the head and other parts, which are made separately, and connected by glue, screw, slot and other ways. In this way, due to the problem of manufacturing accuracy, the shape will inevitably exist in subtle unsmooth places, such as cliff type gap, and the error of this part will also be wrapped by tape However, there are still some irreparable errors.
Conclusion
The conceptual design of the underwater glider is completed, and the preliminary shape design of the underwater glider is completed. The initial hydrodynamic shape is introduced into the aviation wing body integration layout, which improves the design of the initial hydrodynamic shape.
Through the selection and analysis of the traditional optimization algorithm, the traditional algorithm is improved, and the underwater glider is parameterized in three aspects: airfoil section, plane shape and spanwise thickness. The improved Hicks-Henne algorithm is used to optimize the airfoil section, and the airfoil profile with better performance is obtained. On this basis, NSGA - II genetic algorithm is used to optimize the overall shape of the underwater glider.
The optimal angle of attack of the basic shape underwater glider in glide mode is 8 degrees. At this angle of attack, the best hydrodynamic performance can be obtained. The optimal lift to drag ratio of basic shape underwater glider is 12, and the optimal lift to drag ratio of basic shape underwater glider is 11.88. After optimization, the optimal lift drag ratio is increased by about 14%, and the optimal angle of attack is changed to 6°
The hydrodynamic performance experiment of the optimized underwater glider is carried out. The lift and drag of the model are measured through the physical experiment. Through the comparison of the actual data and the numerical simulation data, as well as the analysis of the essential error in the experiment, the accuracy of the numerical calculation of the model is effectively proved, and the effectiveness of the optimization algorithm used in this paper is also strongly verified.
Footnotes
Acknowledgements
This work was financially supported by the National Natural Science Foundation of China (Grant No. 51909040), Natural Science Foundation of Heilongjiang Province (Grant No. LH2020E073) and the Key Technology Research and Development Program of Shandong (Grant No. 2020CXGC010702).
Declaration of conflicting interests
The author(s) declared no potential conflicts of interest with respect to the research, authorship, and/or publication of this article.
Funding
The author(s) disclosed receipt of the following financial support for the research, authorship, and/or publication of this article: This work was supported by the National Natural Science Foundation of China, Natural Science Foundation of Heilongjiang Province, the Key Technology Research and Development Program of Shandong, (grant number 51909040, LH2020E073, 2020CXGC010702).
Author biographies
Hongde Qin is the director of the National Key Laboratory of Science and Technology on Autonomous Underwater Vehicle, Harbin Engineering University. He obtained a PhD in Shipbuilding and Ocean Engineering from the Harbin Engineering University. His research interests include tracking control of autonomous underwater vehicle systems and hydrodynamics of aquaculture structures.
Lingyu Li earned his Msc in Shipbuilding and Ocean Engineering from the Harbin Engineering University. His research focuses on performance and optimization of underwater glider, with regards to numerical implementations and physical model tests.
Peng Li is an associate professor of the College of Shipbuilding Engineering at the Harbin Engineering University. He obtained his PhD in Ocean Engineering from Norwegian University of Science and Technology. His research focuses on hydrodynamic response of open offshore aquaculture structures, with both analytical and experimental approaches.
Xiangqian Wang earned his Msc in Shipbuilding and Ocean Engineering from the Harbin Engineering University. His research focuses on hydrodynamic simulation research.