
Abstract
The accurate identification of dynamic change of limb length discrepancy (LLD) in non-clinical settings is of great significance for monitoring gait function change in people's everyday lives. How to search for advanced techniques to measure LLD changes in non-clinical settings has always been a challenging endeavor in recent related research. In this study, we have proposed a novel approach to accurately measure the dynamic change of LLD outdoors by using deep learning and wearable sensors. The basic idea is that the measurement of dynamic change of LLD was considered as a multiple gait classification task based on LLD change that is clearly associated with its gait pattern. A hybrid deep learning model of convolutional neural network and long short-term memory (CNN-LSTM) was developed to precisely classify LLD gait patterns by discovering the most representative spatial-temporal LLD dynamic change features. Twenty-three healthy subjects were recruited to simulate four levels of LLD by wearing a shoe lift with different heights. The Delsys TrignoTM system was implemented to simultaneously acquire gait data from six sensors positioned on the hip, knee and ankle joint of two lower limbs respectively. The experimental results showed that the developed CNN-LSTM model could reach a higher accuracy of 93.24% and F1-score of 93.48% to classify four different LLD gait patterns when compared with CNN, LSTM, and CNN-gated recurrent unit(CNN-GRU), and gain better recall and precision (more than 92%) to detect each LLD gait pattern accurately. Our model could achieve excellent learning ability to discover the most representative LLD dynamic change features for classifying LLD gait patterns accurately. Our technical solution would help not only to accurately measure LLD dynamic change in non-clinical settings, but also to potentially find out lower limb joints with more abnormal compensatory change caused by LLD.
Keywords
Introduction
Leg length discrepancy (LLD) is known as a condition with leg length inequality. 1 The unequal length of paired limbs is anatomically defined as the difference between left and right limb lengths from femurs to tibias. 2 LLD is commonly considered an anatomical LLD and functional LLD. 3 The former is caused by structural deformity associated with the shortening of bony length in the lower limb, and the latter is caused by functional deformity related to abnormal motion of joints (such as hip, knee, and ankle) in the lower extremity. Clinically, LLD has been considered a pathological condition correlated with pelvic drop, gait deviation, and alteration of lower limb biomechanics.2,4 This may lead to low back pain,5,6 chronic pain in lower limb joints and gait abnormality. 7 Especially, the LLD with severity level could also cause lower limb symptoms diseases such as gonarthrosis and coxarthrosis.3,8–10
Therefore, it is very crucial to measure LLD with the different levels in diagnosis and treatment of diseases caused by LLD. This greatly contributes to improving the life quality of patients with LLD.
How to quantitatively measure LLD with the best accuracy and reliability has been a challenging issue in biomechanics and gait analysis. 11 Many studies have mainly focused on searching for effective methods to measure LLD despite there exists controversy regarding some measurement and treatment protocols between researchers and clinicians. 12 The published methods of measuring LLD mainly included clinical methods and radiographic image techniques. 1 In these methods, an important step is to determine the true limb length. The clinical methods mainly consisted of the direct method and the indirect method. 12 The direct clinical method mainly uses the calibrated tape to measure the distance between two anatomical points (such as the anterior superior iliac spine and the medial malleolus) in each limb while patients are asked to lie in a supine position. 13 On the other hand, the indirect clinical method is a pelvis level measure where blocks with a known height were placed under the short limb to level the pelvis while patients are kept in a standing position. 14 Although both methods could easily measure LLD, their accuracy, validity, and reliability were poor.15–17
Meanwhile, some related investigations have also focused on utilizing various radiographic imaging technologies to assess LLD.18–20 The basic idea is to take advantage of radiograph-based technology to accurately localize the anatomical landmarks from radiographs of the full-length lower limbs. This may benefit in measuring LLD with better accuracy and reliability. The radiographic technologies mainly included computerized tomography (CT), digital radiograghy (DR), and magnetic resonance imaging (MRI).18,19 For example, Zheng et al. 20 proposed an effective radiograph-based method to measure LLD. Andy Tsai et al. 21 developed a CNN model to localize anatomical landmarks based on lower limb radiographs, which might automatically predict LLD and bone length. Although the radiograph-based image techniques could measure LLD with superior accuracy, reliability, and validation, there exist some limitations, such as radiation exposure, expensive equipment, time-consuming, high medical cost, and requirement of special facilities.11,22 Especially, it is very difficult to adopt the imaging technique for real-time monitoring of LLD in non-clinical settings such as at home or outdoors.
Recently, the emerging wearable sensors and deep learning models have been widely applied in various study fields, such as sports science and construction.23,24 For instance, the deep learning model could be developed to improve athletes’ training conditions and effects by analyzing the wearable sensor data. 23 In addition, deep learning models and wearable sensors were also used to monitor workers’ health and safety in real-time in the construction environment. 24 Especially, with the popularity of wearable sensors in gait analysis, 23 some recent studies have also attempted to search for wearable sensors-based methods to measure LLD in the non-clinical environment. 24 These investigations mainly involved two aspects: (1) acquiring anatomical point data by wearing sensors that were located on proper anatomical parts on limbs, and (2) searching for an effective technique that can determine the leg length based on the acquired data. Sajeewani et al. 25 have proposed an entropy-based method to measure LLD using wearable sensors. In their work, two sensors were positioned near the elbow and wrist on the left arm respectively, while another two were located close to the hip and knee on the right lower-extremity respectively. Limb length can be estimated based on the trajectory curvature of four sensors while the arm and leg were down and lifting respectively. Although numerous recent researches have made promising progress, they have ignored some problems that need to be solved. As we know, human gait requires complementary limb locomotion that is controlled by the central nervous system, and the coupling action between multiple joints based on the kinetic chain. The abnormal complementary and coupling action in limb locomotion may be associated with the functional deformity caused by LLD. Unfortunately, most relevant studies only considered the skeletal deformity to determine true bone or leg length, and do not take into account the functional deformity (abnormal motion of hip, knee, and ankle) in the measurement of LLD. 26 Especially, no recent studies have focused on measuring the dynamic change of LLD in non-clinical settings. Therefore, it is necessary to search for novel technical solutions to solve these problems.
The objective of the present study is to find a novel measurement approach to the dynamic change of LLD by using deep learning and wearable sensors. To achieve this objective, a novel hybrid deep learning model with high-generalization was needed to be constructed for accurately measuring the different levels of LLD. In this study, measuring LLD with different levels was considered a multiple-gaits classification task. That is, the deep learning-based gait classification model with the best generalization was developed to identify LLD gait patterns with different levels accurately. In order to examine the feasibility of our method, 23 normal participants were recruited. The different levels of LLD, such as mild, moderate, and severe levels, were simulated by wearing a shoe lift with heights of 30 mm, 45 mm, and 60 mm in the affected lower limb respectively. The gait data of the mimic LLD with four different levels was acquired by using six sensors that were positioned on hip, knee and ankle of two lower limbs respectively. The gait patterns of LLD with different levels are defined based on the multi-sensor data collected. In view of the spatiotemporal characteristic in gait, a hybrid deep learning model of CNN and LSTM was developed for accurately classifying gait patterns of LLD with four different levels. The experimental results have shown that the developed CNN-LSTM model could classify four different LLD gait patterns with an accuracy of 93%. The developed CNN-LSTM model could achieve the excellent spatial-temporal gait representation learning capability to precisely discriminate LLD at different levels. The main contributions of this study are presented as follows.
The present study provided a new technical solution that could evaluate the effect of limb complement and coupling across joints in gait abnormality on the different levels of LLD in the non-clinical setting by using deep learning and wearable sensors. The developed hybrid learning model of CNN and LSTM has the best generalization capability to feasibly exploit the most representative spatial-temporal LLD gait dynamic characteristics from multi-sensor data. This greatly contributed to classifying the different levels of LLD with higher accuracy. The proposed model could achieve the excellent learning ability to find a specific lower limb joint with abnormality caused by LLD. This could gain a deeper insight into the effect of the abnormal compensation of specific joints on LLD.
Materials and methods
Acquisition of multi-sensor data of LLD gait.
Participants
In this study, 23 healthy subjects were recruited from Fujian Normal University. All recruited participants included 6 females and 17 males. Their mean age(mean ± std): 26 ± 8 years, mean height: 177 ± 11 cm, and mean weight: 75.2 ± 14.2 kg. All subjects had no known injury or abnormality associated with LLD, such as low back pain, knee and hip osteoarthritis, heel pain, or standing imbalance. Furthermore, they satisfied the Hoppenfeld 27 criteria, such as a normal joint range of motion, no deviation of the long bone axis, no tilt of the pelvis, and a femur symmetry. Each subject agreed with an informed consent approved by the Ethical Ethics Committee of Fujian Normal University.
Design of different LLD patterns
The approach to simulate LLD based on healthy subjects has been widely employed in many relevant studies on LLD. In this study, shoe lifts with different heights were worn to simulate different levels of LLD. In view of the range of 9–60 mm of LLD reported in previous research, three different levels of LLD such as mild(range of 9–30 mm), moderate(range of 30–60 mm), and severe(range of 60–100 mm) were simulated by wearing shoe lifts with different heights, respectively. That is, for each subject, shoe lifts with different heights, such as 30 mm, 45 mm, and 60 mm, as shown in Figure 1, were worn on unilateral heels to simulate mild, moderate, and severe levels of LLD respectively. 28

Illustration of shoe lifts with different heights.
Experimental apparatus
In order to effectively acquire the data that contains the more spatial-temporal dynamic characteristics information about LLD change, three wearable sensors were positioned on the hip, knee, and ankle joints of the right and left lower limbs respectively, as illustrated in Figure 2. The Delsys TrignoTM system (Delsys Inc., Boston, MA, USA) was used to collect multi-sensor data. This system consists of Trigno wireless systems and wireless IMU (Inertial Measurement Unit) sensors. Each sensor was equipped with a triaxial accelerometer, a triaxial gyroscope, and a magnetometer. The acceleration of the accelerometer is up to ±16 g, and the angular velocity of the gyroscope is up to 2000o/s. All sensors were connected to the Delsys Sensor Base via wireless communication. Then Delsys Sensor Base can transfer in real-time each sensor data to a PC via a USB interface. Each sensor data can be synchronously collected by using EMG Works acquisition software from Delsys Inc., Boston, MA, USA. Figure 3 shows the simulated LLD of a healthy subject wearing a shoe lift with 60 mm height and six sensors positioned on the hip, knee and ankle joint of two lower limbs respectively.
Illustration of six sensors positioned on hip, knee and ankle of two lower limbs.

An example of the simulated LLD from a healthy subject wearing a shoe lift and six sensors.
Data acquisition
In this study, in order to effectively evaluate the developed CNN-LSTM model, we collected multi-sensor data of four different LLD gait patterns, including normal walking (no LLD), mild LLD gait pattern, moderate LLD gait pattern, and severe LLD gait pattern. Before data acquisition, each subject was asked to locate six sensors on the hip, knee and ankle joints of two lower limbs, and was given 3 min to be familiar with four different LLD gait patterns during walking. In the data collection process, each subject was asked to walk on a 20 m laboratory walkway at a self-determined walking speed. The multi-sensor data from each LLD gait pattern was recorded for 3 min. After the data collection of each gait pattern was finished, each subject was asked to rest for 2 min. The sampling rate of the accelerometer and gyroscope was set to 144 Hz. Figure 4 illustrates an example of the collected triaxial acceleration data. Figure 5 illustrates an example of gyroscope data from a subject with simulating moderate level of LLD.

Triaxial accelerometer data of a subject with simulating moderate level of LLD.

Triaxial gyroscope data of a subject with a mimic moderate level of LLD.
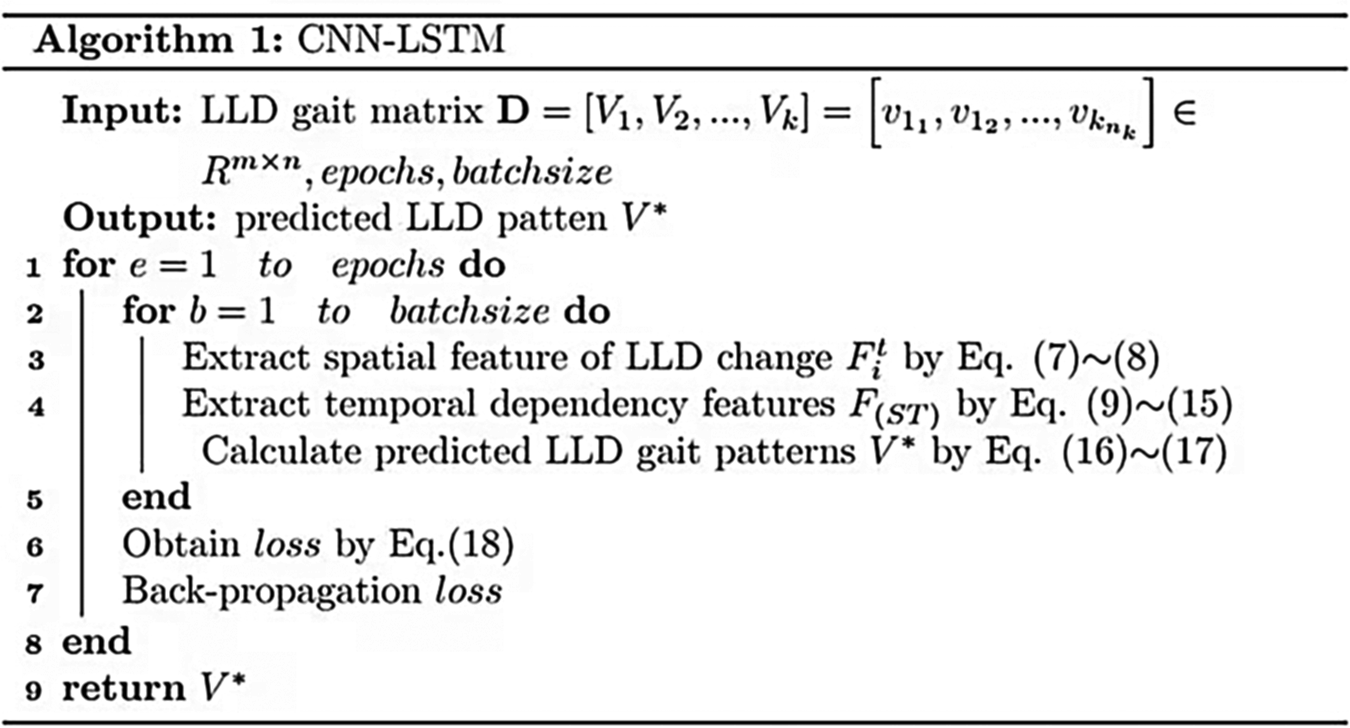
CNN-LSTM for spatial-temporal gait feature extraction
In this study, a hybrid deep learning model of CNN and LSTM (CNN-LSTM) was developed to accurately identify the different levels of LLD by using multi-sensor data. The developed CNN-LSTM model mainly consisted of CNN block, LSTM block, and SoftMax layer, as shown in Figure 6. The CNN block was used to discover the useful spatial LLD change features from multi-sensor data. This block mainly included four convolutional layers, a max pool layer, and a fully connected layer. Here, to avoid overfitting, the max pool layer was added to the second convolutional layer, and a fully connected layer was added to the last convolutional layer. The LSTM block was adopted to exploit the valuable temporal dependency features from the spatial features extracted by the CNN block. Therefore, we could capture the most representative spatial-temporal LLD gait dynamic change features from multi-sensor data. The SoftMax layer was employed to identify the LLD gait pattern with maximum probability precisely. The detailed description of the CNN-LSTM model for classifying the different LLD gait patterns is presented as follows.

Illustration of the architecture of the developed CNN-LSTM model.
Definition of multi-sensor gait pattern of LLD
Firstly, the gait pattern of LLD is defined based on the data of the multi-sensor located on joints of two lower extremities. The defined multi-sensor LLD gait pattern could contain more useful spatial-temporal gait dynamic characteristic information associated with LLD changes. Assuming that there are sensors worn on two lower limbs, the data of the l sensors at time t was defined as a vector


According to the equation (2), the sample data of the i LLD gait pattern could be defined as a matrix:

And then, based on equation (3), the sample data size including all k LLD gait patterns could be defined as a matrix :

In this study, the classification model was developed to discover the most representative spatial-temporal LLD gait dynamic change features


CNN for extracting spatial features of LLD gait change
CNN model is an excellent deep learning model constructed by multiple layers of deep neural networks. The deep learning networks architecture mainly includes the input layer, the convolutional layer, the pooling layer, the fully connected layer, and the output layer.
26
CNN model has the best learning capability to exploit the most representative spatial features by constructing multiple convolutional layers to expand the receptive field size. In this study, CNN was first adopted to discover the more valuable spatial LLD gait change features from the sample dataset D. Given that there are J convolutional layers in CNN block, the LLD gait spatiality features

In the CNN block, a maximum pooling layer was employed to reduce the sensitivity of the extraction of LLD gait spatiality features, which can significantly improve the learning ability to extract the most representative spatial LLD gait change features. In the maximum pooling layer, the useful LLD gait spatiality features

Thus, the CNN block could be adopted to explore the most representative spatial LLD gait change features
LSTM for extracting temporal dependency of LLD gait spatiality features
LSTM model is an advanced recurrent neural network model that can achieve the combination of previous computation with current computation. In the LSTM model, the extraction of temporal dependency in time-series data mainly depends on the basic cell that consists of a memory unit C, input gate


Illustration of the architecture of a basic cell of LSTM.
Where


According to (9), (10) and (11), the memory unit

Thus, the hidden state


Therefore, based on the basic cell, we can gain temporal dependency features

SoftMax for classification of LLD gait patterns
In the SoftMax layer, an LLD gait pattern

Loss function
In the present study, the cross-entropy is adopted as the loss function, in order to minimize the classification error while training and testing the CNN-LSTM model. The cross-entropy loss function is defined as

In this study, the developed CNN-LSTM model is described by Algorithm 1.
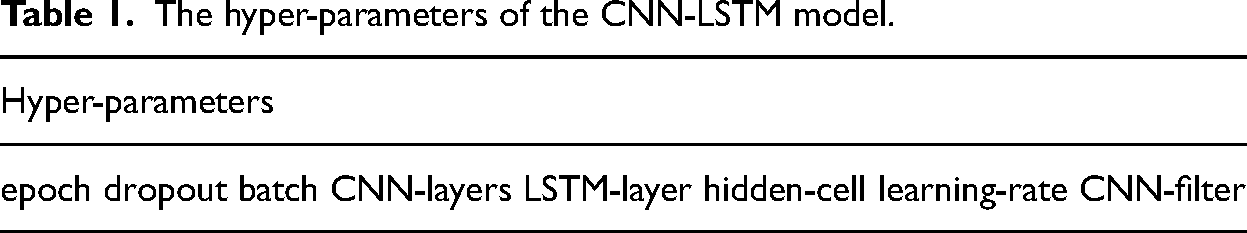
Hyper-parameters of the CNN-LSTM model
In addition, the adaptive learning rate with optimization algorithm Adam is employed to train the CNN-LSTM model, in order to avoid sparse gradient and noise problems. The hyper-parameters of the CNN-LSTM model are summarized in Table 1. The optimal values of hyper-parameters are selected based on the best generalization.
The hyper-parameters of the CNN-LSTM model.
Evaluation criteria for generalization performance
Four evaluation criteria (accuracy, recall, precision and F1-score) were adopted, in order to objectively and accurately evaluate the generalization performance. The detailed description of these criteria is given as follows.
Accuracy
Accuracy is used to measure the classification ability to truly identify LLD gait pattern and is defined as
Recall
Recall is adopted to assess the generalization capability to classify the LLD gait pattern with class 
Precision
Precision is employed to measure the classification ability to truly recognize the LLD gait pattern with class j, and is defined as
F1-scorce
F1-score is also used to evaluate the generalization ability to correctly classify LLD gait patterns and is defined as
Result
Training and testing scheme for LLD gait patterns classification
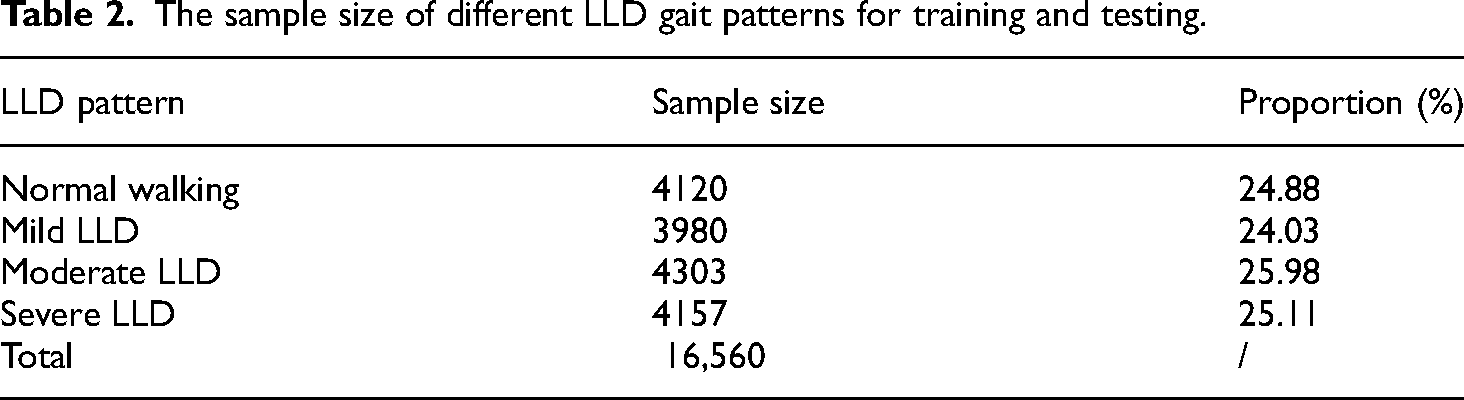
The min-max normalization method was first utilized to normalize the collected acceleration and gyroscope data from the interval [–1, 1], in order to effectively eliminate the difference in numerical dimension between acceleration and gyroscope data. And then, a fixed-length sliding window method was employed for data segmentation. In this study, the sliding window size was set to 150, and the overlap rate of two neighbor windows was set to 60 percent. To avoid the imbalance of the LLD data set, this study randomly extracted 180 windows for each LLD pattern from the collected triaxial acceleration and gyroscope data. Finally, all sample data sizes were 16,560 (i.e. 23 subjects × 4 LLD patterns × 180 window samples). All sample data was divided into two datasets: training set and test set. Namely, 80% of all sample data sizes were selected as a training set while the remaining 20% were used as a test set. The test set was adopted to examine the generalization. Table 2 presents the proportion of all sample data sizes with four different levels of LLD. As shown in Table 2, the proportion of each level of LLD was almost identical. Figure 8 illustrates the sample size of the training set and testing set of four different LLD patterns. In Figure 8, the training and testing sample size of normal walking pattern are 3296 and 824, respectively. The training and testing sample size of mild LLD gait pattern are 3184 and 796, respectively. The training and testing sample sizes of moderate LLD gait pattern are 3442 and 861, respectively. The training and testing sample size of severe LLD gait pattern are 3225 and 831, respectively.

Sample size of training and testing set of LLD patterns with four levels.
The sample size of different LLD gait patterns for training and testing.
Evaluation of the generalization performance of the CNN-LSTM model
Firstly, this study evaluated the generalization capability of CNN-LSTM for accurately classifying four different LLD gait patterns. For comparison, some deep learning models that were usually used in recent relevant studies were also developed for the same classification task. All four evaluation metrics (accuracy, F1-score, precision, and recall) were utilized. The best comparative results of the generalization of these classification models are presented in Table 3. As shown in Table 3, CNN-LSTM could reach almost the same highest accuracy, F1-score, precision, and recall of 93%, followed by the CNN model(accuracy of 91.63%, F1-score of 90.36%, precision of 91.33%, recall of 90.21%). The remaining three models such as LSTM, GRU, CNN-GRU could obtain all four evaluation metrics of less than 90%. In comparison, SVM was the poorest (accuracy of 67.38%, F1-score of 66.24%, precision of 68.01%, recall of 66.89%), demonstrating that the deep learning model outcompete the shallow machine learning model. In addition, Figure 9(a) and (b) show the comparative results of accuracy and loss rate while testing all classification models, respectively. As shown in Figure 9(a), the accuracy of the CNN-LSTM model is highest while the epoch is increasing. Also, from Figure 9(b), it is obviously seen that the loss rate of the CNN-LSTM model is lowest while the epoch is increasing. These results suggested that the developed CNN-LSTM could achieve the excellent learning capability to capture the most representative discriminative spatial-temporal LLD gait dynamic change features, thus significantly improving the generalization performance. Besides, in terms of model ablation experiment, the developed CNN-LSTM model is significantly superior to CNN or LSTM. This is because CNN or LSTM could only obtain the local spatial features or temporal dependency features of LLD gait change, which could yield low generalization.

Comparison results of learning ability based on the five different classification models. Figure (a) denotes the accuracy-epochs curve, and figure (b) is the loss-epochs curve.
The comparative results of generalization based on the different classification models.

Evaluation of CNN-LSTM model for identifying each LLD gait pattern
The CNN-LSTM model is used to evaluate the generalization capability to accurately identify each LLD gait pattern, and to further examine the feasibility of achieving the excellent learning ability to detect a certain level of LLD dynamic change. Here, the CNN-LSTM model included four convolutional layers, a max pool layer, a fully connected layer, and an LSTM layer with 16 hidden cells. Both recall and precision were selected as evaluation criteria for generalization performance. Table 4 illustrates the results of the confusion matrix of the classification of LLD gait patterns with four different levels. As illustrated in Table 4, the CNN-LSTM model could gain recall and precision of more than 92%, suggesting that our developed model could achieve the excellent generalization learning ability to recognize the gait pattern of LLD with a certain level. In comparison, the CNN-LSTM model could reach the highest recall (95.45%) and better precision (93.03%) to detect the gait pattern of LLD with severe level, demonstrating that the CNN-LSTM model has the best learning ability to discover the most valuable spatial-temporal dynamic change features associated with severe levels of LLD. Besides, the CNN-LSTM model could also obtain almost the same high recall (94.31%) and precision (93.28%) to identify the gait pattern of LLD with mild levels. However, the CNN-LSTM model could obtain lower recall (90.33%) but the highest precision (94.62%) when detecting the normal walking pattern, while the CNN-LSTM model could obtain higher recall (94.05%) but lower precision (92.04%) when recognizing the gait pattern of LLD with moderate level. These results suggested that normal walking patterns could be easily confused with the gait pattern of LLD with a moderate level, which may result in lower recall and precision.
The confusion matrix of classification results based on different LLD gait patterns.

Evaluation of the effect of abnormal compensation on LLD gait classification.
Additionally, the present study also assessed the effect of abnormal compensation on the classification performance of LLD gait, to examine the functional deformity caused by LLD with abnormal coupling across lower limb joints. In the experiment, the sample data are available based on the different combinations of normal or affected lower limb joints, and all sample data were used as input for the CNN-LSTM model. In two lower limbs, the normal lower limb denoted a lower extremity wearing a shoe lift without height, and the affected lower limb denoted a lower extremity wearing a shoe lift with height. The different combinations of lower limb joints included a single joint (hip, knee, and ankle), the combination of two joints(hip + knee, hip + ankle, knee + ankle), and all combinations of hip, knee, and ankle. Both accuracy and F1-score were selected as evaluation criteria. Table 5 shows the comparative results of classification performance between normal and affected limbs. As shown in Table 5, the classification performance from the affected limb was better than the normal limbs. In terms of the affected limb, the accuracy and F1-score based on a single ankle or knee joint were more than 90%, and were slightly superior to those based on a single hip joint. This suggested that a single ankle or knee joint of the affected limb could contain more useful LLD dynamic change information. Especially, the accuracy and F1-score based on a combination of ankle and knee joints were almost the same at 92% and were slightly less than 93% from the combination of hip, knee, and ankle joints. These results demonstrated that, with our multi-sensor data, the abnormal compensation between the ankle and knee joint could provide more discriminative LLD gait change information for higher classification performance.
The classification comparison results between the affected and normal limbs based on the different combinations of lower limb joints.

Selection of the optimal value of hyper-parameters
As we know, it is very important to select the optimal value of hyper-parameters for high generalization in developing deep learning models. The present study also evaluated the selection of the optimal hyper-parameter values for developing the CNN-LSTM model with high generalization. Because there is no existing standard method for such selection, the optimal values of hyper-parameters of the machine learning model were obtained by the trial-and-error method. In the experiment, the hyper-parameters from the different models mainly included convolution filter, CNN layer, LSTM layer, cell in LSTM, learning rate, batch size, and so on. Each hyper-parameter could vary with the other parameters in the process of training and testing. Therefore, selecting the optimal value of hyper-parameters mainly depended on the best generalization and minimum loss error. The selected optimal values of hyper-parameters from different models are presented in Table 6. Figure 10 illustrates that accuracy varied with the increase of the convolution filter while the other hyper-parameter values were determined. Accuracy could reach the highest value when the selection of the value of the convolution filter was 128. Similarly, Figure 11 shows that accuracy varied with the increase of LSTM cells while the other hyper-parameters values were determined. Accuracy was the best when the selection of the value of LSTM cells was 16. These results suggested that the optimal hyper-parameters values of developing the CNN-LSTM model were carefully selected for high-generalization in the experiment.

Impact of increasing CNN filters on generalization.
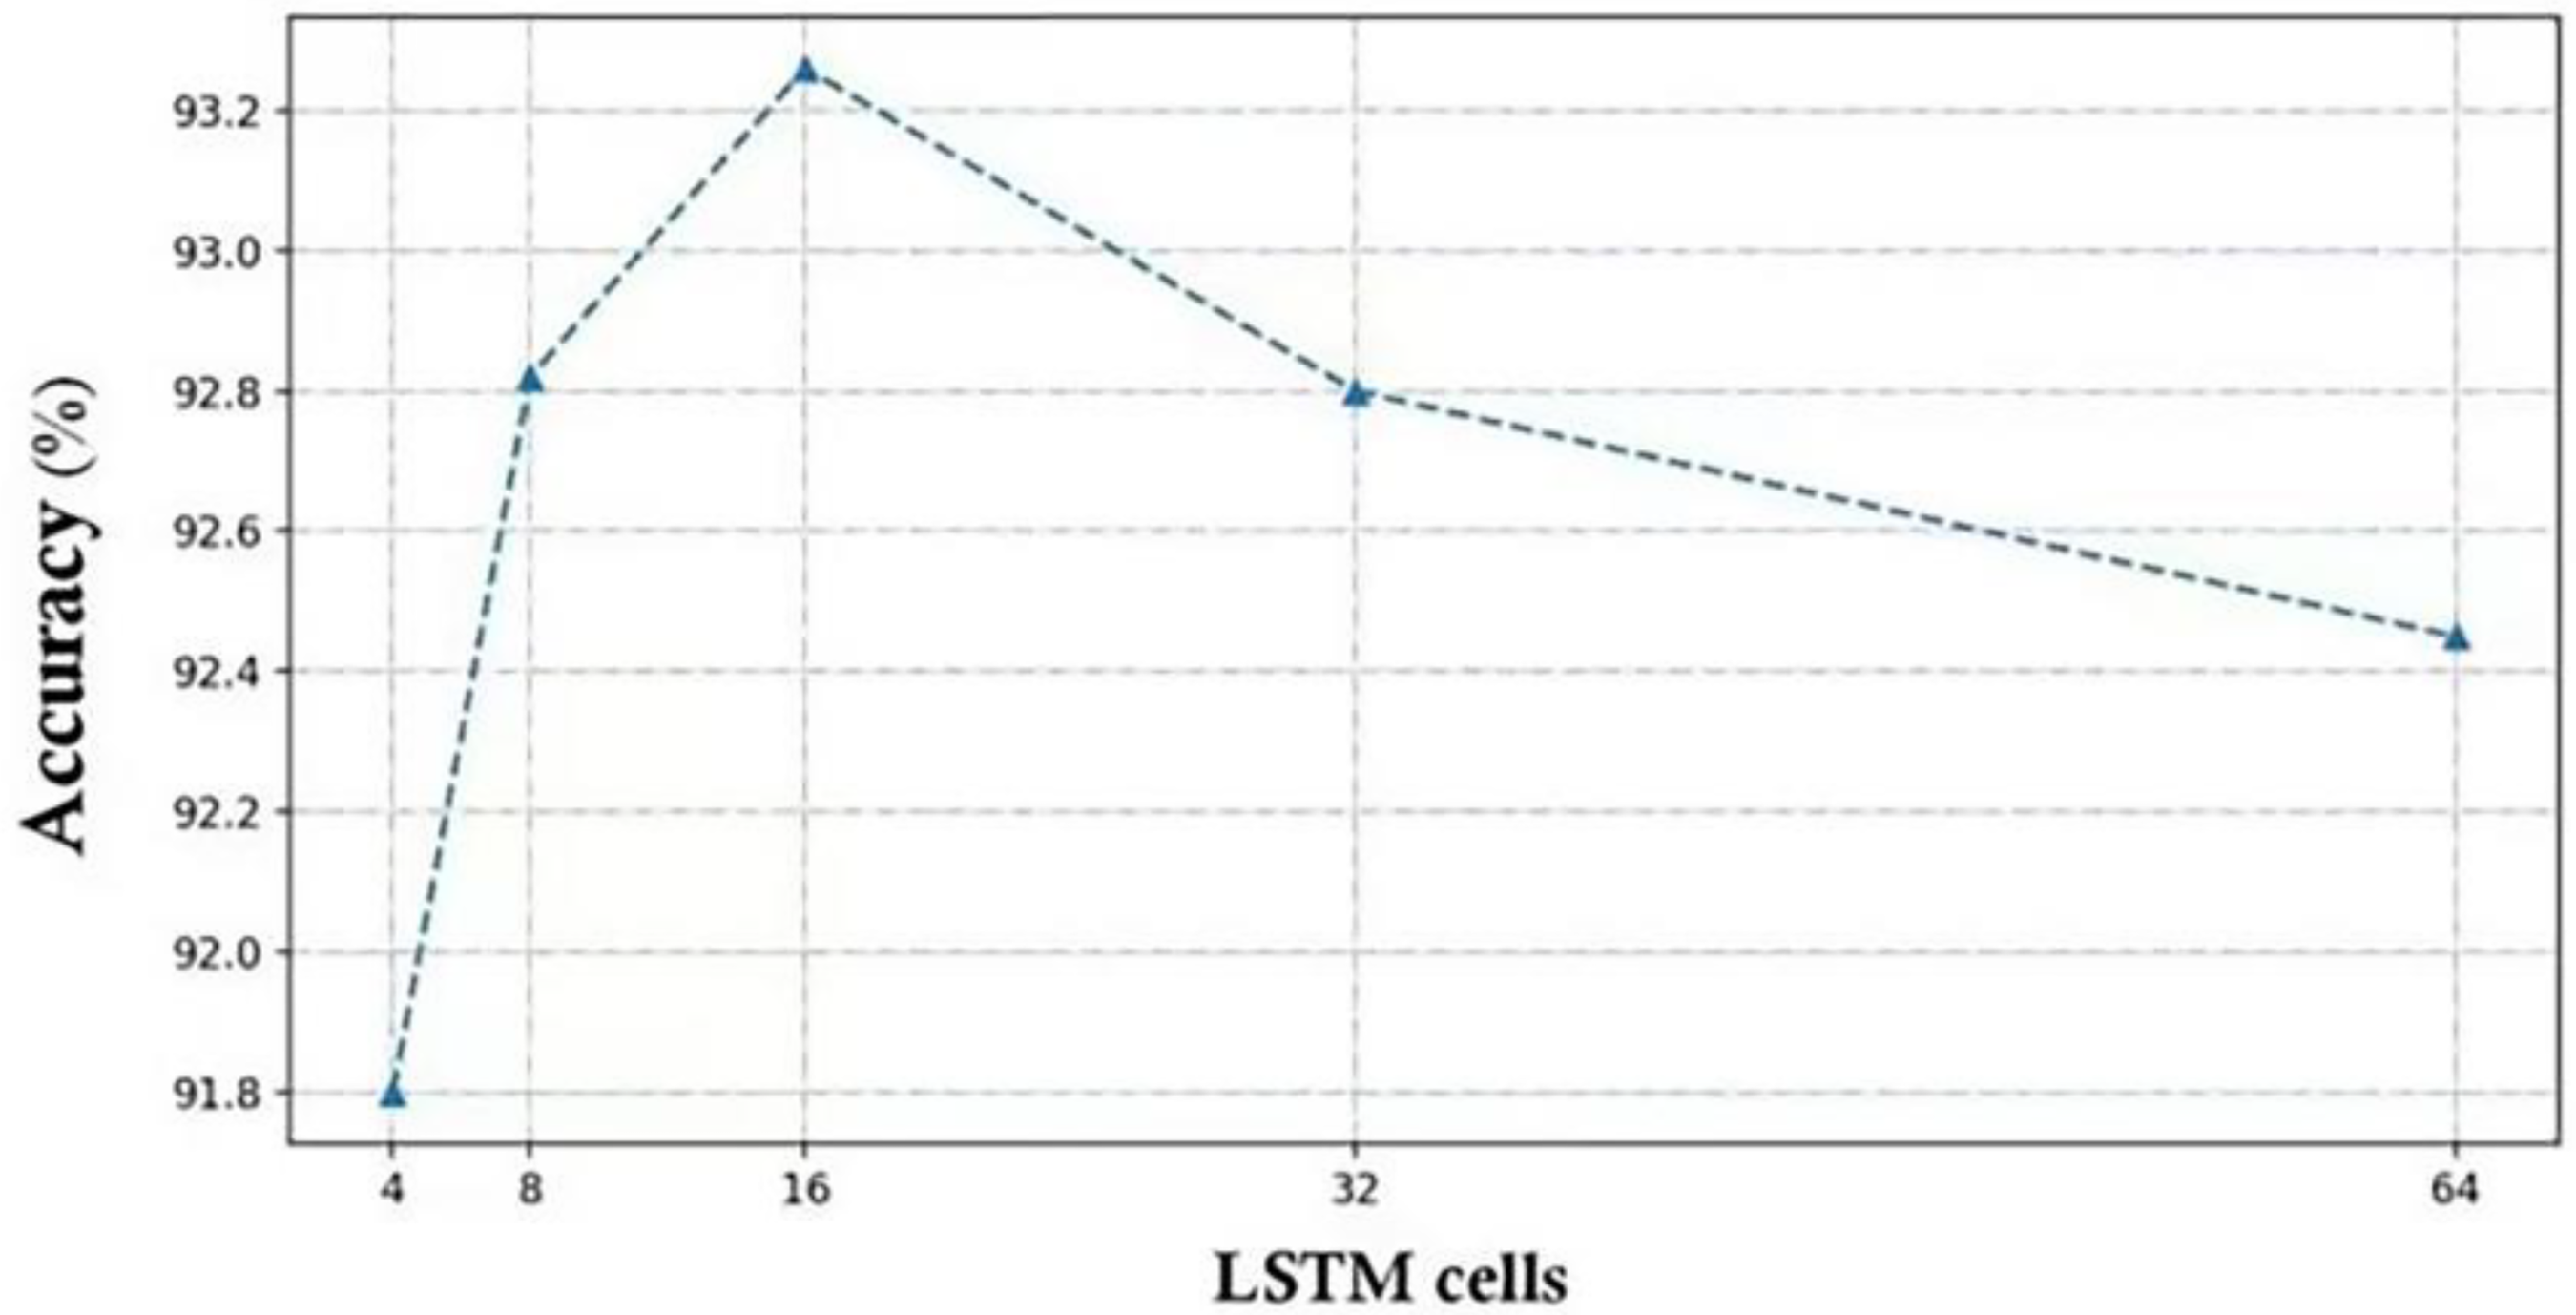
Impact of increasing LSTM cells on generalization.
The selection of optimal values of hyper-parameters from different deep learning models.

Discussion
The experimental results showed that our proposed technique could feasibly discover the most representative spatial-temporal dynamic change characteristics associated with different levels of LLD gait from multi-sensor data of lower limb joints. This could effectively improve the generalization capability to identify the dynamic change of LLD accurately. Currently, how to precisely detect the dynamic change of LLD in non-clinical settings has been a challenging task in gait analysis. In this novel technical solution, detecting LLD dynamic change outdoors was considered a multiple gait classification task. The CNN-LSTM model was developed to exploit the most representative spatial-temporal features from multi-sensor data, and the aim is to find out the most valuable discriminative spatial-temporal characteristics closely associated with LLD dynamic change by using advanced deep learning and wearable sensors.
This study employed the simulating LLD scheme that was commonly used in relevant research, to evaluate the feasibility of our proposed technique. In this scheme, three sensors were located on the hip, knee and ankle of a lower limb respectively. A shoe lift with different heights such as 0 mm, 30 mm, 45 mm and 60 mm was worn on a lower limb to simulate four LLD levels, which are normal, mild, moderate, and severe. The present study first evaluated the generalization capability to accurately classify four different LLD gait patterns. As shown in Table 2, the developed CNN-LSTM model was the best when compared with the selected models such as CNN, LSTM, GRU, and CNN-GRU. The possible reason was that the combination of CNN and LSTM could construct a robust deep hybrid neural network learning model with excellent spatial-temporal feature learning ability. This helps to explore the most representative LLD discriminative feature hidden in multi-sensor data. Similar studies on CNN-LSTM with high quality for gait classification have been published.29,30 In this experiment, CNN also has a good generalization to detect LLD dynamic change. Similarly, the CNN result for measuring LLD based on clinical image data has been reported in some related researches.20,21
In addition, the present research also assessed the generalization ability to correctly recognize a certain level of LLD, to further validate the practicality of our proposed method for measuring LLD dynamic change. As illustrated in the confusion matrix results in Table 3, our developed model could achieve a better generalization ability to detect each LLD gait pattern. This further demonstrated that our proposed model has an excellent deep learning ability to capture the most valuable spatial-temporal dynamic features closely associated with each LLD level. Besides, in comparison, we also found that the recall from normal walking patterns and the precision from moderate LLD gait patterns were both poor. This is because the normal walking pattern may be confused with the moderate level of LLD gait pattern, thus decreasing the generalization.
This study also evaluated the effect of abnormal compensation between lower limb joints on LLD classification performance, to examine the effectiveness of our approach further. As shown in Table 4, our method could gain a better LLD classification performance from the affected limbs than normal limb while the different combinations between lower limb joints were adopted respectively. Especially, for the affected limb, the combination of ankle and knee joint could reach almost the same higher classification performance as the combination of hip, knee and ankle joint. This is because our simulating LLD pattern could cause more abnormal compensation between the ankle and knee joint than the other different combinations of lower limb joints. This further suggested that our proposed method might also find the lower limb joints with more abnormal compensation caused by functional deformity of LLD. In addition, the developed CNN-LSTM model could also gain good classification performance (the range of Accuracy and F1-score were both from 86% to 89%) when the different combinations of normal lower limb joints were employed, respectively. This suggested that the multi-sensor data of normal limbs could contain gait abnormality information. The main reason was that the coupling across joints between two lower limbs may be interactive under the control of central neural systems. In other words, the functional deformity of the affected limb may cause abnormal compensation between joints of the normal lower limb. This might potentially produce gait abnormality of the normal limb. Similar results based on the traditional kinematic gait data have been reported by Walsh. 31
Besides, in the experiment, the best hyper-parameter values of the CNN-LSTM model need to be carefully selected for high generalization since each hyper-parameter value could vary with the other hyper-parameter values in the process of training and testing. So far, no standard method exists to determine the optimal parameters of the machine learning-based classification models. So, the trial-and-error method was adopted to select the optimal hyper-parameter values for the minimum training error and the best generalization. A similar method for selecting the optimal hyper-parameters values has been used in many studies on classification models.32–34
Also, unlike the recent relevant research, the present study could take advantage of the deep learning model and wearable sensors to effectively detect the different levels of LLD gait patterns. This greatly contributes to the real-time measurement of the dynamic change of LLD in home or outdoor environments. Especially, the proposed novel technical solution could feasibly evaluate the effect of the coupling action across lower limb joints on LLD change. This could benefit in gaining deeper insights into the abnormal compensation caused by LLD and hopefully offering potential treatment strategies for LLD in clinical settings.
Conclusions
The present study provided a novel technical solution that could feasibly measure the dynamic change of LLD in outdoor settings by using deep learning and wearable sensors. The developed CNN-LSTM model could exploit the most representative spatial-temporal dynamic characteristics associated with LLD gait change from the data of multi-sensors located on the hip, knee, and ankle joint. This could achieve the superior generalization capability to accurately detect the different levels of LLD. Besides, the developed CNN-LSTM model has the superior learning ability to effectively evaluate the effect of the coupling across joints of lower limbs on LLD gait change. This may help to find a certain lower limb joint with abnormal compensation caused by LLD, which contributes to providing effective treatment strategies for LLD in clinical applications.
In addition, since the CNN-LSTM model only depends on the fixed connectivity data structures such as vectors or matrices to define LLD gait patterns with multi-sensor data, the most representative spatial-temporal LLD dynamic change features are discovered only in Euclidean space. These limitations make it challenging to explore the irregular nonlinear features clearly associated with the LLD dynamic change hidden in non-Euclidean space. This may deteriorate into the generalization of detecting the LLD dynamic change.
In future work, the advanced graph neural networks (GNN) model, as a powerful deep learning tool to discover the most representative irregular nonlinear features in non-Euclidean space, will be introduced to measure the dynamic change of LLD using wearable sensors. The basic idea is that the coupling across lower limb joints is considered as the graph topological structure. The main objective is to develop a high-generalization GNN model for capturing the most valuable intrinsic coupling features related to LLD change from multi-sensor data in non-Euclidean spaces. Additionally, future research will also focus on investigating the interpretability of physiological or pathological LLD change by developing a high-generalization GNN model. This would contribute to applying machine learning-based aided diagnosis of LLD in clinical application.
Footnotes
Author contributions
WJN conceived the original idea of the study, and a corresponding author. He participated in drafting the manuscript with SYJ. SYJ participated in designing model for analyzing the data. WXY and SYJ participated in writing the part of manuscript. All authors read and approved the final manuscript.
Declaration of conflicting interests
The author(s) declared no potential conflicts of interest with respect to the research, authorship, and/or publication of this article.
Funding
The author(s) disclosed receipt of the following financial support for the research, authorship, and/or publication of this article: This study was funded by National Natural Science Foundation of China (Grant Number 82072043) and Fujian Provincial Natural Science Foundation of China (Grant Number 2020J01163).
Informed consent statement
All recruited participants agreed with the informed content requirement. This study was approved by the ethical Ethics Committee of Fujian Normal University. We are very grateful to all recruited participants for their time and effort in data acquisition.
Author biographies
Jianning Wu received the PhD degree in Biomedical Engineering at Xi'an Jiaotong University in China in 2007. He is currently a Professor of Biomedical Engineering at Fujian Normal University. His research interests include gait analysis, biomedical instrumentation and rehabilitation techniques, pattern recognition and machine learning.
Yujie Shi is a researcher at the College of Computer and Cybersecurity, Fujian Normal University. She graduated from the Information Management and Information Systems program at Anhui University of Engineering in Wuhu, Anhui Province, China in 2018, receiving her bachelor's degree. Currently, she is pursuing a master's degree in Biomedical Engineering at Fujian Normal University. Her current research interests include biomedical signal processing, pattern recognition, and machine learning.
Xiaoyan Wu is a PhD student in Marketing at Newcastle University Business School. Her research interests include consumer behavior, consumer psychology and digital marketing. Her research focuses on investigating how digital technology influence people's behavior and decision-makings.