
Abstract
Abnormal spinal curvature poses a significant health risk to children and adolescents, highlighting the importance of maintaining good posture for spinal health. However, current posture detection methods face challenges such as insufficient detection accuracy, discomfort during use, and overall inconvenience. This study aims to design and implement a wearable system that integrates angle sensors and surface electromyography (sEMG) sensors to monitor spinal alignment and muscle activity in real-time. The system consists of a smart vest equipped with flexible bending sensors and sEMG electrodes, a microcontroller unit for data processing, and a mobile application for data visualization and user feedback. To validate the system's effectiveness, the study involved 65 eligible undergraduate students wearing the device, collecting sEMG signals under different posture conditions, and conducting posture analysis to evaluate the device's performance. The results showed a significant correlation between asymmetric paraspinal muscle activity and the direction of the spinal curve, with the system achieving an accuracy rate of 90.8% in predicting the curve direction using a logistic regression model. Although the system verifies spinal alignment through indirect measurement rather than direct imaging, the high consistency between sEMG asymmetry and expected biomechanical patterns supports its reliability as a functional screening tool. Wearable devices can provide timely posture correction reminders and personalized rehabilitation plans, offering a noninvasive, user-friendly solution for the prevention and rehabilitation of spinal curvature abnormalities.
Introduction
Currently, abnormal spinal curvature has become one of the major health problems in children and adolescents. 1 Under normal conditions, the sagittal plane of the human body presents four physiological curves: cervical, thoracic, lumbar, and sacral. 2 Abnormal spinal curvature refers to the abnormal signs caused by the curvature of the spine exceeding the normal physiological curvature. 3 For the spine convex back also known as hunchback, hunchback 4 is the thoracic vertebrae backward protrusion caused by the spine morphological changes. According to the statistics of China Children's Activity Centre, 5 the incidence of different degrees of spinal curvature abnormalities among Chinese children and adolescents is as high as 20%, of which the phenomenon of hunchback is particularly significant, and the proportion of neck exploration and hunchback in the walking posture is as high as 46.1%. Scoliosis, also known as scoliosis, 6 is a three-dimensional deformity in which one or more segments of the spine are curved to one side or accompanied by vertebral rotation, manifesting itself as a multi segmental, coronal convexity deformity of the spine, accompanied by sagittal curvature alteration and horizontal rotational deformity. 7 The overall prevalence of scoliosis in China is about 1.02%. 8 Scoliosis is a social health problem that cannot be ignored because it affects the development of muscles and bones and causes many psychological disorders. 9
Good sitting habits are linked to spinal health. 10 Research has shown that poor sitting posture is closely related to the onset of scoliosis. 11 Therefore, correcting poor sitting posture in daily life is very important to prevent and delay the process of spinal diseases. 12
The designs of posture correction products on the market can be broadly classified into restrictive types and sensor-based types. Restrictive products include postural correctors like the “Back Straightener” and corrective belts, while sensor-based products include devices with intelligent distance measurement functions such as the “Visomate Vision Protector.” However, these products often suffer from issues such as insufficient detection of spinal curvature, suboptimal wearing experience, and lack of portability. Sensor-based wearable posture correction systems (such as the Visomate visual protector) can use ultrasonic sensors to interactively detect head position through programming, but they have obvious limitations, such as only monitoring cervical spine movement and lacking multiparameter assessment of three-dimensional deformation of the thoracolumbar spine. Most devices rely on threshold alarm mechanisms and do not consider false positives caused by individual anatomical differences. A knitted self-powered sitting posture monitoring vest made from conductive fibers and nylon yarn 13 uses a knitted structure and sensor arrays sewn into different parts of the garment to assist in sitting posture monitoring and correction, enhancing the comfort of wearable devices. However, it lacks an intuitive display of spinal curvature and guidance for correcting sitting posture. Numerous scholars have conducted a series of beneficial research and exploration on the monitoring of spinal morphology and movement. The study subjects are primarily drawn from normal populations, including validating the efficacy of newly developed devices in healthy cohorts or investigating spinal kinematics in healthy individuals. Róbert Rusnák's 14 study found that spinal deformities are closely related to incorrect posture. Among the 311 students surveyed, 50% exhibited widespread incorrect posture, with sagittal spinal deformities exceeding 30%. Chen 15 included data from 426 students with lateral Cobb angles from 2016 to 2022. Through logistic regression models and receiver operating characteristic (ROC) curve analysis, it was found that incorrect posture and angle of trunk rotation (ATR), especially right rib hump, were significantly associated with the curvature size of adolescent idiopathic scoliosis (AIS), confirming that poor posture directly contributes to the development of spinal deformities through muscle imbalance and biomechanical remodeling. Katzman 16 conducted a rigorous randomized controlled trial (RCT) design, confirming the efficacy of spinal strengthening exercises and posture training in improving excessive kyphosis in the elderly, providing clinical evidence for the causal association between poor posture and abnormal spinal curvature. Berger-Pasternak et al. 17 used inertial sensors to assess lumbar spine kinematics in healthy individuals during sit-to-stand movements. Shanmugam et al. 18 designed a wearable embedded device based on MPU-6050 sensors to track lumbar spine position in patients with chronic low back pain. Gardiner et al. 19 employed inertial measurement units to monitor cervical and lumbar spine mobility in patients with axial spondyloarthritis. Bocos-Corredor et al. 20 used an inertial sensor placed on the forehead to monitor head and neck flexion-extension movements in both healthy individuals and patients with neck pain. In addition to patients with spinal disorders, some studies have also monitored spinal movement in nonspinal disease populations, such as using wearable sensor devices to assess the forward-flexed posture of patients with Parkinson's disease during walking. 21
Addressing the detection blind spots of existing products and the unclear biomechanical mechanisms, this study aims to develop a wearable device that monitors the symmetry of erector spinae muscle activity through surface electromyographic (sEMG) signals, establishing a mapping relationship between muscle activation patterns and spinal curvature; simultaneously developing a fusion system of flexible textile electrodes and inertial sensors to achieve dynamic posture assessment; and introducing adaptive algorithms to distinguish between physiological compensation and pathological curvature, thereby enhancing intervention precision.
Overall structural design
The spinal curvature measurement system mainly consists of a wearable flexible vest, a posture monitoring device, a muscle electrical signal device, and a mobile phone WeChat applet terminal. As shown in Figure 1.

Overall system schematic.
Theoretical foundations of rehabilitation
Physiological structure of the spine: When viewed in the sagittal plane, the normal physiological structure of the human spine has four physiological curves: cervical, thoracic, lumbar, and sacral curves. The muscle tissues attached outside the spine can provide protective support for the spine. In addition, from the observation of spinal morphology, the vertebrae are gradually enlarged from top to bottom, which is mainly due to the pressure load on the upper part of the body, and the larger lower vertebrae also ensure that the lumbar spine can withstand greater pressure. 22
Physiological structure of the back muscle groups: The musculature of the back is arranged in layers, where the deeper muscles can be differentiated by their location and innervation by branches of the posterior branch of the dorsal spinal nerve. The key to therapeutically controlling the development of scoliosis is to change the asymmetric stresses on both sides of the spine,23,24 and to biomechanically regulate the cartilage growth of the endplates on both sides of the scoliotic vertebrae. 25 The design of the orthosis is based on the principles of bioengineering mechanics, using the “three-point force” system, by changing the mechanical and kinematic characteristics of the spine, pelvis, thorax, and scapular girdle, to achieve the purpose of correction. It should be noted that muscle asymmetry, while a key indicator of spinal curvature, is not the sole marker—compensatory muscle activity and external factors may also affect muscle electrical signals. Therefore, the system integrates both myoelectric data and spinal curvature sensor data to comprehensively assess spinal status, reducing the bias caused by single-index evaluation.
Selection of Electromyography (EMG) Measurement Sites: Myoelectric Patch Point Selection Scoliosis can occur in the thoracic, thoracolumbar (T10–L2), lumbar regions, or combinations thereof. Previous studies indicate that adolescent idiopathic scoliosis (AIS) most commonly involves the thoracolumbar segment, followed by the thoracic and lumbar regions.26,27 Farahpour 28 observed that in patients with AIS exhibiting left-curved thoracic deformities, the erector spinae muscles at the T6 and L3 levels showed significantly elevated surface EMG signals during lateral flexion in the prone position. The T6 vertebra is situated near the central region of the thoracic spine, while L3 represents a biomechanical center of lumbar motion, serving as an attachment site for portions of the iliopsoas, latissimus dorsi, erector spinae, and other paraspinal muscles. Therefore, EMG recordings at T6 and L3 may reflect asymmetrical muscle activation patterns associated with scoliosis. However, the generalizability of T6 and L3 as optimal EMG monitoring sites across varying scoliosis types and severity levels remains uncertain. For instance, in non-AIS deformities, severe rigid curves, or patients with hyperkyphosis, muscle activation patterns may differ substantially, and alternative electrode placements—such as near the apex of the curve or in regions with maximal rotational deformity—might better capture neuromuscular imbalance. To enhance applicability across a wider range of populations, future implementations should incorporate adjustability in sensor placement. This could be achieved through a modular electrode design allowing placement at multiple potential sites, combined with machine learning-based signal analysis that automatically identifies the most informative channels depending on individual curve characteristics. Furthermore, integrating real-time motion capture or ultrasound imaging could help correlate EMG signals with specific vertebral levels and functional movements, improving both specificity and personalization of muscle activity monitoring.
Overall structure of the wearable system
The device consists of a smart vest integrated with a posture detection module and an EMG sensing module, along with a companion applet terminal. The orthopedic vest collects real-time spinal curvature data and paraspinal muscle electrical signals, which are transmitted to the applet terminal via a Bluetooth module. Upon receiving the data, the applet terminal displays spinal curvature and EMG signals in real-time, conducts abnormal curvature diagnosis through data analysis, and pushes personalized rehabilitation plans. When the spinal curvature exceeds a preset threshold, the system triggers automatic vibration to remind the user, facilitating daily prevention, and rehabilitation of spinal abnormalities.
The wearable flexible customized vest is primarily fabricated using cotton and polyester cotton, selected for their high breathability and abrasion resistance. To address potential skin irritation and ensure long-term wearing comfort—particularly critical for children and adolescents—additional design considerations have been incorporated: the inner layer of the vest uses hypoallergenic, medical-grade cotton to minimize friction and reduce the risk of contact dermatitis; the electrode sheets are made of biocompatible hydrogel with low allergenicity to avoid skin redness or itching during prolonged use. For young users, the vest features adjustable shoulder straps and waistbands to accommodate growth and diverse body types, while its lightweight design (total weight < 150 g) reduces physical burden during daily activities.
System hardware design
In the wearable system, the hardware system is mainly divided into two modules. Module 1 consists of curvature sensor and Myoware muscle electrical sensor and electrode sheet, module 2 consists of linear motor, STM microcontroller, switch and indicator light, power supply and lithium battery charging part together. The 2 modules cooperate with each other to achieve.
To adapt to diverse body shapes, sizes, and movement patterns—key factors affecting signal accuracy—specific optimizations have been made: The curvature sensors and Myoware EMG sensors are mounted on a flexible, stretchable substratethat conforms to variations in torso contours. Adjustable snap-on fixtures allow sensor repositioning to ensure stable contact across different body types. To mitigate signal distortion caused by movement, the electrode sheets use a microporous adhesive layer to enhance skin adherence while allowing moisture evaporation, reducing motion-induced displacement. Additionally, module 1 integrates a hardware-level 50 Hz notch filter and adaptive baseline correction algorithm to suppress motion-related noise. These design features enable the hardware modules to collaborate effectively, ensuring reliable data collection across diverse users and movement scenarios.
Selection of system hardware
Selection of main control chip: In order to improve the accuracy of data acquisition of the real changes in the spine, the STM32F103RCT6 chip in the STM32 series was selected as the main control chip in the system hardware design. This chip has the advantages of small size (1cm×1 cm), high performance, high integration, low power consumption, which can save the space size and improve the system endurance. This model of chip supports high-speed computing, and can also be used to achieve a larger capacity of storage through SD card, serial Flash, etc. 29 STM32F103RCT6 chip as the main control chip, has a wealth of input/output (IO) port resources, as well as a high operating frequency, which can be used to solve a large number of mathematical operations involved in the system on the solving of the attitude. Additionally, this main control chip exhibits excellent stability and noise immunity. It boasts superior electromagnetic compatibility (EMC) and operates within a temperature range of −40 °C to +85 °C. The chip also incorporates an advanced power management system that ensures high-performance operation while effectively extending battery life.
Main control chip circuit design: The STM32F103RCT6 chip is connected to other electronic components through pins with different functions, and is mainly used for preliminary processing of the spinal curvature data measured by the sensing strip, and the monitored data are integrated together and sent to the mobile phone applet through the Bluetooth module at a frequency of 10 Hz; occasional packet loss does not significantly affect the measurement results due to the continuous nature of the data. To improve system maintainability and long-term usability, a replaceable button cell battery is adopted in this design. When the battery degrades, users can replace it independently, avoiding device failure caused by battery performance degradation and effectively extending the overall service life of the system. And then the applet determines whether it is a bad sitting posture or not based on the results returned by the calculation of the inclination of the spine at six points according to this data, and if it is, the Send commands through Bluetooth to control the vibration reminder module for vibration reminder, as shown in Figure 2 for the main control circuit design.
Transducers
Sensor selection
Six-axis angle sensor: A six-axis angle sensor typically consists of a three-axis gyroscope and a three-axis accelerometer.
30
Gyroscopes estimate the attitude angle of an object by measuring its angular velocity. The gyroscope senses the rotation of the object and generates an output signal proportional to the angular velocity, which can be realized using microelectromechanical systems (MEMS) technology. Accelerometers estimate the attitude angle of an object by measuring information about the change in angular velocity and acceleration of the object around each axis. However, gyroscopes suffer from the problem of drift, that is, the accumulation of errors over time leading to inaccuracies in the attitude angle. To solve this problem, accelerometers are usually required to correct the gyroscope output.
31
Sensor fusion algorithms (e.g. Kalman filtering) fuse data from gyroscopes and accelerometers to obtain more accurate attitude angle information. Common fusion algorithms include Complementary Filtering, Standard Kalman Filtering, and Extended Kalman Filtering (EKF). Complementary Filtering achieves data fusion through a simple combination of high-pass (gyroscope) and low-pass (accelerometer) filters. This method is straightforward and computationally efficient, making it suitable for systems with high real-time requirements. However, it is sensitive to noise and initial errors, which limits its accuracy. Standard Kalman Filtering is applicable to linear systems and can optimally estimate state variables when the statistical properties of system noise are known. In nonlinear problems such as attitude estimation, linearization is required, which can limit performance due to approximation errors. EKF extends the standard Kalman Filter to nonlinear systems by performing a first-order Taylor expansion of the nonlinear model to estimate states. It is particularly suitable for quaternion-based attitude estimation systems, where it provides robust performance by dynamically correcting sensor drift and measurement noise. In this study, we employ an Extended Kalman Filter for attitude fusion. The EKF constructs a state vector xk=[qk,bk]T, where qk represents the quaternion describing the orientation and bk represents the gyroscope bias. The filter uses gyroscope data for predicting the orientation and incorporates accelerometer measurements during the update step to compute the projection error relative to the gravity vector, thereby providing feedback correction for both the orientation estimate and the bias. This approach effectively mitigates long-term gyro drift while enhancing dynamic response accuracy. Experimental results show that the attitude angle drift is controlled within 0.1°/min under static conditions, and remains below 0.2°/min during dynamic activities, demonstrating superior performance compared to single-sensor approaches and other commonly used fusion methods. Muscle electrical sensors: The operating principle of the EMG Electromuscular Sensor32,33 is based on the electrical activity generated during muscle contraction. When a muscle moves or when a muscle is stimulated, the nervous system sends signals to the muscles involved, activating the contraction of muscle fibers and the flow of ions between the nerve-muscle junctions, resulting in weak potential changes. In order to be able to accurately measure and analyze these signals, amplification circuits in the sensor amplify the signals to a level suitable for recording and analysis. The muscle electrical module consists of analog circuitry acquisition at the frontend and digital signal filtering and processing at the backend. Front-end acquisition circuit captures sEMG signals from six channels (channels 1–6). The raw signals are first amplified by a differential amplifier with a common-mode rejection ratio (CMRR) of up to 80 dB, enhancing weak EMG signals while suppressing common-mode noise. Subsequently, the signals pass through a 20 to 150 Hz band-pass filter to remove low-frequency drift and high-frequency noise, ensuring the signals remain within the physiologically relevant frequency range. A 50 Hz notch filter is applied to attenuate power-line interference, achieving over 40 dB suppression. Finally, the signals undergo secondary amplification and voltage level shifting to optimize them for analog-to-digital conversion, ensuring suitable dynamic range for subsequent digital processing. Middleend signal processing and the use of envelope detector processing to get the EMG dynamic detector signals. At the same time to provide an external single-channel Audio Output Interface output the original signals, which can be realized through the jumper cap jumper to output the original waveform of a certain channel, which is convenient for the user through the interface. At the same time, it provides external single-channel Audio Output Interface to output the original signal, which can be achieved by jumping wires from the jumper cap to output the original signal of a certain channel, which is convenient for users to monitor and analyze the current EMG signals in real-time with the help of external instrumentation. The back-end uses the Arduino UNO Development Kit, which is compatible with the six-lead EMG module, to collect the output signals from the middle end and control the LEDs to achieve a quick reference of the EMG signal intensity by the LED lights. This allows information about the intensity, timing, and pattern of muscle activity to be obtained, which is of great significance in the fields of diagnosis, rehabilitation, and motor control.
Sensor Power Switch Control Circuit
PB5 is the pin control terminal of theMCU, Q1 is an negative-positive-negative (NPN)-type transistor, and Q2 is a P-type metal-oxide-semiconductor field-effect transistor (P-MOSFET). The source (S) of the P-MOSFET acts as the input, the drain (D) acts as the output, and the gate (G) acts as the control terminal. When PB5 is high, the NPN-type transistor conducts, making the gate of the P-MOSFET close to ground with respect to the source, and a voltage of −5 V is generated between the gate and the source, which causes the P-MOSFET to conduct, and there is a voltage output at the D pole of the output terminal; when PB5 is low, the NPN-type transistor cuts off, and there is no voltage difference between the gate and the source of the P-MOSFET, and the P-MOSFET cuts off, and there is no voltage difference between the gate and the source. MOSFET cuts off, and there is no voltage output at the D-pole of the output. In this design, the NPN-type transistor acts as a voltage level converter and can be used to control the 5 V power supply using a 3.3 V signal. voltage common collector (VCC) is stepped down from the Li-Ion battery to 3.3 V via a linear regulator to power the microcontroller and peripherals, while V3.3 is used to power the six-axis sensors and the myoelectric sensors. As shown in Figure 3.
Bluetooth module
Bluetooth module
This BLE Bluetooth module is a wireless module with a built-in Bluetooth LE protocol stack, designed for wireless 2.4 GHz industrial, scientific, and medical (ISM) high rate transmission. The main features of Bluetooth are low power consumption, fast connection speed, long connection distance, large wireless coverage, low cost, and the ability to optimise the connection configuration process. As shown in Figure 4, the wearable system connects sensors through Bluetooth 5.0 communication technology to obtain real-time data to the background server database of the applet, which in turn extracts real-time data through front-end Asynchronous JavaScript and XML (AJAX) communication and visualizes it to the applet terminal for users to view.
Bluetooth Surround Circuitry
The Bluetooth module is used to communicate between the microprocessor and external devices (mobile phones, etc.), upload real-time attitude and angle data, and receive commands from mobile phones. When the mobile phone WeChat applet to start the Bluetooth connection operation, the front-end AJAX sends a request, the Bluetooth PB6 pin is in a high-current state, through the RX serial port data input and TX serial port data output, thus enabling the mobile phone WeChat applet end and microprocessor connection. As shown in Figure 5.
System software development
The applet side of the system needs to meet the functional requirements of processing data transmitted by sensors, real-time visualization, rehabilitation program push, rehabilitation action recognition, reminders, as well as Bluetooth connectivity, battery level display, and other functional requirements.

Main control circuit design.

Sensor power switch control circuit.

Wireless data Bluetooth transmission module design.

Circuit design around Bluetooth.
After successful initialization, the system receives data automatically sent from the Bluetooth template of the microcontroller, including the curvature signal data sent by the posture monitoring device, and the paravertebral EMG signal sent by the Myoware muscle EMG sensor. After accepting the data, the system automatically processes and visualizes the data to obtain a user's hunchback assessment report and a high body customized exercise correction plan. The assessment report includes a number of indicators such as the number of hunchbacks, the number of left/right tilts, and the distribution of time periods of poor posture. If the angle limit is exceeded and the difference in the amplitude of the electrical signals between the two sides of the muscles is too large, it will enter the vibration reminder mode, the vibration motor in the spine sensor strip will vibrate on its own, reminding the user to maintain a normal posture, and the vibration will stop after restoring the normal posture. Users need to carry out active exercise rehabilitation according to the given program. If the mode is activated again after a certain period of time, the applet will automatically compare the data of this time with the previous assessment results, so that the users can visually see their progress and improve their motivation for active exercise. This function can enhance the understanding of one's own hunchback condition, control the progress of hunchback treatment at any time, and achieve the purpose of hunchback treatment through active exercise rehabilitation. As shown in Figure 6.

Applet page.
The applet interface adopts a minimalist design, with the home page prominently displaying the core real-time visualization of the spinal curve. Alerts for abnormal postures are designed to be highly intuitive and conspicuous, allowing users to instantly grasp their current posture status. By tapping the navigation bar at the bottom of the page, users can conveniently switch to other interfaces to view health status summaries, historical records, and personal account information. The overall operation flow is simple and smooth, making the applet highly user-friendly, as shown in Figure 6.
Furthermore, to evaluate system performance, we selected six mainstream smartphones with different configurations (covering both high-to-mid-range and low-end models) and conducted stress tests on the core functional modules of the applet using built-in system performance monitoring tools. The test results show that the average Bluetooth data reception delay is less than 100 ms, the average page switching time is less than 500 ms, the average applet startup time is less than 1200 ms, and the memory usage remains stable within 80 MB during operation. These results indicate that the applet maintains smooth responsiveness and low resource consumption across mobile devices of varying performance, demonstrating excellent compatibility and real-time performance.
Assessment report on the small program side
Principles of camelback measurement
The thoracic kyphosis angle (TKA) is the main indicator of thoracic curvature, reflecting the morphological characteristics of the sagittal plane of the spine, and this item is based on the TKA as an important basis for the diagnosis of hunchback. Locate the upper parietal and lower caudal vertebrae in the thoracic.
34
Segment of the spine (the vertebrae with the greatest upward and downward inclination in the segment), draw a horizontal line on the upper margin of the upper parietal vertebrae, and another horizontal line on the lower margin of the lower caudal vertebrae, and then use these two lines as the standard to make a vertical line for each of them, and the intersection angle of the two vertical lines will be the angle of the posterior kyphosis of the thoracic spine, with a normal value of between 20° and 45°. To facilitate the measurement, the formula θ = 4[ARC tag(2H/L]
35
was used to calculate the TKA in this project. A line was drawn from the seventh thoracic vertebral spinous process (C7, sensor 1) to the twelfth lumbar vertebral spinous process (T12, sensor 5), and the line from the sixth lumbar vertebral spinous process (T6, sensor 3) to the C7-T12 line, and this line is denoted as H. By using the positional relationship between the parietal vertebrae and the upper and lower end vertebrae (corresponding to sensors 3, 1, and 5), the size of the thoracic lordosis angle was measured and then the degree of thoracic curvature was inferred and thus the degree of thoracic curvature can be inferred. The other three sensors are involved in the construction of a two-dimensional (2D) sagittal model of the spine at the applet end. For the diagnosis of hunchback, this item also sets up the calculation of the deviation value of the sensor. The deviation value refers to the extent to which the vertebral position of the spine deviates from the midline of the sagittal plane of the human body. In general, the sagittal mid-gravity line of the human body passes through anatomical landmarks such as C1, T1, T12, and S1 to maintain optimal physiological curves and body balance. In this project, the fifth sensor located at T12 is used as the reference of the median gravity line to determine the corresponding segments of the spine that have greater deviation in hunchback. After the subject wore it, the subject was first made to bend to the highest degree of the body (anterior flexion of the spine) and held it for 2 to 3 seconds, and the maximum value of the deviation from the line of gravity at this time of the other sensors except the fifth sensor, Lx, was recorded.
36
When the subject is wearing, when the subject has a hunchback phenomenon, the other sensors will each produce a deviation from the line of gravity of the center of gravity of the difference value L. The deviation value △L = L/Lx. Finally, by comparing the deviation value △L (the vertebra with the largest deviation) of each sensor, we can get the segment with the largest deviation, so as to locate the area of the hunchback with greater precision (Figure 7).
Principles of scoliosis measurement
sEMG signal is the electrical signal accompanying muscle contraction, which is an important method to detect muscle activity noninvasively at the body surface.
37
The sEMG signal of paraspinal muscles such as rhomboid, lumbar square, upper and lower section of erector spinae, etc., is collected by the sEMG acquisition system, and the main functions include signal amplification, filtering, and suppression of common-mode signals. The amplifier gain is calculated as G = 1 + 50kΩ/RG (External Resistance). Studies have shown that the sEMGs of paraspinal muscles of patients with AIS are significantly larger on the convex side than on the concave side.38,39 After receiving the data on the applet side, the diagnosis of scoliosis and the real-time reflection of paraspinal muscle movement are carried out based on the amplitude difference between the muscle electrical signals on the two sides of the spine, prompting the user to indicate whether or not scoliosis is present, as well as indicating the convex side versus the concave side. In spinal rehabilitation, the EMG signals can reflect the muscle movement status during rehabilitation exercise. With the prolongation of the exercise load time, the MF slope (MFslope), MPF slope (MPFslope), and ZCR slope (ZCRslope) all decrease linearly,
40
which can reflect the fatigue level of the muscles, so that it is convenient to adjust the rehabilitation program at any time.
Recommendations for rehabilitation programs on the applet side
The rehabilitation program on the applet side is recommended to be designed using a decision tree algorithm. Decision tree is a supervised learning classification algorithm that aims to construct a mapping relationship between input variable X and target variable Y. The decision tree is represented by a tree structure, which consists of a root node, a parent node, a child node and a leaf node. There is a relative relationship between the parent and child nodes, and the child nodes can be created by splitting the parent node, while the child nodes can also be used as new parent nodes for further splitting. Each branch of the decision tree represents a judgment condition, while each leaf node represents a particular output result, as shown in Figure 8.

Flowchart of the procedure of the body shape detection device.

Schematic diagram of a decision tree.
Predictive approach
Assign the input sample X to one of the leaf nodes based on the characteristic attributes of the input sample X and the values taken from the decision tree.
The value of Y that occurs most frequently in the leaf node is used as the prediction category for the input X samples.
Purpose: The optimal model should contain only one category of data in the leaf nodes.
Experiments
Test subjects
A total of 89 undergraduate students were initially recruited for this trial. Data collection and preliminary screening were first conducted for all recruited subjects, and finally, data from 65 eligible subjects were included in the subsequent analysis, with 24 cases excluded. The exclusion process was carried out in two stages: pre-experiment screening and postexperiment data validation, to comprehensively ensure the accuracy and reliability of experimental data.
Pre-experiment screening criteria
Inclusion criteria
Healthy undergraduate students aged 18–22 years;
No history of spinal surgery or trauma; and
Able to understand the experimental procedures and cooperate with the researchers’ instructions, with the physical ability to complete posture adjustment and data collection tasks.
Exclusion criteria
Subjects diagnosed with spinal disorders, including but not limited to idiopathic scoliosis, congenital scoliosis, lumbar disc herniation, spinal stenosis, and spondylolisthesis;
Subjects with back muscle-related disorders, such as acute or chronic lower back myofascitis, lumbar muscle strain with obvious pain, or paraspinal muscle-involved myopathy;
Subjects with systemic diseases that may affect muscle function or posture control, such as neuromuscular diseases, rheumatoid arthritis, or severe osteoporosis;
Subjects with upper limb or lower limb motor dysfunction that hinders maintaining standard standing or sitting postures; and
Subjects who had used drugs interfering with muscle EMG signals within 72 hours before the experiment.
Postexperiment data validation and exclusion reasons
After the completion of the experiment, the research team conducted a strict review of the collected data, and excluded 24 cases of data for the following key reasons:
Subjectivity and inconsistency in posture classification application: The experimental postures (natural, ideal, and poor) rely on subjective judgment of both the subjects and researchers. During data review, it was found that 18 subjects had inconsistent posture expressions—for example, some subjects could not accurately distinguish between “natural sitting posture” and “ideal sitting posture” (e.g. maintaining a slightly straightened waist in natural sitting, which overlapped with the ideal sitting posture standard), or researchers had inconsistent judgment standards when guiding different subjects to adjust postures, leading to unqualified posture-related data that could not be used for variable analysis.
It should be noted that all subjects in this study were undergraduate students, which may limit the generalizability of the experimental results to other populations more susceptible to scoliosis and postural disorders—such as children aged 10 to 17 years (a high-incidence group for idiopathic scoliosis), adolescents, or elderly people over 60 years old (prone to postural disorders due to muscle atrophy and decreased spinal stability). This population limitation should be fully considered when interpreting the study findings, and follow-up studies are recommended to expand the subject age range to verify the applicability of the vest device in broader groups.
Experimental variables
The experimental variables included the subjects’ ATR of T6 and L3, the direction of scoliosis, and the paraspinal muscle EMG signals ofT6 and L3 in natural standing posture, ideal standing posture, natural sitting posture, ideal sitting posture, and poor sitting posture (left-bent-legged and crossed legs, right-bent-legged and crossed legs, left-side one-armed chinrest sitting, and right-side one-armed chinrest sitting, as shown in Table 1.
Description of postures.

Methods
Methods of determining scoliosis and experimental procedures
Scoliosis assessment and experimental protocol
Scoliosis screening and evaluation were conducted in accordance with the Chinese national standard
41
“Screening for Spinal Curvature Abnormalities in Children and Adolescents” issued by the Standardization Administration of China and the National Health and Family Planning Commission of the People's Republic of China. The assessment includes the following steps:
General examination: The examiner observes shoulder symmetry, scapular alignment and equality, symmetry of the lumbar concavity, and any deviation or tilt of the spinous processes from the midline. Forward bending test: The participant bends forward approximately 90 degrees with hands placed between the knees. The examiner observes any asymmetry in the thoracic or lumbar region, particularly a rib hump or paravertebral prominence. A positive test suggests scoliosis. Scoliometer measurement: During the forward bending position, a scoliometer is used to measure the ATR at the levels of T6 and L3. An ATR ≥5° raises strong suspicion of scoliosis, with severity graded as follows: grade 1 (ATR ≥5° and <7°), grade 2 (ATR ≥7° and <10°), and grade 3 (ATR ≥10°). sEMG Sensor Placement and Standardization Procedure
sEMG electrodes were placed bilaterally along the paravertebral muscles at T6 and L3 following a standardized protocol to ensure consistency and reproducibility: Skin preparation: The skin over T6 and L3 was cleaned with 75% ethanol wipes to reduce impedance and improve signal quality. Abrasive gel or prepping gel was applied gently if necessary, in accordance with SENIAM recommendations. Electrode positioning: For the T6 site, electrodes were positioned 2 cm lateral to the spinous process of the sixth thoracic vertebra. For L3, electrodes were placed 2 cm lateral to the spinous process of the third lumbar vertebra. All electrodes were aligned parallel to the muscle fibers of the erector spinae. Sensor fixation and validation: Myoware muscle sensors with adhesive hydrogel electrodes were used. To ensure consistent placement across subjects, anatomical landmarks were palpated and marked by a trained practitioner. Interelectrode distance was fixed at 20 mm. Reliability and reproducibility assurance: Intra-operator consistency was confirmed through repeated measurements on a subset of participants. Signal quality was verified prior to formal data collection by checking baseline noise and impedance levels. A reference electrode was placed on a bony, nonactive area. Taking into account factors such as effect size and data variability, 20 repeated measurements were conducted for each posture. During testing, since the types of postures were not excessively numerous and each measurement required a relatively short duration, a fully randomized approach was adopted. The testing order of all postures was completely shuffled to generate a random sequence, thereby significantly mitigating fatigue effects and sequence effects.
The placement position of the electrode patch is shown in the Figure 9.
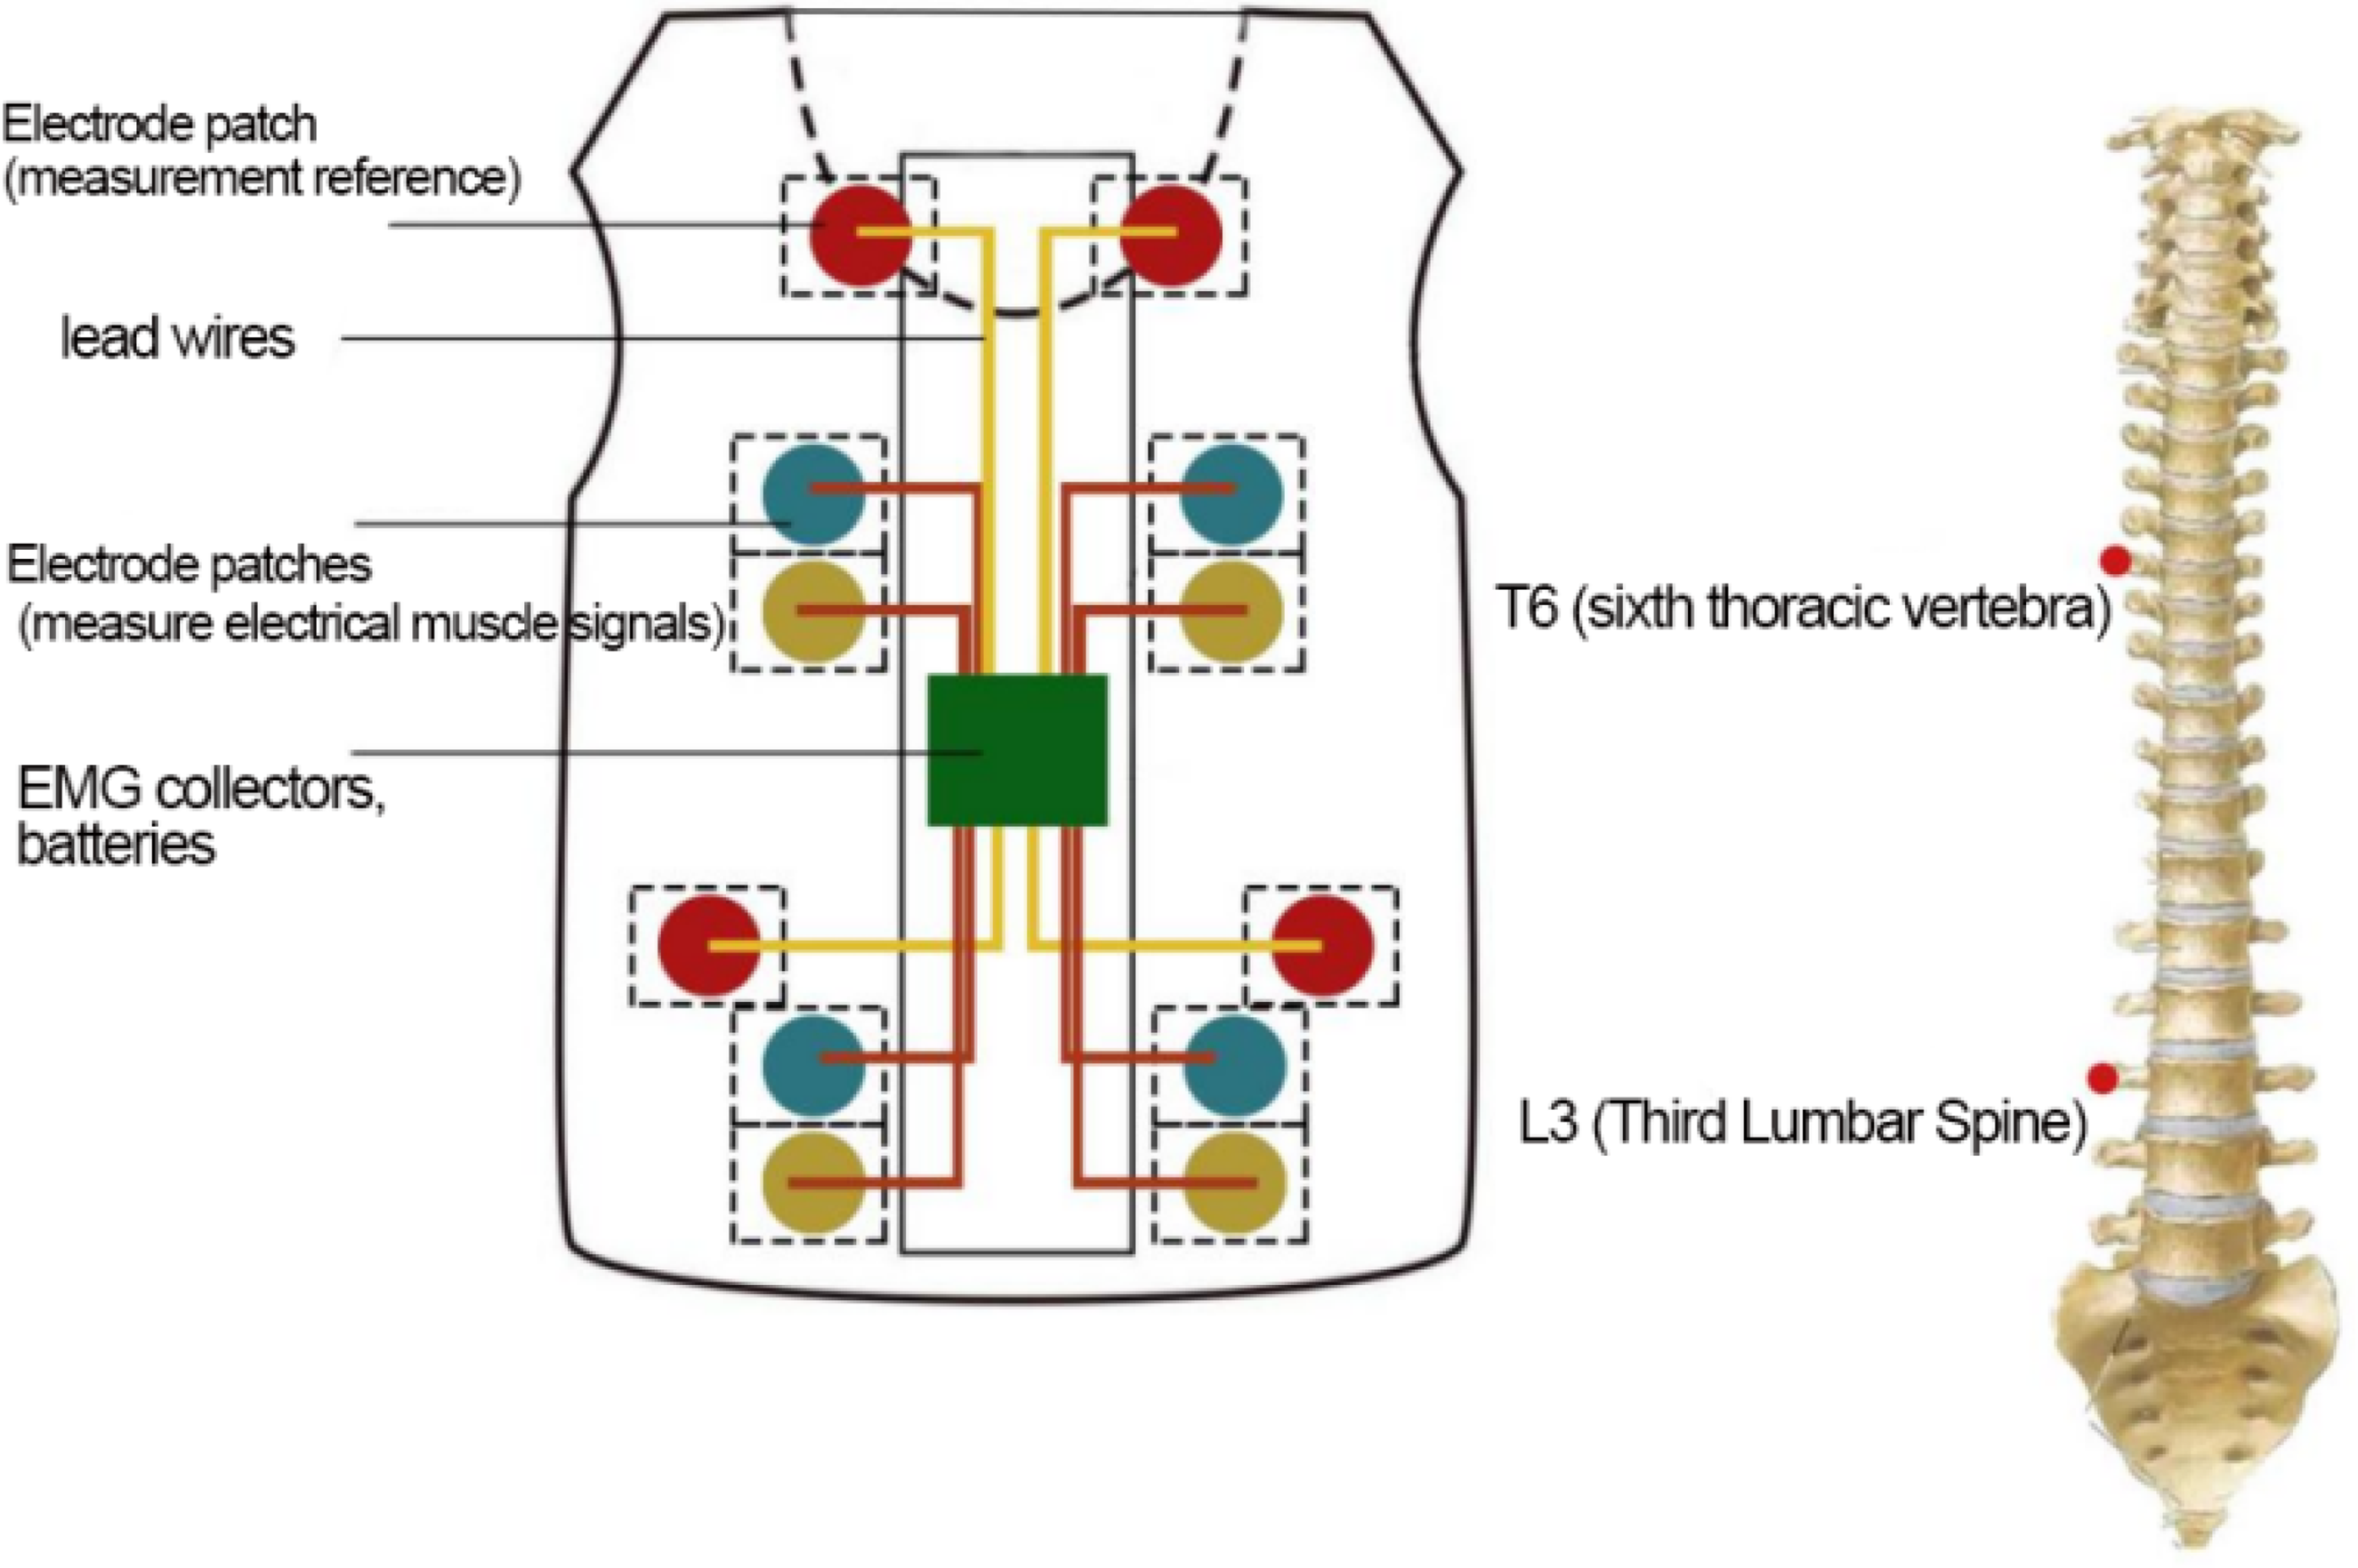
Schematic diagram of electrode patch placement.
Statistical methods
This study employed a stepwise statistical analysis strategy to systematically investigate the relationship between paravertebral EMG signals and the direction of spinal curvature: initial correlation analysis was conducted using Spearman's rank correlation; subsequently, independent samples t-test was applied to compare intergroup differences; finally, binary logistic regression modeling was performed for predictive assessment.
Spearman's rank correlation
As an initial exploratory step to identify potential monotonic trends in the relationship between the EMG signals and the direction of spinal curvature, Spearman’s correlation analysis was employed. The calculation formula for its coefficient is as follows:

As shown in Table 2, the results indicated a statistically significant negative correlation between the direction of scoliosis (Y) and the right-side EMG signal (R) (
This preliminary evidence suggests a systematic intrinsic relationship between the imbalance in bilateral paravertebral muscle EMG signals and the direction of spinal curvature: specifically, relatively enhanced right-side EMG signals are associated with right-sided curvature (Y = 0), while relatively enhanced left-side EMG signals are associated with left-sided curvature (Y = 1).
Given that the correlation analysis has revealed significant trends at a macroscopic level, an independent samples t-test was further employed to verify whether this difference manifests as a mean difference in EMG signal levels between the left-curvature group and the right-curvature group.
Independent samples t-test
The median of the EMG signal data was selected, and the value of the ATR of the vertebral body was named X, with a high value of 1 and low value of 0. The direction of the lateral curvature of the vertebral body was named Y, with a high left value of 1 and a high right value of 0. The median value of the ATR of the vertebral body was chosen as the median of the data.
Establish the test hypothesis and determine the test level
H0: μ = μ0 The side with lower EMG signal values corresponds to the true direction of spinal curvature. H1: μ ≠ μ0 the side with lower EMG signal values does not correspond to the true direction of spinal curvature. α = 0.001 Calculation of the test statistic
Under the precondition that μ = μ0 holds, the computed statistic is Based on the p-value, make inferential conclusions
The degree of freedom is v = n − 1 = 64, check schedule 2 and get t0.001/2,64 .Because t > t0.001/2,64, so p < 0.001, indicating that the difference is statistically significant, according to the α = 0.001 level reject H0, accept H1, that is, based on the available sample information, it can be assumed that there is a difference between the side with the lower value of the EMG signals of the muscle and the true direction of spinal curvature.

Analysis of standing and sitting postures
Experimental results
Analysis of standing and sitting postures
Correlation between direction of lateral bending and high amplitude of EMG signals in paravertebral muscles
The median of the EMG signal data of the paraspinal muscles at T6 and L3 were selected, and the side with the higher values of the EMG signals of the muscles was chosen for analysis and comparison. As shown in Tables 3 and 4, when the direction of lateral curvature measured at T6 and L3 was right, the EMG signals of the right side of the muscles showed higher values (p-value < 0.001); when the direction of lateral curvature measured at T6 and L3 was left, the EMG signals of the left side of the muscles showed higher values (p-value < 0.001). That is, the side with the higher value of muscle electrical signals was correlated with the true direction of spinal curvature.
2. Natural versus ideal posture
Results of Spearman correlation analysis between variables.
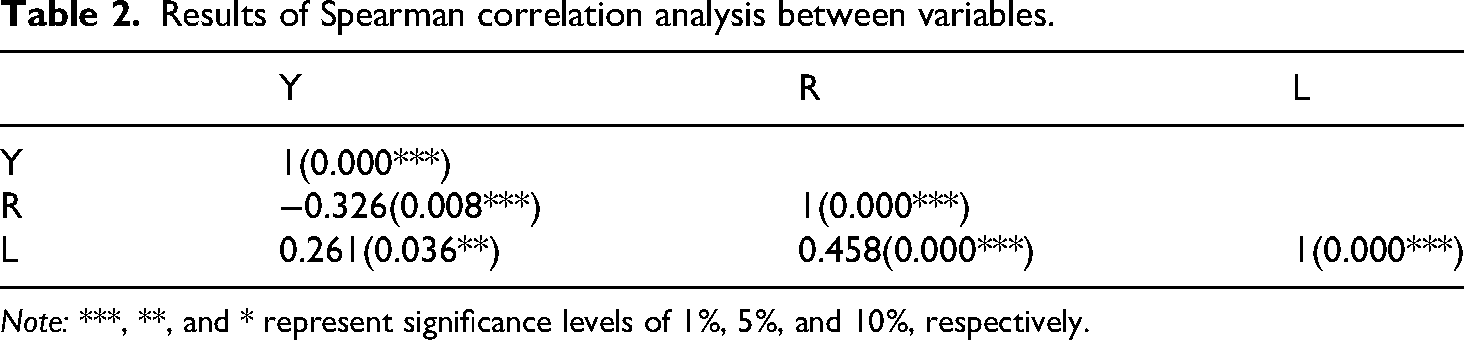
Note: ***, **, and * represent significance levels of 1%, 5%, and 10%, respectively.
Correlation between the direction of scoliosis and higher amplitude values of electromyographic signals in the paraspinal muscles at the T6 level during standing and sitting postures.
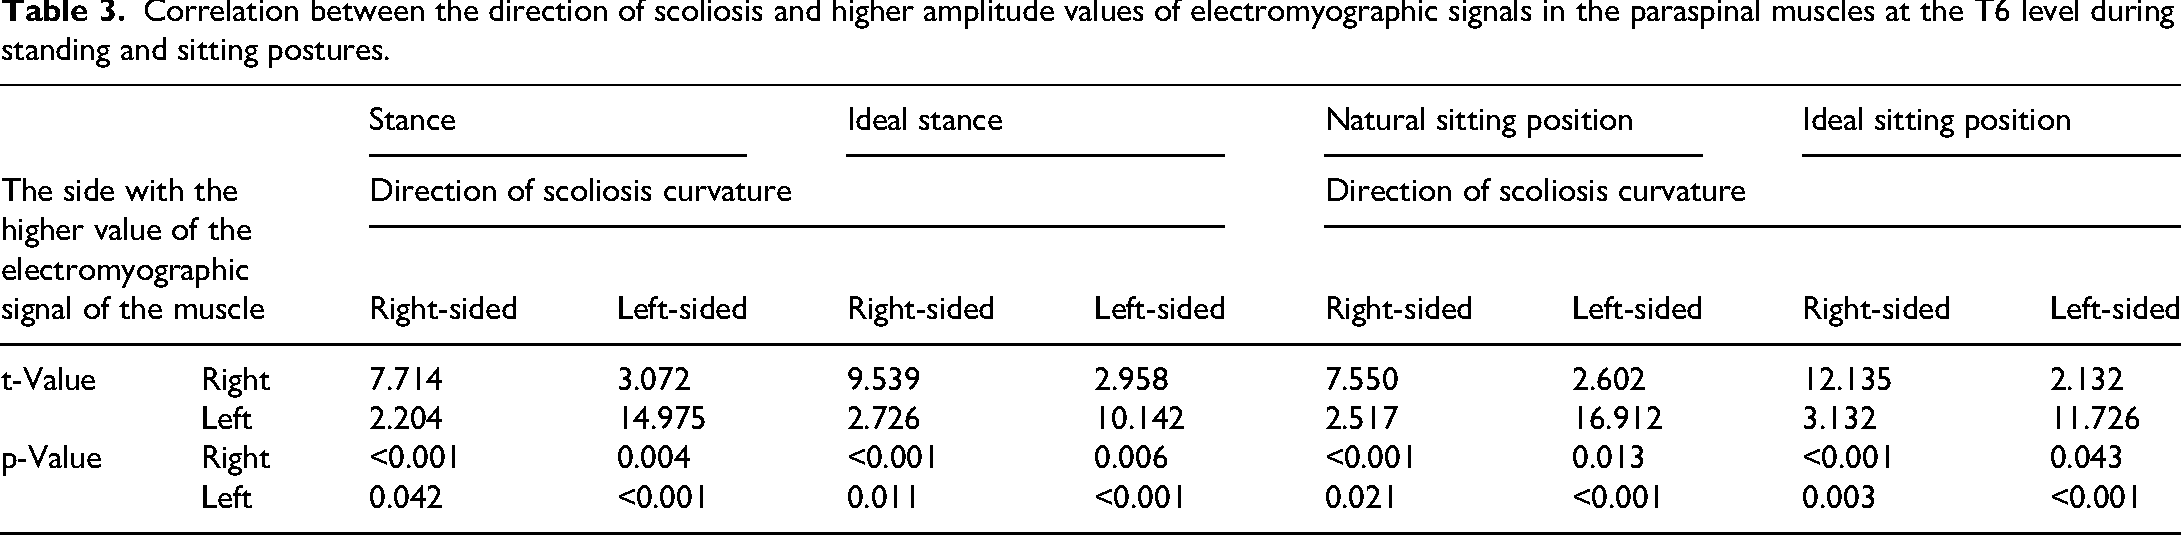
The natural standing and sitting postures ofT6 and L3 were grouped separately, and the ideal and natural postures of the EMG signals of the muscles in the same position and the same direction of lateral curvature were grouped into eight groups. The p-value of natural posture was smaller than that of ideal posture in six groups of data, that is, the side with higher values of EMG signals in natural posture had a greater correlation with the true spinal curvature direction.
Experimental results
Analysis of poor sitting postures
Correlation between the direction of spinal curvature and higher amplitude values of EMG signals in the paraspinal muscles.
As shown in Tables 5 and 6, regardless of whether the movement direction was to the left or right, when the measured spinal curvature direction at T6 and L3 was right-sided, the EMG signals on the right side consistently showed higher values (all p-values < 0.001); when the curvature direction was left-sided, the signals on the left side exhibited higher values (all p-values < 0.001). This indicates that under poor sitting postures, the side with higher EMG signal amplitudes is correlated with the true direction of spinal curvature.
2. Comparative analysis of natural, ideal, and poor sitting postures
Correlation between the direction of spinal curvature and higher amplitude values of electromyographic signals in the paraspinal muscles at the L3 level during standing and sitting postures.

Correlation between the direction of spinal curvature and higher amplitude values of electromyographic signals in the paraspinal muscles at the T6 level under poor sitting postures.

Correlation between the direction of spinal curvature and higher amplitude values of electromyographic signals in the paraspinal muscles at the L3 level under poor sitting postures.

Distribution of dependent variable Y.

Results of regression coefficients and odds ratio analysis.
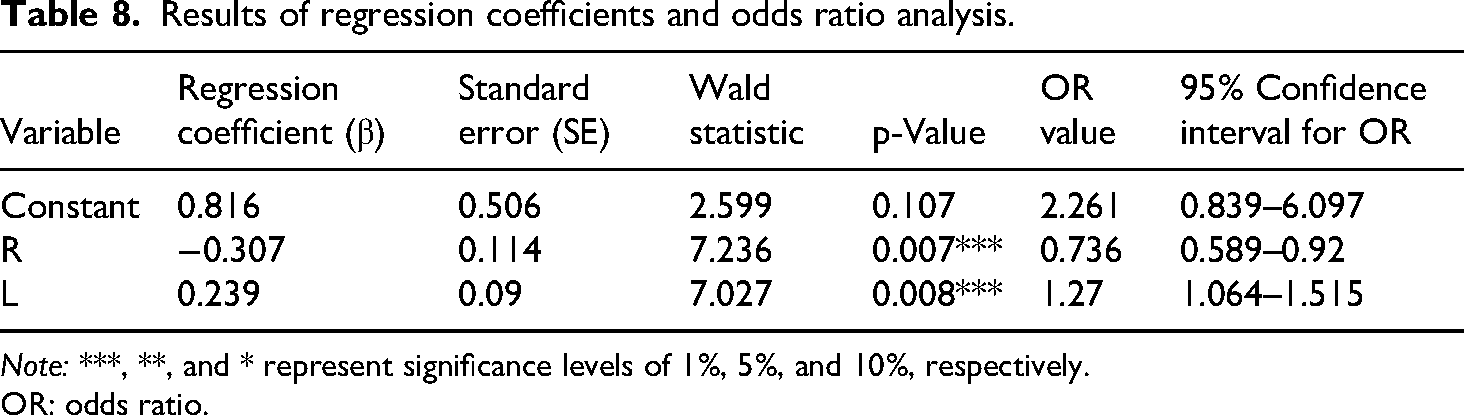
Note: ***, **, and * represent significance levels of 1%, 5%, and 10%, respectively.
OR: odds ratio.
Model classification performance indicators.

As shown in Tables 3 to 6, the p-values under poor sitting postures were all greater than or equal to those under natural and ideal standing/sitting postures. This indicates that in postures such as crossing legs or resting the cheek on one hand, the side with higher EMG signal values shows a stronger correlation with the true direction of spinal curvature.
Binary logistic regression
While the t-test confirmed the presence of statistically significant differences in EMG signals between curvature direction groups, this method does not quantify the predictive relationship between muscle activity patterns and spinal curvature direction. To establish a predictive model that can estimate the probability of curvature direction based on EMG characteristics, we proceeded to perform binary logistic regression analysis.
Logistic regression analysis was performed on the paravertebral muscle electrical signals and vertebral scoliosis direction using SPSS software. The median of the paravertebral muscle electrical signal data was selected, with the left side denoted as L and the right side as R, as shown in Tables 7 and 8. The vertebral scoliosis direction was named Y, where a higher left side was recorded as 1 and a higher right side as 0.
Distribution characteristics of dependent variable Y Model validity test
The likelihood ratio chi-square statistic is used to compare the goodness of fit of the model:
The calculated likelihood ratio chi-square value is 55.807, and for this model, p < 0.001, so the null hypothesis is rejected, indicating that the model is valid.
3. Analysis of regression coefficients and odds ratios (OR)
Logistic regression model (for the probability P that the dependent variable Y = 1):
Calculation of OR: 4. Model classification performance indicators


As shown in Table 9, the classification evaluation metrics indicate that the model demonstrates good predictive performance, with an accuracy of 0.908 and Area Under the Curve (AUC) of 0.843, suggesting that paravertebral muscle EMG signal indicators can effectively differentiate the direction of vertebral scoliosis.
In summary, the analytical methods employed in this phase systematically validated the relationship between EMG signals and the direction of spinal scoliosis. Spearman's correlation analysis first revealed a systematic intrinsic association between the imbalance of bilateral paraspinal muscle EMG signals and the direction of spinal curvature: specifically, enhanced right-side EMG signals were associated with right-side curvature (Y = 0), while enhanced left-side EMG signals were associated with left-side curvature (Y = 1), indicating a significant correlation between bilateral EMG signals and curvature direction; the t-test results showed p < 0.001, indicating statistical significance, suggesting a difference between the side with lower EMG signals and the actual direction of spinal curvature; Finally, logistic regression analysis was performed using SPSS software to establish a predictive model for paraspinal muscle EMG signals and vertebral lateral curvature direction, quantifying the predictive ability of EMG signals for curvature direction. The established predictive model achieved an accuracy rate of 0.908 and an AUC of 0.843. The study results indicate that enhanced left-side EMG signals are highly correlated with a higher probability of left-side curvature, while enhanced right-side EMG signals suggest a greater likelihood of right-side curvature. The study demonstrated high accuracy and reliability, providing an effective quantitative tool for clinically assessing the direction of spinal scoliosis.
Discussion
Various functional antihunchback products on the market can be broadly categorized into three types: restrictive devices, distance-measuring devices, and intelligent flexible wearable devices. (1) Restrictive products typically take the form of highly constrictive shape wear vests that use highly elastic materials to maintain users in an upright chest-and-waist posture. While these garments suppress hunchback posture in adolescents through tight compression, they cause significant discomfort and offer no therapeutic efficacy for treating existing hunchback conditions. (2) Distance-measuring products are designed primarily to prevent users from leaning too close to their desks during work or study, thereby aiming to prevent both myopia and hunchback. However, these products have notable limitations: they provide no treatment for existing hunchback, offer insufficient detection of spinal curvature, have restricted application scenarios, and generally fail to deliver satisfactory results in hunchback prevention. (3) Intelligent flexible wearable devices can effectively prevent hunchback posture through postural monitoring, but since they primarily offer alert functions without active intervention, their therapeutic effect on established hunchback conditions remains limited.
The advancements and distinctive features of the wearable system proposed in this article are mainly reflected in the following four aspects:
Comprehensiveness: The wearable system proposed in this article incorporates three operational modes: intelligent posture monitoring mode, rehabilitation training correction mode, and vibration alert mode, to comprehensively achieve the goal of preventing and treating postural kyphosis. A flexible posture monitoring device, conforming to the user's spine, transmits spinal curvature data to a mini-program on a mobile terminal, which displays the degree of spinal curvature in the sagittal plane in real-time. Through in-depth data analysis and interpretation algorithms, the system generates a kyphosis assessment report and a personalized rehabilitation training plan, encouraging users to actively participate in their rehabilitation. By collecting spinal curvature data throughout the rehabilitation process and automatically comparing it against background benchmark data, the system produces a training action quality report, effectively enhancing the efficiency of user rehabilitation. Additionally, equipped with a linear motor, the system triggers automatic vibration alerts when the spinal inclination exceeds a user-set threshold, prompting the user to return to a normal posture. Therapeutic Effectiveness: The root cause of kyphosis lies in muscle imbalance resulting from long-term poor habits such as desk work and looking down. If users wear corrective belts for extended periods, it may exacerbate postural issues. This is because the body is merely forced into a correct position without addressing the underlying problems: fatigued muscles are not relaxed, and weak muscles are not strengthened, ultimately worsening muscle imbalance over time. As demonstrated in a study by Rattaporn Sihawong et al., addressing postural issues fundamentally requires active exercise of weak muscle groups, combined with stretching and relaxation of overused muscles. Balancing muscle strength naturally alleviates kyphosis. Therefore, this system fills a gap in the market by offering targeted rehabilitation plans based on the frequency, angle, and duration of poor postures detected in the intelligent monitoring mode. It also monitors the correctness of user actions during training, ensuring each user can overcome kyphosis-related issues with maximum efficiency. Precision: The wearable system utilizes a hardware design incorporating six curvature sensors positioned at T1 (first thoracic vertebra), T5 (fifth thoracic vertebra), T8 (eighth thoracic vertebra), T10 (tenth thoracic vertebra), L1 (first lumbar vertebra), and L3 (third lumbar vertebra) to accurately collect spinal curvature data. This enables precise real-time visualization of spinal curvature in the mini-program and generates detailed kyphosis assessment reports, allowing users to clearly understand their spinal condition. Comfort: Restrictive products operate on the principle of forcibly stretching the back using external pressure—a straitjacket-like correction method that results in a strong sense of constraint, bulky and stuffy wear, and generally poor user experience. In contrast, the custom vest adopted in this project is solely used for securing the device, offering no feeling of restraint during use. Moreover, the vest is constructed with a medium-to-high elasticity ribbed cotton-polyester knitted fabric, which provides good breathability and flexibility, ensuring a comfortable wearing experience even in summer.
The experimental data from Tables 1 to 5 aim to verify whether the system can detect scoliosis through the electrical signals of human back muscles during daily transitions between standing and sitting postures. The results demonstrate that the side with higher EMG signal values correlates with the actual curvature direction of the spine, and this correlation becomes more pronounced under poor sitting postures. This indicates that the system provides stable qualitative diagnostic efficacy for scoliosis. It also suggests that poor sitting posture may increase muscle load and adversely affect postural stability and comfort. Therefore, it is recommended to avoid maintaining poor sitting positions for extended periods to reduce muscle burden and enhance postural stability and comfort. The intelligent posture monitoring mode allows more accurate assessment of a patient's scoliosis condition, thereby guiding users to improve sitting habits, formulate treatment plans, and promote spinal health.
The experimental results confirm that the wearable system proposed in this study can effectively detect spinal curvature abnormalities by analyzing the asymmetry of paraspinal muscle electrical signals under different posture conditions. Data analysis reveals a significant correlation between higher sEMG signal amplitude and the direction of spinal curvature, consistent with existing biomechanical theories, which suggest that muscle imbalance promotes the progression of spinal deformities. Notably, this correlation is more pronounced under poor sitting postures, indicating that such postures exacerbate muscle asymmetry and may accelerate spinal degeneration. The system enhances diagnostic reliability by integrating multimodal data (curvature and sEMG), outperforming single-sensor systems. Sensor fusion using an extended Kalman filter improves posture estimation accuracy, while a logistic regression model provides a robust tool for predicting curvature direction. The established predictive model achieves an accuracy of 0.908 and an AUC of 0.843, highlighting the system's clinical potential.
However, the study population was limited to university students, which may affect the generalizability of the results to younger or older populations more prone to spinal deformities. Future studies should increase the sample size, include a broader age range, and incorporate individuals with clinically diagnosed scoliosis to validate the system's effectiveness across different populations.
Conclusion
This study developed and validated a wearable system for real-time monitoring and rehabilitation of spinal curvature abnormalities and providing rehabilitation guidance for individuals with mild to moderate spinal curvature abnormalities. The system comprehensively assesses spinal health by combining curvature sensors and sEMG sensors, and achieves high diagnostic accuracy through advanced signal processing and machine learning technologies. Experimental results indicate that muscle electrical activity asymmetry is a reliable indicator for determining the direction of spinal curvature, particularly under poor posture conditions. Compared to existing solutions, this system offers several advantages, including portability, comfort, real-time feedback, and personalized rehabilitation guidance. It represents a significant advancement in the field of spinal deformity prevention and noninvasive management, and can be applied to home health monitoring and clinical environments. Future research will focus on expanding the dataset to include a more diverse population, optimizing algorithms to enhance real-time performance on embedded systems, and conducting long-term usability studies to assess the system's impact on posture correction and spinal health improvement.
Footnotes
Acknowledgements
This work was supported by Supply and Demand Cooperation Employment and Education Project of the Ministry of Education (2023122638581), the Special Funds for Cultivation of Science and Technology Innovation for Guangdong University Students (pdjh2024a097), College Students’ Innovation and Entrepreneurship Training Program (202410572219), Humanities and Social Sciences Research Project of Guangzhou University of Chinese Medicine in 2024 (2024ZXPY07). This project has received funding from the Platform Project of the Big Data Research Center for Traditional Chinese Medicine at Guangzhou University of Chinese Medicine (No. A1-2601-25-439-127Z102).
Authors’ contribution
We confirm that the manuscript has been named authors and that there are no other persons who satisfied the criteria for authorship but are not listed. We further confirm that the order of authors listed in the manuscript has been approved by all of us. We understand that the Corresponding Author is the sole contact for the Editorial process. He is responsible for communicating with the other authors about progress, submissions of revisions and final approval of proofs. All authors as follows: HH and HC is involved in methodology, project administration, writing—original draft; MF and CZ in investigation, methodology, software, visualization, writing—editing; DJ and QS in investigation, conceeptualization and data curation; WN and ZX in data curation, investigation; GW in conceptualization, funding acquisition, resources, supervision, and validation.
Funding
The author(s) disclosed receipt of the following financial support for the research, authorship, and/or publication of this article: This project has received funding from the Platform Project of the Big Data Research Center for Traditional Chinese Medicine at Guangzhou University of Chinese Medicine (No. A1-2601-25-439-127Z102).This work was supported by Supply and Demand Cooperation Employment and Education Project of the Ministry of Education (2023122638581), the Special Funds for Cultivation of Science and Technology Innovation for Guangdong University Students (pdjh2024a097), College Students’ Innovation and Entrepreneurship Training Program (202410572219), Humanities and Social Sciences Research Project of Guangzhou University of Chinese Medicine in 2024 (2024ZXPY07).
Declaration of conflicting interests
The authors declared no potential conflicts of interest with respect to the research, authorship, and/or publication of this article.
Data availability statement
All relevant data are within the manuscript and its Supporting Information files.
Additional information
We declare that this manuscript is original, has not been published before and is not currently being considered for publication elsewhere. The datasets used and analyzed during the current study is available from the corresponding author on reasonable request. We have obtained informed consent from all subjects and/or their legal guardians.