
Abstract
The purpose of the present study was to examine the differences in gait variability in terms of spatiotemporal, sub-gait cycle, ground reaction force, and the joint profiles of kinematics and kinetics between older individuals with and without risk of potential cognitive impairment, and to derive the crucial features to discriminating the older adults with future risk cognitive decline by using partial least squares-discriminant analysis. A total of 90 community-dwelling older adults aged over 65 years underwent cognitive function assessment and were divided into three groups depending on cognitive assessment score. The participants’ level-walking was analyzed by using three-dimensional instrumented gait analysis. The coefficient of variation was extracted and then comparatively analyzed depending on the stages of the cognitive decline. To identify the most important contributor when differentiating the older adults with a risk of future cognitive decline, partial least squares-discriminant analysis was applied, and the discriminative power of the coefficients confirmed as features of great importance were investigated via the receiver operating characteristic area under the curve. The differences in gait variability were found mainly between the suspected dementia groups and other groups, especially in joint dynamics variables. Through the partial least squares-discriminant analysis, the discriminative features were found as follows: the mid-stance, the moments, and the power in the hip, knee, and ankle joints. In addition, the discrimination model was found to differentiate well between the three groups. The classification accuracy of intact cognition, diminished cognition, and suspected dementia was 0.857, 0.710, and 0.857, respectively. These findings mean that gait variability changes according to continuous cognitive decline, especially in sub-gait cycles and joint biomechanics, and suggest that measures of variation can be used as predictors to identify older individuals with a risk of potential cognitive impairment.
Introduction
Dementia is a neurodegenerative disease that is difficult to treat. Therefore, the optimal approach to prevent the progression and onset of dementia is to screen the prodromal/preclinical stage and take appropriate measures. In this regard, many studies have investigated gait characteristics as biomarkers for predicting the onset of dementia.1–3 Mainly, spatiotemporal variables have been investigated, and among them, gait speed has been suggested as a key predictor. However, using gait speed as a predictor requires a long follow-up period and provides lower sensitivity, which has been previously highlighted as a limitation. 3
In addition to spatiotemporal variables, the coefficient of variation (CoV) is being examined in older adults with mild cognitive impairment (MCI) and dementia.4–7 Lindh-Rengifo et al. 4 reported that individuals with MCI have greater gait variability than individuals without cognitive impairment, but this study investigated only step-related variability. Pieruccini-Faria et al. 5 reported that the group with normal cognitive function had lower stride time and stride length CoVs than the groups with MCI and dementia. Similarly, in the meta-analysis done by Chiaramonte et al., 6 it was reported that patients with dementia had higher stride time, stride length, and swing time CoVs. On the other hand, Lamoth et al. 7 reported that there was no significant difference between the stride time CoVs of the cognitively impaired and cognitively normal groups, although the MMSE score of the cognitively impaired group was 10 or more points lower than that of the cognitively normal group. These differences suggest that even though the participants in the aforementioned studies had received a medical diagnosis, the specificity when using the stride and step variables for MCI and dementia may be too low, causing discrepancies. Furthermore, among community-dwelling older adults, there are individuals with subjective cognitive decline (SCD) and early or late MCI, which represent intermediate stages between normal cognition and dementia. In this respect, using spatiotemporal variables for dementia prognosis may be challenging in the case of individuals with potential cognitive decline. To date, there are very few studies that have examined CoVs of other variables other than step and stride (e.g. gait speed, cadence, sub-gait cycle, kinematics, kinetics). Rucco et al. 8 reported that there are no differences in the single task condition CoVs of cycle time, swing time, cadence, and double limb support phase between individuals with Alzheimer's disease (AD), behavioral variant of frontotemporal dementia (bvFTD), and healthy subjects. Choi et al. 9 examined the correlations between gait CoV and cognitive impairment stage, and they confirmed that the CoVs of cadence, single limb support time, double limb support time, and walking speed have no correlation with MCI, and AD. To our knowledge there is no study that investigated the CoVs in terms of kinematics and kinetics.
In addition, many community-dwelling older adults have not undergone dementia screening and specialized and accurate dementia-related assessment for a variety of reasons.
According Parker et al., 10 the prevalence of no reported dementia-related diagnosis in older individuals is more than 80%. According to Lang et al., 11 the prevalence of undiagnosed dementia is high globally, with a pooled rate of 61.7%. Chen et al. 12 reported that the rate of undetected dementia was 93.1%. In addition, McGrath et al. 13 reported that the prevalence of unreported dementia was 91.4% when using self-reported dementia-related diagnosis in individuals aged 65 years or older with a cognitive impairment consistent with dementia (CICD). To solve these issues, it may benefit to investigate an alternative approach that has less invasiveness, less time spent and less cost compared to conventional medical diagnostic price (e.g. CBC and CSF test, neuroimaging etc.). In this respect, examining the gait variables in more detail, targeting community-dwelling individuals with potential cognitive decline and mild or moderate cognitive impairment is necessary.
Gait is achieved by combining, compensating, and correcting for different parameters because walking is a complex movement involving about 1000 muscles, 200 bones, 100 joints and the interaction of the motor, sensory and cognitive systems. 14 Hence, multicollinearity between the variables must be considered. For this reason, partial least squares-discriminant analysis (PLS-DA) was used in the present study. PLS-DA is a combination of principal component analysis (PCA) and regression analysis. 12 It is free from restrictions regarding multicollinearity, normality, and the number of samples, and can be used for classification and discriminative parameter selection.15,16
Therefore, in the present study, the features of gait variability and their performance in differentiating the stages of cognitive decline were investigated. To this purpose, (a) we recruited community-dwelling older adults through convenience and snowball sampling, (b) the participants were assessed using K-MoCA (the Korean version of the Montreal Cognitive Assessment), (c) gait variability variables were extracted using a three-dimensional motion capture and analysis system, (d) finally, key features were selected using PLS-DA and were used to stratify the stages of cognitive decline and discriminative ability was examined.
Methods
Study design and participants
The present cross-sectional study (October 2019–February 2022) was conducted at the Sensory Informatics & Neuromechanics Laboratory, Division of Biomedical Engineering, College of Engineering, Jeonbuk National University, Jeonju, KOREA. A total of 90 community-dwelling older adult men over 65 years of age were recruited using convenience and snowball sampling. The inclusion criteria are as follows: (a) age ≥ 65 years, (b) no previous dementia diagnosis, (c) ability to walk without aid or third-person assistance, (d) no medical history of severe musculoskeletal, cardiovascular and cerebrovascular disease during the previous 1 year. Those who were diagnosed with dementia, those who had severe musculoskeletal, cardiovascular and cerebrovascular disease over the past year, and those who were unable to walk without aids and support were excluded. Participants were given written and verbal information about the content and procedure of the study and provided written informed consent. Participants in this study had no neuro-musculoskeletal disease and were able to walk without assistive devices or assistance from others. Weight and height were measured for all participants, and they reported their age and years of completed education. The cognitive functions of all participants were assessed using the Korean version of the Montreal Cognitive Function Assessment (K-MoCA). Cognitive testing was followed by a level ground walking experiment. All procedures of the present study were approved by the institutional review board of Jeonbuk National University (JBNU IRB File No. 2019-09-015-001), and the present study was conducted according to the guidelines of the Declaration of Helsinki.
Cognitive assessment and group classification
Participants’ cognitive function was assessed using K-MoCA, which is considered a reliable screening tool for individuals with mild cognitive decline. A cut-off score followed the study done by Lee et al. 17 Participants were divided into three groups as follows: the intact cognitive function groups (ICF, K-MoCA score ≧ 23 points), the diminished cognitive function group (DCF, 18 points ≦ K-MoCA score < 23 points), and the suspected dementia cognitive function group (SDCF, K-MoCA score ≦ 17 points).
Three-dimensional level-walking capture instruments and procedure
A total of 17 infrared light-emitting diodes (IRED, Smart marker, Northern Digital Inc., Canada) were placed on the participant's lower limbs and trunk according to the motion module marker guide (MusculoGraphics Inc., USA). To collect IRED's signals, three position sensors (Optotrak Certus, Northern Digital Inc., Canada) were used. A total of 4 force plates (4060-08, Bertec Co., Ltd, USA) were used to capture the ground reaction force (GRF). Motion capture software (First principle, Northern Digital Inc., Canada) was used to synchronize all hardware and capture the participants’ gait.
Level walking procedure and gait analysis
After cognitive assessment, all participants were asked to walk a distance of at least 10 meters at their preferred pace. Each participant's three walking trials were used for further gait analysis using software for interactive musculoskeletal modeling and analysis (SIMM, Motion Analysis Corp., USA).
In this study, the coefficient of variance (CoV) of gait parameters was extracted and analyzed. Each CoV is as follows: the spatiotemporal CoVs were stride length, step length, cadence, gait velocity, stride phase duration (Stride_D), stance phase duration (Stance_D), and swing phase duration (Swing_D); the sub-gait cycle CoVs were loading response portion (LRp), mid-stance portion (MSp), terminal-stance portion (TSp), and pre-swing portion (PSp); the kinematics CoVs were joint angles of the hip, knee, and ankle (HA, KA, AA, respectively); the kinetics CoVs were that moment at joints of hip, knee, and ankle (HM, KM, AM, respectively), and that hip joint power (HP), knee joint power (KP), and ankle joint power (AK); the GRF CoVs were anteroposterior GRF (AP GRF), mediolateral GRF (ML GRF), and vertical GRF (V GRF). An illustration of gait terminology is presented in Figure 1.

Gait terminology explanation.
Spatiotemporal and sub-gait cycle CoVs are calculated as follows: CoV = (standard deviation/mean) × 100. The CoVs of kinematics, kinetics, and GRF are calculated according to Smith. 18
Statistical analysis of the group CoVs
Regarding demographic variables, Kruskal–Wallis one-way ANOVA was used to test for group differences. Through this test result, the covariates used for the statistical analysis of the CoVs were found.
To evaluate the statistical significance of the CoVs, the normality of all CoV variables was first tested using the Shapiro–Wilk test. According to the result of the normality test, the statistical significance test was performed for the three groups using ANCOVA for parametric variables and Quade ANCOVA for non-parametric variables. When testing the significant difference between the SDCF and the other groups, Quade ANCOVA was used because the number of samples of the SDCF was less than 30. Statistical analysis for the three groups was performed using Statistical Package for the Social Sciences version 26.0.1 (SPSS, IBM Corp., USA).
Partial least square-discriminant analysis (PLS-DA)
PLS-DA is a combination of partial least square and discriminant analysis. PLS is a combination of principal component and regression analysis. 15 It allows data with a large number of highly collinear, inter-related variables (gait parameters) with relatively few observations (participants) to be processed.15,19 For a more detailed explanation, the reader is referred to the studies.16,19
First, all CoV variables were pre-processed by a z-transformation, 20 and then PLS-DA was used to classify the stages of cognitive decline. In PLS-DA, all CoVs were the independent variables, and the dependent variable was the stages of cognitive decline (i.e. each group). To avoid overfitting, leave-one-out cross-validation (LOOCV) was used. 21 The optimal number of latent variables (LVs) in the PLS-DA model was determined using the error rate (ER) value 22 obtained by LOOCV. The ER was determined by comparing the original group and the group membership predicted by LOOCV. 22
Second, to determine which CoV variables are important to the PLS-DA model, the Variable Importance for Projection (VIP) was examined. Through the VIP, the contribution of each CoV variable to the classification performance of the PLS-DA model can be determined. CoV variables with a VIP > 1.0 indicate that a parameter makes a significant contribution to the classification model.
Finally, the discriminatory power of the PLS-DA model was assessed using the receiver operating characteristic (ROC) curve and the area under the curve (AUC). The PLS-DA was conducted using XLSTAT 2022 (Addinsoft, France).
Results
Participant characteristics
The characteristics of the three groups are presented in Table 1.
Demographics and K-MoCA score.

Mean ± standard deviation; ICF: intact cognitive function; DCF: diminished cognitive function; SDCF: suspected dementia cognitive function.
* Significance difference with ICF, p < 0.05.
Significance difference with DCF, p < 0.05.
Significance difference with SDCF, p < 0.05.
Age increased as cognitive function decreased, and there was a significant difference between ICF and SDCF. Years of education and K-MoCA scores were significantly different between the three groups, while no significant difference existed in the case of height and weight. Therefore, age and years of education were included in the PLS-DA model.
The CoVs of spatiotemporal and sub-gait cycles in the three groups
Tables 2 and 3 show the CoVs of spatiotemporal and sub-gait cycles, respectively.
The spatiotemporal CoVs in the three groups.

Mean ± standard deviation; Unit: %; ICF: intact cognitive function; DCF: diminished cognitive function; SDCF: suspected dementia cognitive function.
The CoVs of sub-gait cycles in the three groups.

Mean ± standard deviation; ICF: intact cognitive function; DCF: diminished cognitive function; SDCF: suspected dementia cognitive function; LR: loading response phase; MSt: mid-stance phase; TSt: terminal-stance phase; PSw: pre-swing phase.
All spatiotemporal CoVs tended to increase as the cognitive function decreased, but there was no statistical significance between the three groups.
Similarly, the CoVs of sub-gait cycles showed an increasing tendency, although a significant difference between the three groups was not found.
The CoVs in gait kinematics and kinetics
In the CoVs of joint angle (Table 4), overall, the SDCF had the highest CoVs compared to other groups. The hip angle CoV differed significantly between the SDCF and other groups, while a significant difference between the CoV of the DCF and SDCF was observed in the knee angle. There were no differences in the ankle joint angle.
Joint angle CoVs in the three groups.
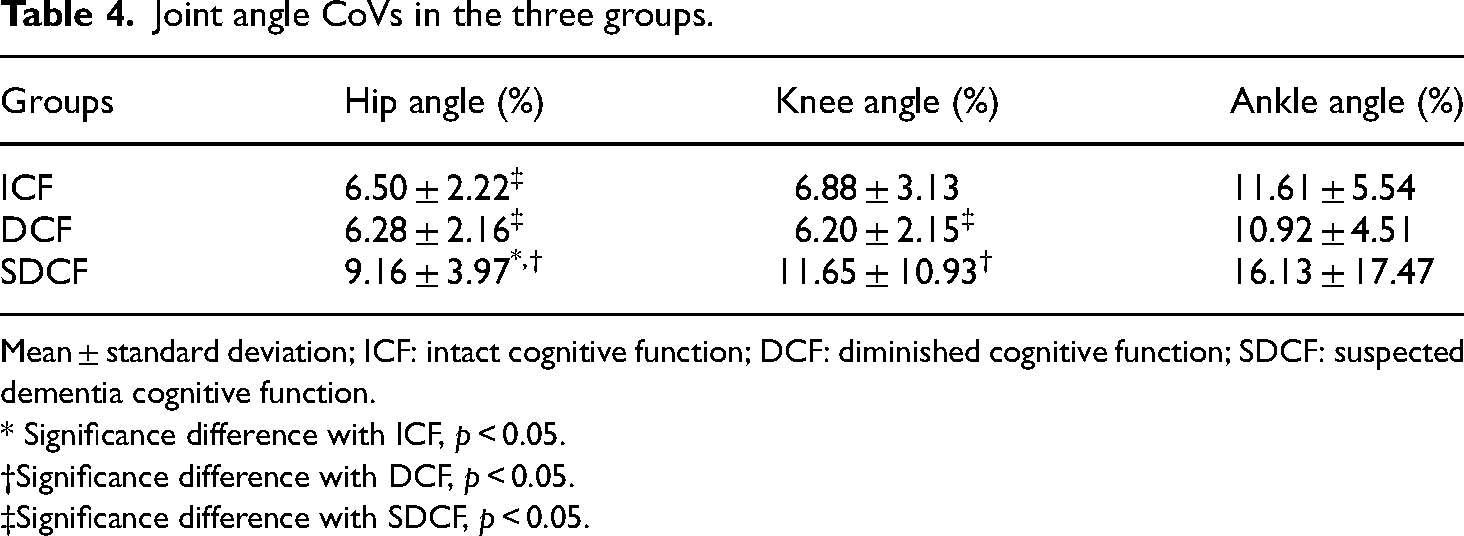
Mean ± standard deviation; ICF: intact cognitive function; DCF: diminished cognitive function; SDCF: suspected dementia cognitive function.
* Significance difference with ICF, p < 0.05.
Significance difference with DCF, p < 0.05.
Significance difference with SDCF, p < 0.05.
For the joint moments (Table 5), although the CoVs increased with the reduction of cognitive function, significant differences were only presented in the hip moment and support moment, which were observed between SDCF and other groups.
Joint moment CoVs in the three groups.

Mean ± standard deviation; ICF: intact cognitive function; DCF: diminished cognitive function; SDCF: suspected dementia cognitive function.
* Significance difference with ICF, p < 0.05.
Significance difference with DCF, p < 0.05.
Significance difference with SDCF, p < 0.05.
Similarly, the SDCF’ CoVs in the hip and the ankle power were significantly greater than that of other groups (Table 6).
Joint power CoVs in the three groups.

Mean ± standard deviation; ICF: intact cognitive function; DCF: diminished cognitive function; SDCF: suspected dementia cognitive function.
* Significance difference with ICF, p < 0.05.
Significance difference with DCF, p < 0.05.
Significance difference with SDCF, p < 0.05.
For the GRF’ CoVs (Table 7), statistically significant differences between the SDCF and other groups were observed solely in the case of Vertical GRF.
CoVs of GRF in the three groups.

Mean ± standard deviation; GRF: ground reaction force; ICF: intact cognitive function; DCF: diminished cognitive function; SDCF: suspected dementia cognitive function; AP: anteroposterior; ML: mediolateral.
* Significance difference with ICF, p < 0.05.
Significance difference with DCF, p < 0.05.
Significance difference with SDCF, p < 0.05.
PLS-DA classification performance and the gait CoVs contributor
Figure 2 shows the AUCs of the PLS-DA model differentiating each group. The PLS-DA model presented a good discriminative ability since all the AUCs were higher than 0.700. Classification performance for each stage of the PLS-DA model in this study was as follows: The AUC of ICF classification was 0.857 (S.E. 0.071, 95% CI 0.719–0.995); the AUC of DCF classification was 0.710 (S.E. 0.009, 95% CI 0.516–0.905); and the AUC of SDCF classification was 0.840 (S.E. 0.127, 95% CI 0.592–1.000).
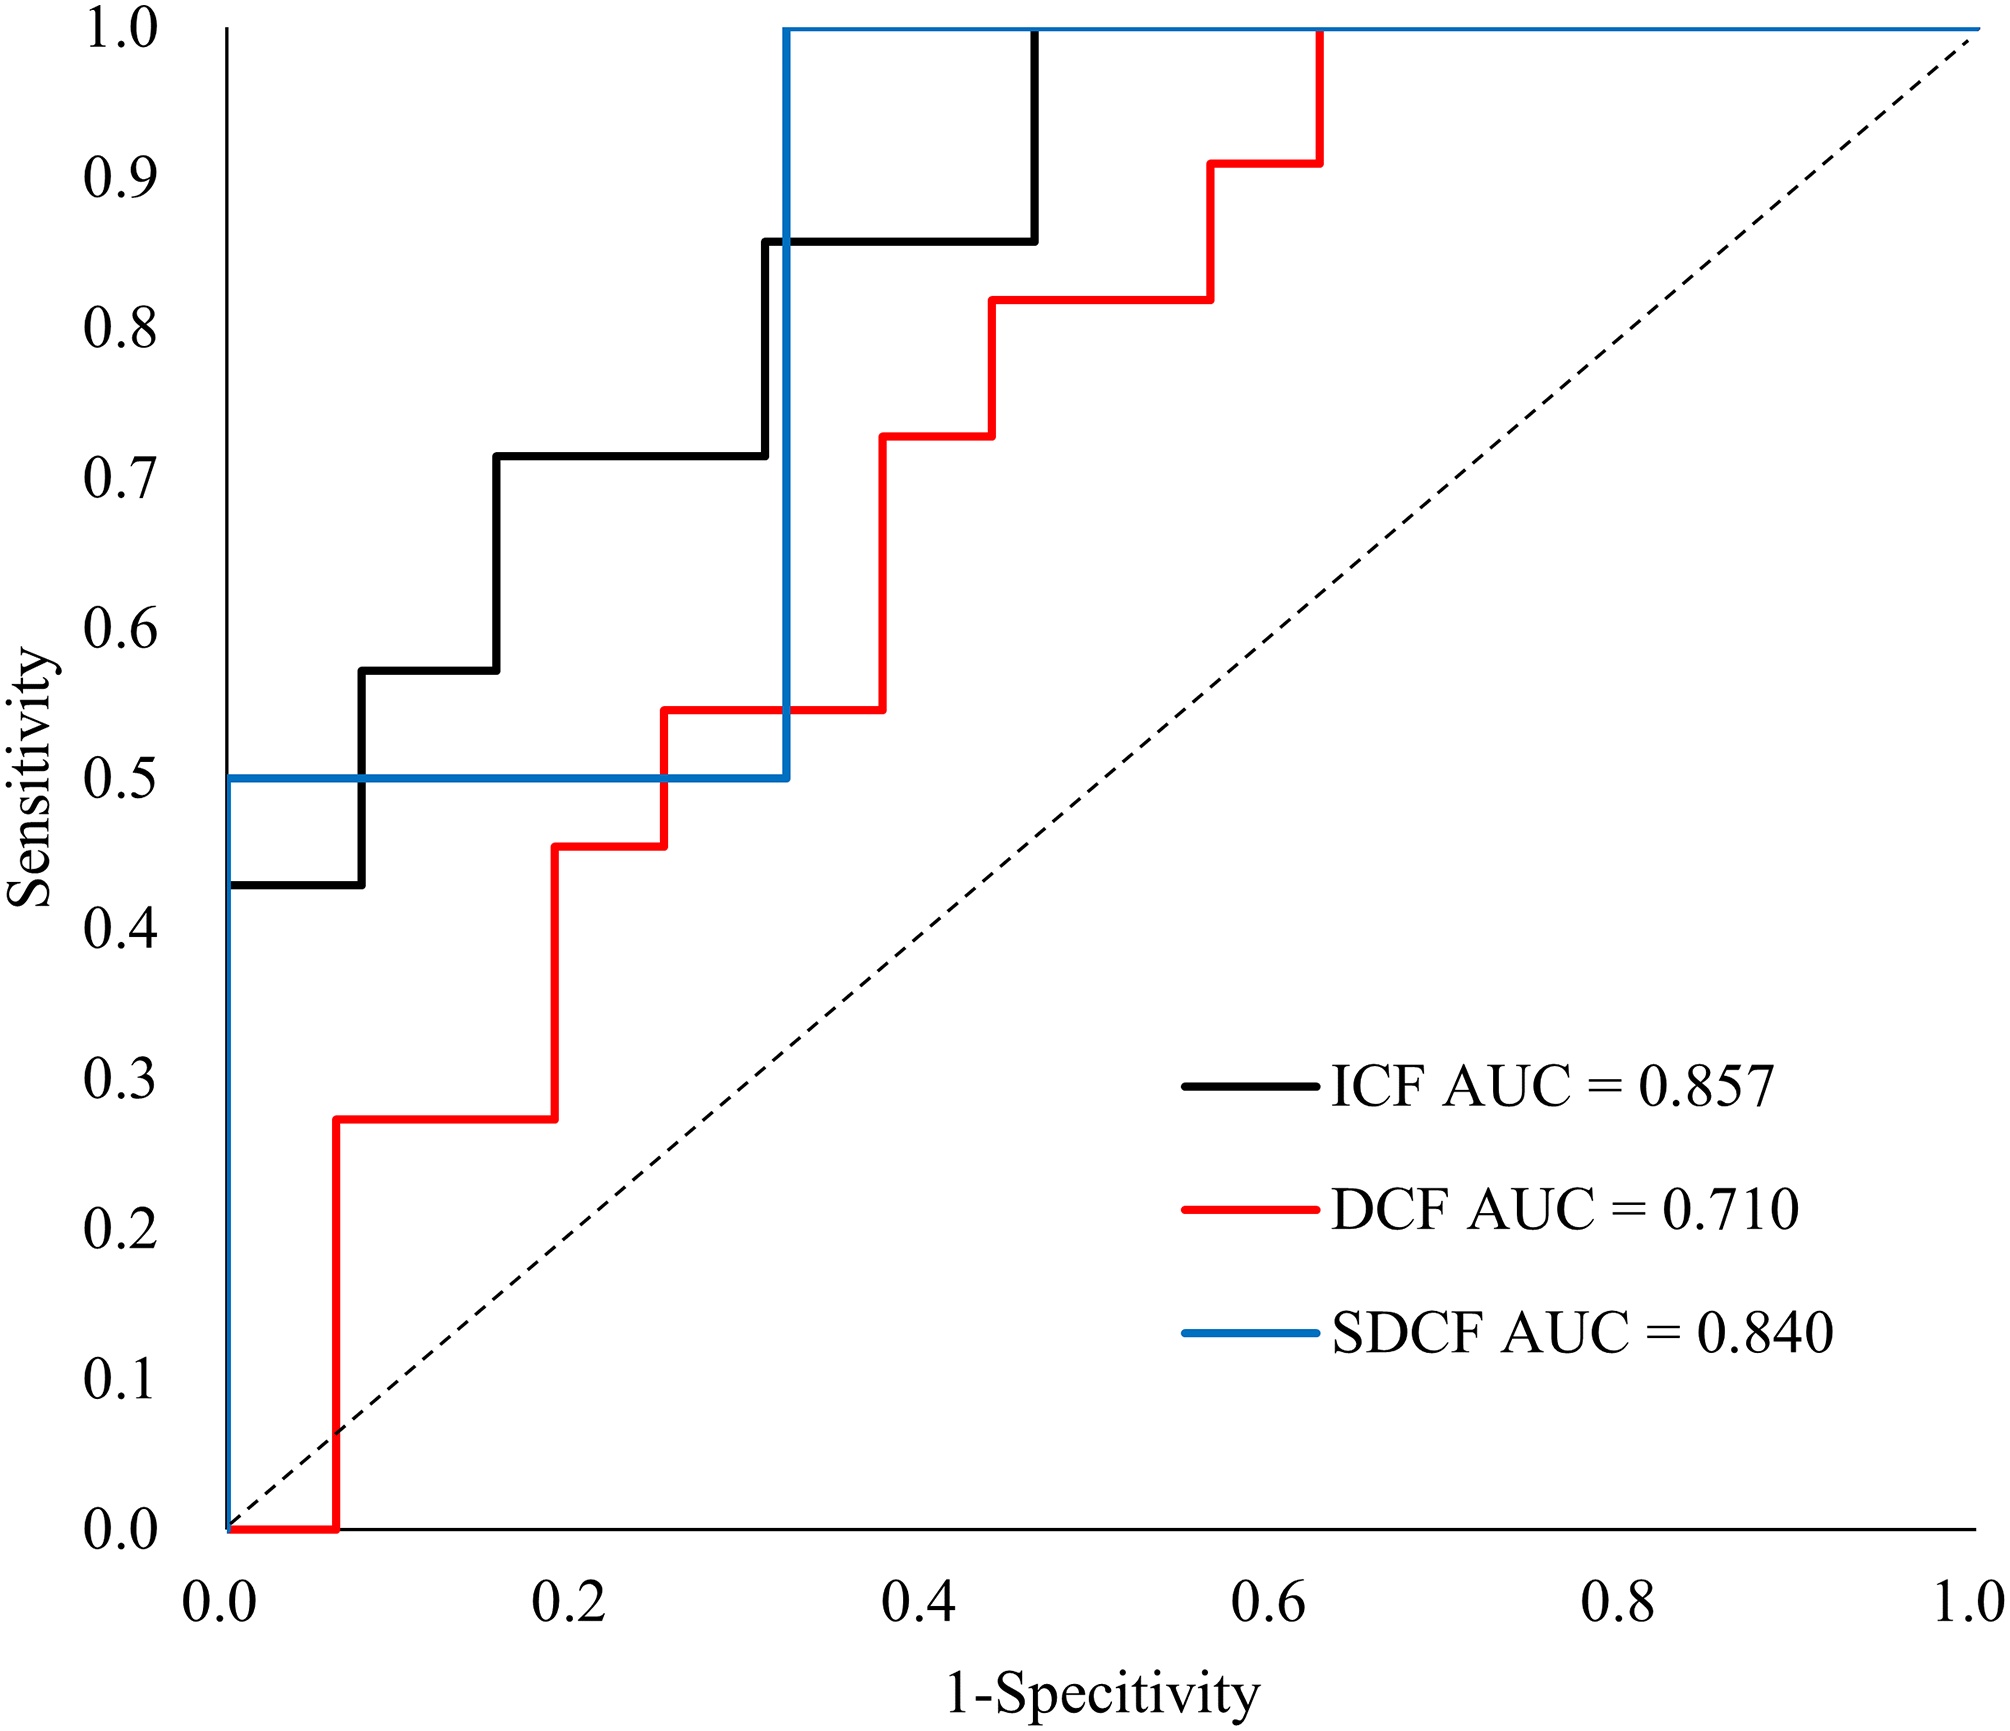
The ROC for the discrimination of the three groups.
Figure 3 presents the gait CoVs variables that are included in the PLS-DA model and most contributed to discerning between the groups. The CoV variables with a VIP score of 1 or higher are colored in red, and they are as follows: years of education, MSp, age, KA, HA, AP, KP, KM, AA, AM, SM. Additionally, variables with a VIP score of 0.8 or more and less than 1 are colored in green, and they are as follows: V-GRF, HP, HM, step length, stance duration, gait velocity, PSp, and AP.

Scores of variable importance projection (VIP).
Discussion
The aim of the present study was to derive the gait CoV parameters sensitive to the stages of cognitive decline and to determine their discriminative ability. For this purpose, the cognitive functions of the participants were assessed, and group classification was performed according to the degree of cognitive function using K-MoCA. Finally, the association of gait CoV parameters and the stage of cognitive decline and the classification performance of the PLS-DA model were investigated.
Classification of the stage of cognitive function decline using the PLS-DA based on the gait CoV parameters
The ICF AUC was the highest at 0.857, followed by the SDCF and finally, the DCF AUC at 0.710, indicating the best performance in discriminating participants with intact cognitive function from the others. However, because the AUCs of the DCF and SDCF were greater than 0.7 and the lower bound of the 95% confidence interval was greater than 0.5, this PLS-DA model may be useful for classifying the stages of cognitive decline.
In addition, this result suggests that the stages of cognitive decline can be distinguished based on the gait variability parameter. As mentioned in the section “Introduction,” previous studies examining the association between cognitive decline and walking on level ground suggest that walking speed is a risk factor for cognitive decline. In the study by Zhong et al., 23 no significant difference in walking speed was found between normal and MCI groups, and there were almost no significant differences between groups in peak kinematics and kinetics parameters. Similarly, a study by Kikkert et al. 14 found no significant difference in walking speed between groups. Furthermore, Hooghiemstra et al. 24 reported that gait speed cannot be used alone as an early marker of clinical progression from MCI to dementia.
Gait variability used in this study is a parameter that represents the regularity and stability of gait, and it has been reported to be related to executive function, one of the domains of cognitive function. 15 In a neuroimaging study by Verlineden et al., 25 gait was reported to be more closely related to cognitive function than automatically controlled motor tasks. In addition, Yogev-Seligmann et al. 26 reported that a decrease in executive function may lead to decreased feedback causing gait irregularity and instability. Thus, gait variability may be more sensitive to cognitive decline than spatiotemporal variables such as gait speed.
As mentioned above, in this study, the classification of the degree of deterioration of cognitive function was performed using the gait variability parameter and its performance was tested. Our findings may be able to supplement the limitations of the gait speed-based discrimination approach for individuals in the intermediate stage between normal and dementia states.
The CoV parameters important to discrimination of the stage of cognitive decline
Figure 2 shows all the variables used in the PLS-DA model and their importance in classifying stages of cognitive decline. The variables with VIP ≧ 1 were demographic variables (i.e. education, age), sub-gait cycle MSp, joint kinematics (i.e. hip, knee, ankle), and joint kinetics variables (i.e. KM, AM, KP, AP, SM).
Although educational level and age are known to be highly correlated with cognitive function, cut-off values have not yet been established for the MoCA as a function of these variables. Other studies related to MoCA have also reported that educational level and age should be considered when assessing cognitive function,27,28 and the present study also showed that these variables have a high importance (years of education VIP score was 1.86 ± 0.14 and the VIP score for age was 1.21 ± 0.13). In addition, it is well known that the higher the level of education, the higher the cognitive function evaluation score, and that age is highly correlated with the decline of cognitive function and gait. Therefore, age and educational level are variables that should clearly be included in the classification models for determining the stage of cognitive decline, and future studies on the cut-off point as a function of years of education and age are needed.
Regarding the demographic data, the highest educational level was observed in the ICF group, and the lowest educational level in the SDCF group, and there were significant differences between the three groups. This is consistent with the findings of previous studies on cognitive dysfunction and dementia.
With age, step and stride length shorten, and walking speed decreases.29,30 In addition, gait variability increases, and the risk of falling increases. 31 In this study, no significant difference was found between ICF and DCF, and between DCF and SDCF, although age increased with decreasing cognitive function. In addition, variables with significant differences between the groups were found in our results regardless of age. These parameters were as follows: HA, KA, HM, SM, HP, KP, AP as the joint biomechanics parameters, and V-GRF as the GRF parameter. This suggests that these variables are sensitive to cognitive decline regardless of age. Considering the statistical results, these variables will contribute to distinguishing the SDCF group from other groups.
Age, MSp, AA, KM, and AM, which were not mentioned above, are presumed to contribute to distinguishing the ICF and DCF groups as well as the SDCF. In addition, among the variables whose VIP was greater than 1, spatiotemporal CoV variables (i.e. stride length, step length, cadence, gait velocity, duration of stride, stance, and swing) were not included. This suggests that gait cycle and joint dynamics variables are more sensitive when discriminating between preclinical (i.e. SCD) or early prodromal stages.
The spatiotemporal function of gait is influenced by the combination strategy of various neuro-motor control parameters, and as a result, different sub-gait cycles appear. In other words, our results suggest that more detailed variables should be used to distinguish subtle differences in cognitive function levels. Therefore, it is necessary to analyze and compare the discriminative power of each spatiotemporal variable, gait cycle variable, and dynamic variable in future studies.
Limitations
The first limitation of this study is that sample size/power analysis was not performed and the small sample size and imbalance of data between groups. For this reason, the observation of statistical significance of the variables in this study may not be assured and may affect the classification power of the PLS-DA model. The second limitation is that the performance of the classification model composed of the aforementioned variable categories (i.e. spatiotemporal, gait cycle, and gait mechanics) was not compared and analyzed. Third, the physical functions (e.g. grip strength) able to affect gait variability were not considered in the present study. Lastly, to verify the objective validity of the performance of the PLS-DA model proposed in this study, a comparative analysis with other models (e.g. logistic regression model, support vector machine, decision tree) commonly used in clinical research is needed.
Conclusion
The present study examined differences in gait variability as a function of degrees of decline in cognitive function and investigated the discriminatory performance of the PLS-DA model based on CoVs.
Gait variability in terms of the spatiotemporal, sub-gait cycles, kinematics, kinetics, and GRF increased with decreasing cognitive function, with significant differences observed mainly between the SDCF and other groups.
The CoV based PLS-DA model differentiated the stages of cognitive impairment well, with a sufficient AUC of 0.710 to 0.857. Among several gait variability variables, in particular, the CoVs of sub-gait cycle, kinematics, and kinetics together with the education level and age were the parameters that contributed most to the differentiation of the three groups.
This finding suggests that more detailed parameters of gait variability, in addition to gait velocity, could be used to identify older individuals with and without potential cognitive decline, which would offset the limitation of spatiotemporal variables as predictors for dementia.
Footnotes
Declaration of conflicting interests
The author(s) declared no potential conflicts of interest with respect to the research, authorship, and/or publication of this article.
Ethics approval
Ethical approval to report this case was obtained from Institutional Review Board of Jeonbuk National University (JBNU IRB File No. 2019-09-015-001).
Funding
The author(s) disclosed receipt of the following financial support for the research, authorship, and/or publication of this article: This work was supported by the National Research Foundation of Korea (NRF) grants funded by the Korean goverment (MSIT) (No.2022R1A2C2012762), and by the Basic Science Research Program through the National Research Foundation of Korea (NRF) funded by the Ministry of Education (No.2019R1A6A3A01092848 and No.2022R1I1A1A01064228).
Informed consent
Written informed consent was obtained from the patient(s) for their anonymized information to be published in this article.
Author biographies
Kiyoung Kwak received his BS, MS, and PhD degrees from Jeonbuk National University, Republic of Korea, in 2009, 2011, and 2018, respectively. He is currently a postdoctoral researcher at the Division of Biomedical Engineering, Jeonbuk National University. His major research interests are in neuro-musculoskeletal biomechanics, sensory-motor integration, rehabilitation engineering, and cognition function in the elderly.
Emilija Kostic received her BS degree from the University of Belgrade, Serbia in 2018, and her MS degree at Jeonbuk National University, the Republic of Korea in 2021. She is currently in the process of obtaining her doctoral degree at Jeonbuk National University. Her major research interests are machine learning utilization in healthcare, sensory processing, rehabilitation engineering, and elderly cognition.
Dongwook Kim received his PhD degree in Biomedical Engineering from Hokkaido University, Sapporo, Japan, in 1995. He is now a professor at the Division of Biomedical Engineering, Jeonbuk National University, Republic of Korea, and the president of the Korean Society of Medical and Biological Engineering. His current research interests include biomedical engineering, rehabilitation engineering, sensory-motor integration, diagnosis, and healthcare systems.