
Abstract
The high costs of energy supply and variable energy demands in consumption units, especially domestic consumption in different time frames, have accelerated technological developments for the proper use of energy resources to reduce energy consumption. The design of a distribution network for consumption depends on environmental conditions, equipment locations, consumer demands, consumption simultaneity factor, and some other parameters. These factors can mitigate energy loss in transmission networks. This study analyzes effective factors in the thermal energy distribution and transmission systems from generators to household consumers by considering the energy consumption rates in units based on a mathematical model to increase energy consumption in teams and rely on consumption during transmission. For this purpose, energy demands were evaluated in consumption units in a sample one-year project. The results were employed to design an optimal network for transferring energy from generators to consumers by modeling the distribution system. In this study, the thermal energy distribution and transmission network for domestic consumption was assessed and ranked have been assessed and ranked through single-stage distribution (SSD), multistage distribution (MSD), and MSD with the flow bypass method. The results of simulating the MSD system with the flow bypass method indicated the optimal performance of the proposed system in both consumer and generator sectors. This method also reduced fuel consumption by 6.09% and increased electricity consumption of the transmission network by 95% compared with single-stage transmission networks. Moreover, the method yielded a 6.03% reduction in the total cost of energy consumed to provide the thermal load of the building compared with SSD on a yearly basis.
Keywords
Introduction
Researchers have long focused on the growing technological developments in the use of energy resources to meet the needs of consumption units by mitigating energy consumption and improving the efficiency of distribution networks. Given the high costs of energy supply and variable energy demands in consumption units, 1 especially household consumption in different time frames, it will be beneficial to improve the efficiency of energy transmission networks and decrease their wastage.
In this regard, previous studies on energy policy-making, development of smart cities, and the use of renewable energy sources can be cited as instances.
Development of smart cities through digital tools and technologies (IOT) has increased the use of renewable energy sources and the technology of integrating these sources with energy distribution networks. 2 Population growth and the cap set by governments around the world to reduce greenhouse gas emissions have turned solar energy into one of the most popular renewable energy sources, which can be used at homes in heat pumps for residential heating, absorption chillers for cooling spaces, district heating systems, and desalination systems to produce fresh water. 3 Smart city policies will change the daily household energy consumption and consequently make significant decrease in indirect carbon emissions. 4 Development of renewable energy sources using combined heat and power (CHP), together with controllable appliances, has provided new opportunities for scheduling of resources and consumption in smart homes. 5 Optimal home energy management using suggested methods in scheduling of home appliances and the supply of energy and controllable loads in smart homes. 6
A review on these studies reminds us of the necessity of planning for supplying, transferring, and consuming energy in different areas (particularly the household uses).
Every energy system consists of three sections: energy generators, consumers, and production networks. Energy is produced with respect to the needs of consumption units by energy generators such as boilers and chillers. Due to recent technological advances, energy is now generated and provided for consumers with high efficiency. For domestic consumption, energy is usually used for heating and cooling buildings and for sanitary purposes to provide comfortable living conditions. Developments of human societies are directly related to the increased levels of well-being that residents experience in their homes, something which increases the demands for energy consumption. Power distribution and transmission networks are among the most critical parts of any energy system, for they establish a communication bridge between an energy generator and consumers. Therefore, the accurate design of a distribution network based on environmental conditions, equipment locations, consumer demands, and synchronicity factors of consumers in technical and economic analysis of existing methods are the most effective factors in the optimal design of an efficient energy distribution network. As a result, the correct layout of a distribution network with the careful consideration of its effective factors is the primary duties of a mechanical facility designer engineer in developing an optimal energy distribution network. 7 The optimal distribution of thermal energy includes the selection of piping methods in central facilities to transfer thermal energy to consumption units per energy demand. Various factors such as environmental conditions, distances of consumer units to significant facilities, economic factors, and project conditions can greatly affect the selection of piping methods. There are different types of conventional plumbing methods based on the ASHRAE standard 7 1 such as single-tube and two-tube systems. The two-tube systems are divided into the piping system with a direct reversal, the reverse back piping system, and the piping system with a primary-secondary method. 8
It is possible to improve energy availability in consumption units by using proper modeling methods, determining the optimal design range, and selecting the best piping layout through the aggregation of factors affecting the optimal distribution of thermal energy in central facilities. Therefore, energy loss will decrease on the transmission route. As a result of quantitative and qualitative developments in the construction industry and its various sectors, maximizing efficiency and minimizing the use of different types of energy are now considered the principles of design and implementation in this field. The National Building Regulations set all the legal requirements for design, implementation, operation and maintenance, changes and inspection of thermal installations, air exchange and air conditioning, and the supply and storage of hot water consumed inside buildings. These regulations include the 22nd topic on building care and maintenance, 9 the 14th topic on regulations for the installation and deployment of equipment, air exchange, drainage, air ducts, boilers, water heaters, hot water tanks, combustion air supply, piping, and refrigeration, 10 topics on the design of heating, cooling, and air conditioning, 11 and the 19th topic on energy saving. 12 Design engineers employ the BIM 2 nowadays in many developed countries 13 In fact, the BIM is a method of building and operating construction facilities. It is also the process of generating and managing the information of a building throughout its lifecycle. In other words, a BIM model provides a three-dimensional digital representation of the physical characteristics and performance of a building. The main difference between a BIM model and a conventional 3D CAD 3 model is the storage of important information on the entire construction process with all its components such as material specifications (i.e. weight, volume, length, color, size, fire resistance, etc.), installation and assembly instructions, product warranty services, maintenance requirements, price information of parts, and project costs. Moreover, BIM is used as a technical term describing a CAD model connected to a database so that it can save the information related to the project. Therefore, BIM acts as a common information source between the entire building design and an implementation team. It helps integrate information, improve coordination, reduce errors and wastage, rework operations, lower costs, and finally enhance the quality of work.
Review of literature
Taiyuan Zhang et al. analyzed different ways of saving energy in an energy system through energy analysis methods based on thermodynamic laws including economic exergy analysis of the system. They highlighted the importance of analytical research into power to address the laws of thermodynamics. It is essential to adopt the right energy analysis method for implementing energy saving. This paper benefits from a variety of economical energy analysis methods called enthalpy analysis, entropy analysis, exergy analysis, and analysis based on the second law of thermodynamics. 14 Yu and Junyi Zhang employed statistical analysis methods to analyze people's behavior of energy consumption in households of Beijing and study the roles of economic indicators in reducing energy consumption. They proposed two types of multiple discrete-continuous models based on the utility theory. In the multiple discrete-continuous model, the improved resource allocation based on a multi-linear function was adopted to analyze the household energy consumption household in Beijing in 2010. The resultant data can be utilized to predict the energy consumption household behavior. 15 Ueno et al. analyzed the information on the energy consumption rates of different devices in buildings. They considered the effect of each device on the total thermal load of the building and evaluated the solutions to consumption load reduction. The authors proposed a method of reducing energy consumption in residential buildings by providing necessary information regarding energy consumption. The useful data on electricity and gas consumption of 18 residential units indicated beneficial ways of encouraging energy-saving activities. This paper described energy-saving solutions in detail as well as their effects on reduction in energy consumption of buildings. 16 Marta Julia Baldia and Lorenzo Leoncinib conducted an exergy analysis to evaluate the direct energy impact of a building on the environment. 17 Jelena Ziemele et al. analyzed the regional energy distribution system by providing certain solutions based on the analysis of consumption units and the use of an integrated energy distribution system in the European Union. They discussed an essential element in evaluating the performance of a district heating system to improve energy efficiency and broaden the use of renewable energy sources. For this purpose, they proposed a novel algorithm, which included not only databases and computational equation systems but also an analysis module through multiobjective decision-making. 18 Shahabuddin Shamshir et al. analyzed the effects of different factors such as heat demand, flow control, pressure control, and differential temperature on equipment and consumers in an energy system by using the fuzzy neural algorithm analysis and considering its effectiveness in reducing energy consumption. They proposed a neural phase model to predict the heat load of consumers in urban heating systems. 19 M. Sahu et al. introduced a method for designing the building air-conditioning systems by combining thermal models and optimization techniques in a tropical climate. For this purpose, they considered building design variables and an approach toward the optimal solution for system design. The optimal solutions presented in the optimization model were simulated in TRNSYS 16. 20 Xiu Liu and Kai Strunz analyzed the prediction and simulation of heat transfer in urban heating networks for the meaningful analysis of CHP systems. They focused on the development of a coherent and comprehensive modeling framework that related different categories of piping models to specific applications where flows would be driven by forced convection. 21 Yue Wang et al. proposed a novel reliability assessment model for ICES including electricity, gas, and heat by considering the dynamic process of thermal loads. 22 Zening Li et al. proposed an ADN energy management strategy integrated with distributed power for smart buildings in order to achieve the flexible operation of distribution networks. They compared the timing results of the integrated ADN model under different control methods for heating ventilation and air conditioning (HVAC) systems in a winter heating scenario. They also analyzed the impacts of demand response capability for smart buildings on the economic and safe performance of ADN. 23 Nikos Kampelis et al. determined the energy signature of a new technology laboratory at the Atlanta campus in Nicosia to reach a general estimate of consumption by starting from common measurements such as external and internal temperatures that were easily collected in a smart building. They concluded that an energy model-based simulation would be a tool allowing us to model a building on a system capable of simulating dynamic thermal interactions between a building and its interiors and exteriors. 24 Yu-Chao Hua et al. analyzed the principle of heat transfer optimization to further explain basic mechanisms and guide the practical programs of heat transfer processes through the transient theory to optimize various steady-state heat transfer processes in transient cases. 25 Xiaoyu Shen et al. conducted an energy flow analysis to establish a relationship between a thermal accumulator and a thermal system from the perspective of heat transfer. 26 Mahmoud Mehrgan et al. reported that a large amount of energy used in buildings would be directed toward HVAC. They concluded that a key method for the reduction of heating and cooling loads would be to create a base model representing a theoretical version of the building. 27
Research objectives
Determining the practical factors in adopting the best transmission method through thermodynamic analysis of transmission systems
Identifying the factors affecting thermal energy distribution systems domestic consumption
Modeling a single-stage distribution (SSD) system and a multi-stage distribution system for domestic applications in TRNSYS
Proposing a multi-stage distribution system with a flow bypass method to reduce the cost of thermal energy consumption in buildings
Conducting the thermodynamic analysis of energy transmission systems to determine the practical factors in adopting the best transmission method
Hypotheses
The efficiency of energy generators is directly proportional to the method adopted for heat energy transfer in household consumption, which should be proportional to the amount of energy demand in consumption units. This hypothesis refers to the results and calculations in “Effects of Distribution and Transmission Network on Generator Performance”.
Determining the optimal performance range of a transmission network, based on the energy demand simulation method and technical characteristics of energy generators, will enable the selection and design of optimal distribution and transmission methods. This hypothesis refers to the results and calculations in “Optimal Range of Distribution and Transmission Network Performance”.
The use of flow separators in multi-stage distribution systems can enable simultaneous adjustment of the flow intensity of the fluid carrying the thermal load, with optimal performance in consumption sectors and energy generators. This hypothesis refers to the results and calculations in Multi-Stage Distribution (MSD).
The proposed multi-stage distribution system with the flow bypass method will increase the control scope of the system capacity based on energy requests in consumption units. This hypothesis refers to the results and calculations in “Multi-Stage Distribution (MSD)”.
The system simulation results can be used as a database to design and operate mechanical installations of various buildings (e.g. commercial, administrative, and residential buildings) and to analyze energy consumption reductions and economic, social, and environmental outcomes. This hypothesis refers to the results and calculations in “Results”.
Methodology
Research method
Modeling techniques and comparative analysis methods were used in this study. Energy demand in consumption units and various forms of thermal energy distribution and transmission were modeled and evaluated under different conditions in TRNSYS. The results were then utilized to design an optimal energy network. Basic formulas and standards were employed in the user design to ensure and validate the results of the modeling process. Moreover, a comparison was drawn between the results and the field research samples. The thermal energy distribution and transmission network for domestic use was evaluated and ranked with SSD, MSD, and MSD with flow bypass
Case study
Table 1 reports the general specifications of the project by default. Since a comparative method was adopted, the sample project of a 10-story residential building was considered the basic calculation plan in the climate zone of Iran-Tehran with the type of use A and a medium heating energy requirement level.
General specifications of the project.

Model development
Building thermal load
Equation (1) has been used to calculate the heating method (HDD
4
), and equation (2) has been used to calculate the total energy required of the units used to supply the heat load (KW per year):

Modeling the distribution and transmission networks
Distribution and transmission networks establish the bridge between consumers and producers in an energy system. According to Figure 1, consumers send requests for the thermal energy required to supply the thermal load through the transmission network to the energy generator. The generator then produces the necessary thermal energy with respect to the requested amount. This energy is transferred through the network. As a result, an efficient design of the transmission network can significantly increase or decrease the heat transfer in the distribution equipment of consumers and energy generators in the engine room. If energy distribution is performed as requested, it will improve the efficiency of the energy generator in addition to reducing energy losses in the transmission network and decreasing the energy consumption in transmission equipment. To optimize the transmission network design, its operations were simulated with respect to its effects on system components in different states.
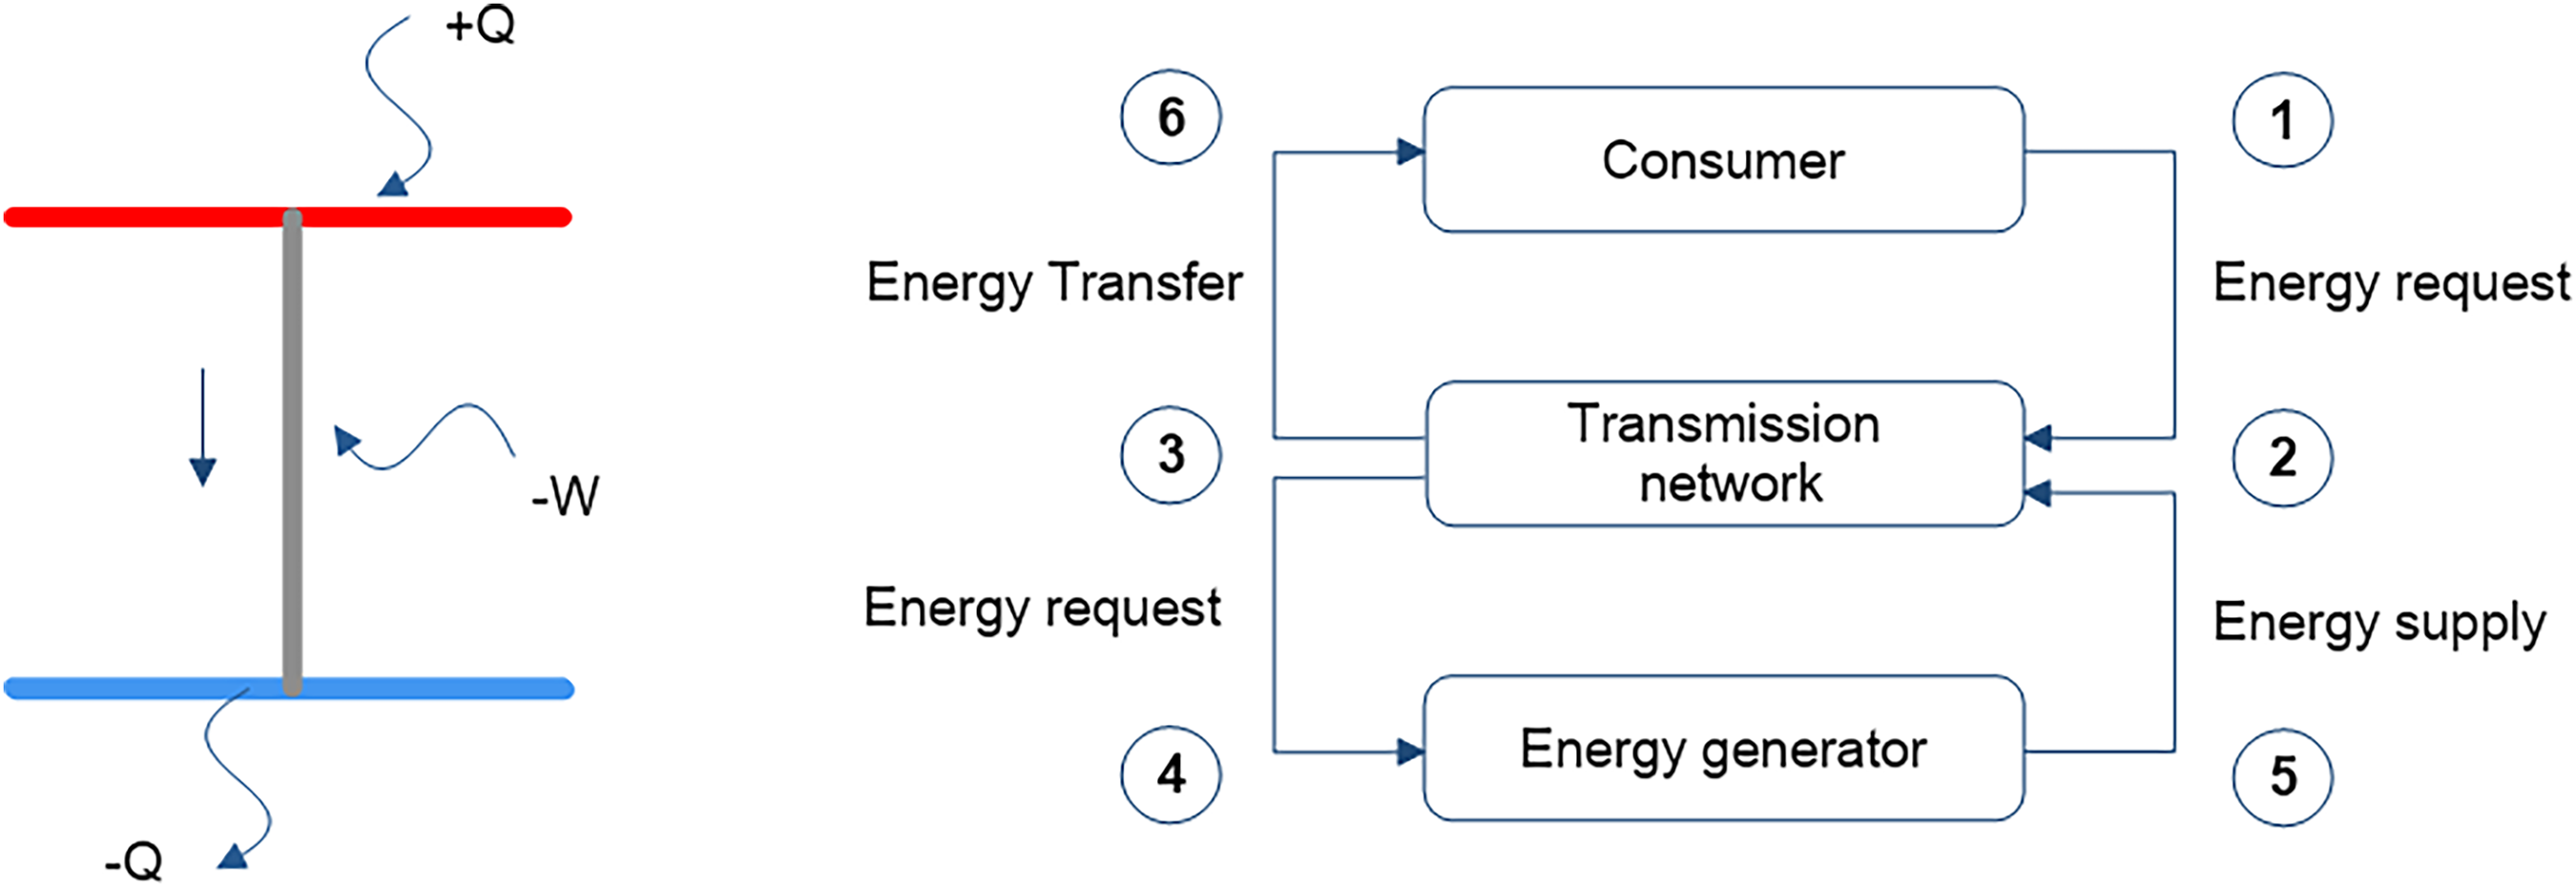
Communication between components of an energy system in household consumption.
According to Figure 1, thermal energy in this system consists of kinetic, potential, chemical, and internal forms of energy. The first law of thermodynamics states that energy variations of a system are equal to the sum of heat and work input. The general form of the first law of thermodynamics is as follows: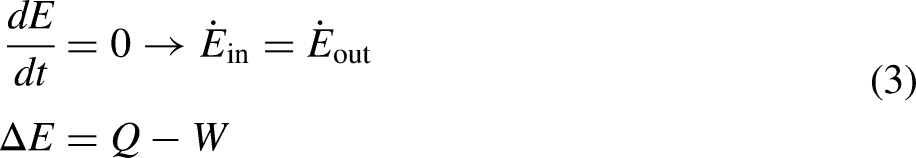


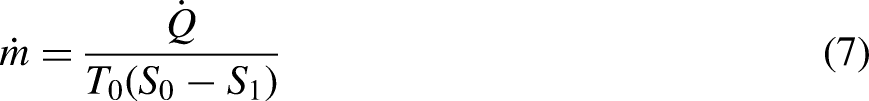
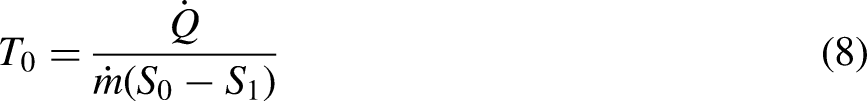
Equation (7) has been used to calculate the Fluid discharge of heat load based on the second law of thermodynamics.
The following formula can be employed to calculate the amounts of exergy and energy in a system and the exergy of valuable power in that system:

Energy loss in distribution and transmission networks (TEL)
To simulate energy loss in the distribution and transmission network, the heat flux in the transmission network was calculated through the thermal resistance accumulation model in the piping (Figure 2), based on equation (12). In this equation, the Zucaskas equation was used to calculate the average convection heat transfer coefficient. To analyze the effects of the transmission network, the rates of energy loss were determined in the distribution network for ideal and operational conditions:
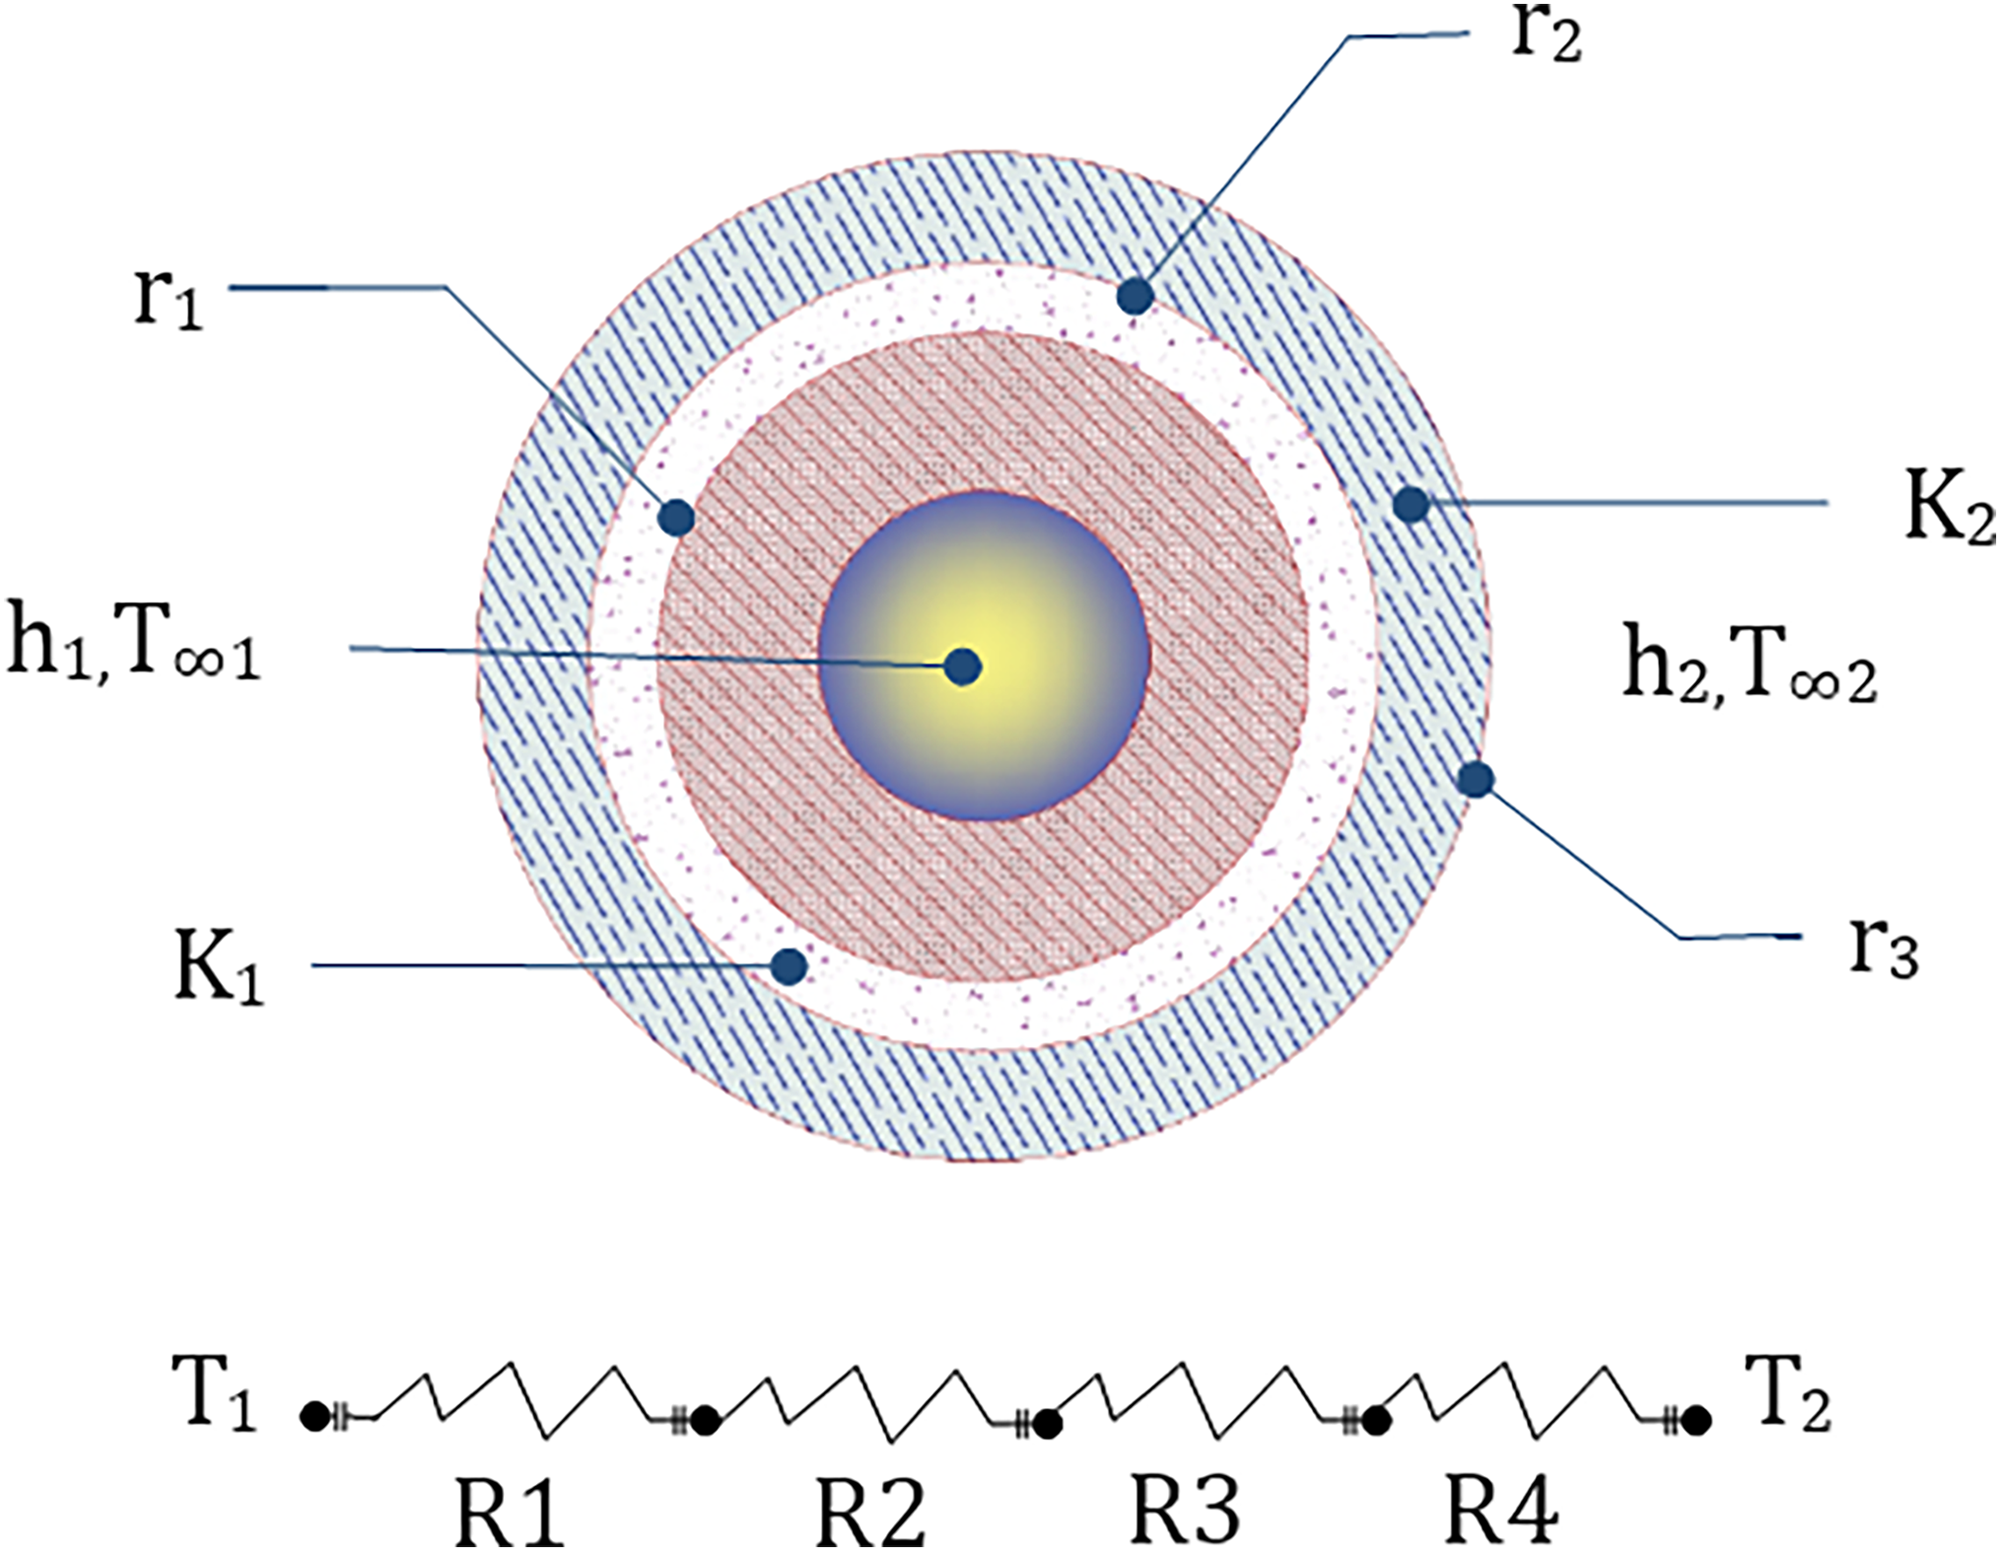
Heat transfer in the pipe wall.
Effects of distribution and transmission network on generator performance
In central energy generator systems, a generator produces the total energy required by the building to supply its thermal load. Equation (13) has been used to calculate the heat flux of the generator by considering the average temperature of the water entering the generator and calculating the average convection coefficient 


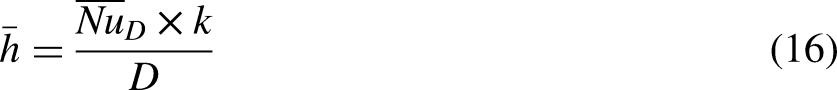
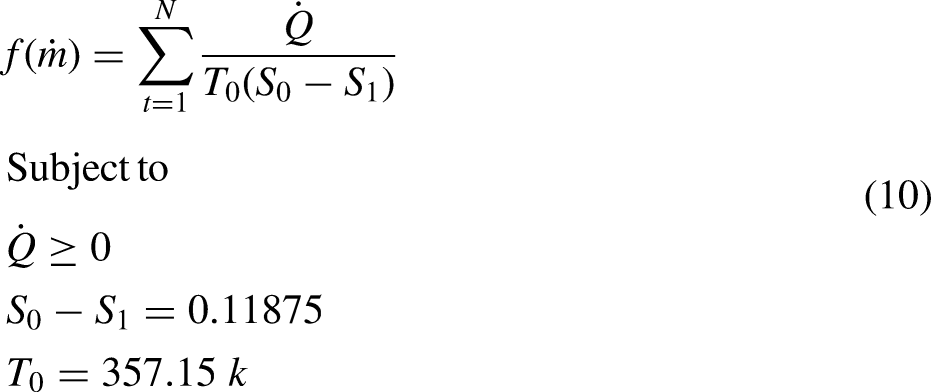
According to (equations (13)–(16)), the objective function in calculating the heat flux of the generator in a certain period defined as below:

Calculation of fuel consumption (FD)
Equation (18) was used to calculate the fuel consumption of the building to supply the heat load within the range of scenarios defined in the network (i.e. cold and freezing weather):
Multi-stage distribution
The MSD system consists of one primary and one or more secondary sections connected by a flow separator. Consumers in consumption units receive their energy requests via the secondary transmission network through the flow separator with the corresponding energy generation network. With the necessary amount of energy, it produces thermal energy, which is transferred to the secondary transmission network via the primary transmission network. Flow separators act as the intermediate bridge between the energy generator and consumers in this system. Figure 3 demonstrates the operating mechanism of this method.

Multi-Stage distribution system.

Flow separator.
In this system, it is possible to adjust the discharge in the optimal design area in the consumer and energy generator sectors simultaneously due to the presence of a flow separator in the network. The most critical components of MSD systems are flow separators. Figure 4 and equations (19)–(21) show the energy balance system in a flow separator. 


Multi-Stage distribution and transmission network flow diagram.
The energy equation for the flow separator in the bypass system (Figure 5(a)) with equation (19) is as follows:
Economic analysis
The main goal of implementing changes in the transmission network is to achieve energy savings. Energy saving means rational use when the saving costs are nearly equal to its benefits. If the benefits of m energy saving are assumed similar to Π, its value should be positive. Accordingly, the energy-saving function is defined as below:

In this study, the main benefit of saving energy in transmission networks was to reduce fuel consumption costs in the field of system operations. Hence, the energy saving function of the transmission network in the annual period is defined below:
Results
Calculating building thermal load and energy request in consumption units (TED)
The thermal energy consumption was estimated in the sample building based on the specifications presented in Table 1. According to the ASHRAE guidelines, the basis for calculating the thermal load of the structure is to determine the capacity of equipment and facilities by region. The coldest day of the year was recorded at −5.6°C in January. Table 2 indicates an overview of equipment and facility calculations.
Climatic conditions, thermal load, and discharge of the sample building.

The number of energy demands in consumption units and the weather conditions were predicted in Metronome 7.3 during in Tehran within the 1991–2010 period. Figure 1 demonstrates the energy consumption units requested with temperature variations in the daily heating method (HDD 5 ). The results can be seen in Table 3 and Figure 6.

Diagram of temperature variations in annual/monthly time frames.
Calculation of HDD.

Figure 6 depicts temperature variations in one year. According to Figure 6(b), temperature variations were observed in the coldest month of the year (January), in which the temperature varied from −5.6°C to 15.5°C compared with daylight hours. According to Figure 6(c), temperature variations in October ranged from 9.8°C to 31°C; thus, the base temperature of 18.3°C was taken into account in HDD calculations. The thermal energy request varies at different times of the night. If the temperature is higher than the base temperature of HDD in some hours when the energy request is zero in consumption units, the thermal energy production and distribution system are then turned off. Based on climate change, energy requests per day will change in consumption units. Figure 7 reports the results of the energy demand simulation in consumption units. Accordingly, the total energy demand of the units used to supply the thermal load was estimated at 1,997,206,144 kW per year. As Figure 6 suggests, this amount had a direct relationship with climate change at different times of the day.

Simulation of energy demands in consumption units to supply the thermal load of the building in annual/daily time frames.
Modeling the distribution and transmission networks
Regarding the transmission network performance, Figure 8 depicts variations in the flow rate of the fluid carrying the thermal load corresponding to the energy demands in consumption units within the annual period. In this diagram, the flow rate required to supply the heat load of the consumer units
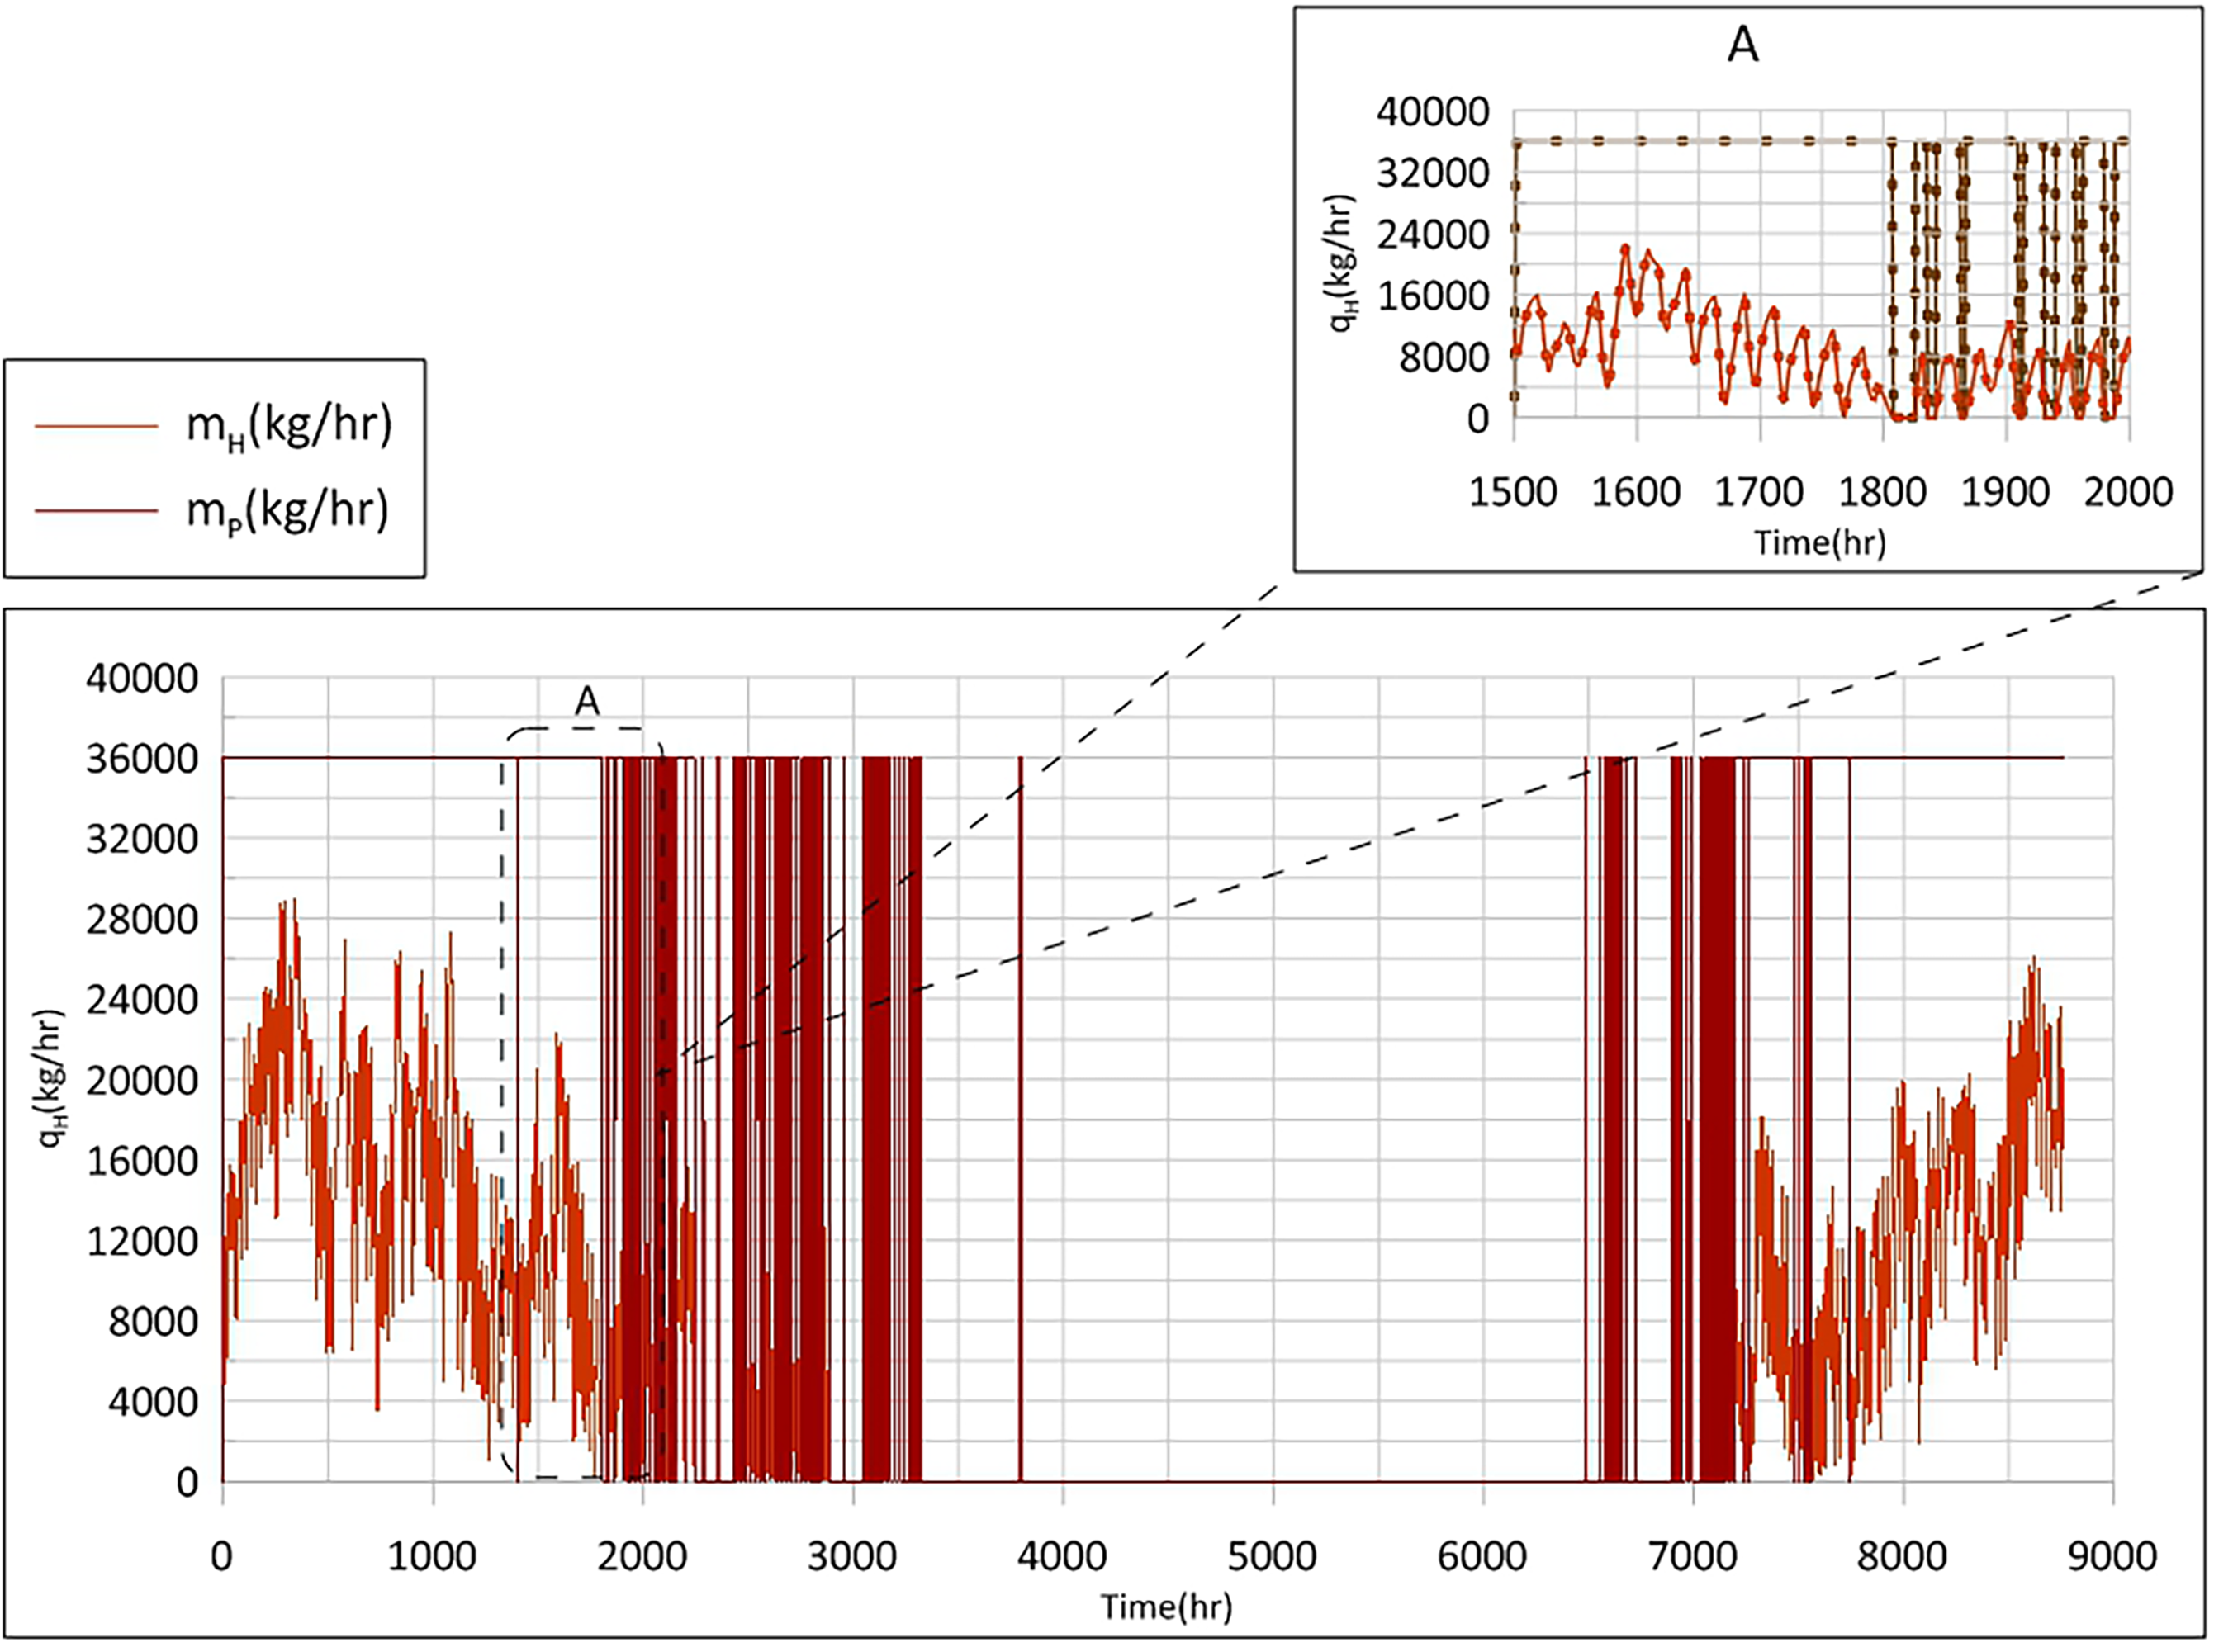
Simulation of fluid discharge carrying thermal charge in distribution and transmission networks in annual/monthly time frames.
Energy loss in distribution and transmission networks (TEL)
According to equation (12), the total energy loss in ideal conditions after simulation was estimated at 5154.026 (kw) per year, whereas it was estimated at 5399.633 (kw) per year in operational conditions. The simulation results indicated a 4.76% increase in energy loss of operational conditions compared with that of ideal conditions in the same period. In equation (12), the temperature of the complete fluid is 85°C in the source but 75°C in the return direction. Due to the constant flow rate of the circulation pump in operational conditions, the return temperature is variable and proportional to the energy consumption. Table 4 demonstrates the variables of the problem in calculating the total thermal resistance. Figure 9 illustrates temperature variations in return from consumers in different modes of the simulation.

Temperature variations in the transmission network.
Values and variables in the calculation of heat flux and energy loss in the distribution and transmission network.

Effects of distribution and transmission network on generator performance
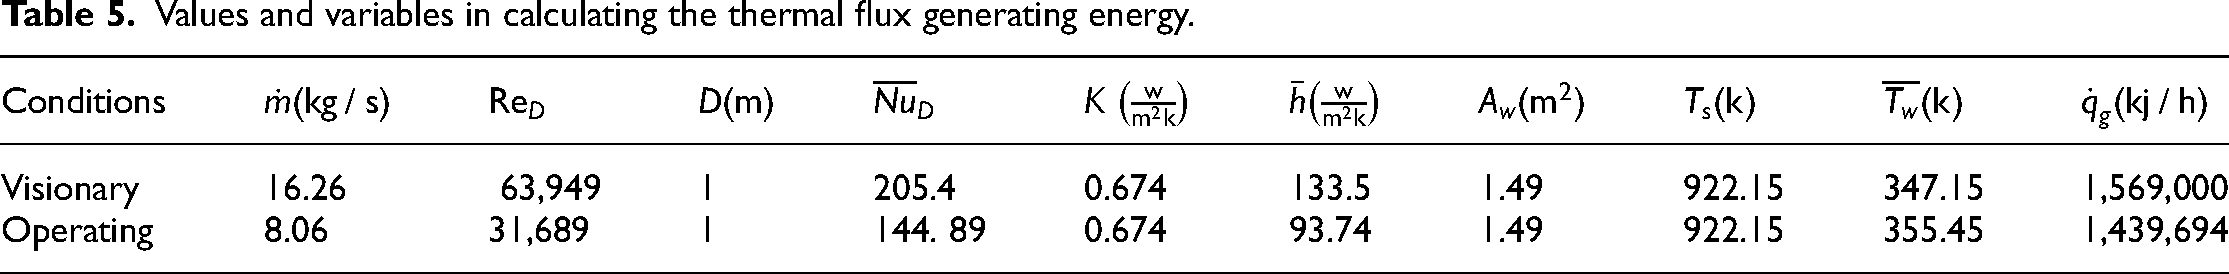
To calculate the effects of distribution and transmission network on generator performance as a result, the peak consumption conditions (Table 2) were taken into account to determine the energy generating capacity. In this case, an energy generator of the hot water boiler was selected with a total of 500,000 (kcal/hr) and an efficiency of 75%. The maximum heat energy production capacity of the generator was 1,569,000 (kJ/hr). Table 5 compares the results. In this case, the maximum generator thermal energy production capacity was 1,569,000 (kJ/h) equal to the maximum generator capacity. For this purpose, the mass flow rate of the thermal load-carrying fluid should be at maximum and equivalent to 16.26 (kg/s). As a result, if the flow rate of the fluid carrying the heat load is similar to the maximum flow rate required by the consumption units, this value will reduce the heat flux of the generator by 8% in operational conditions. In Table 5, the Zucaskas equation (equations (14)–(16)) was employed to calculate the average displacement heat transfer coefficient and other parameters.
Values and variables in calculating the thermal flux generating energy.
Optimal range of distribution and transmission network performance
If the heat flux of the generator is considered constant and equal to its maximum value (1,569,000 kJ/h), the variations in the average convection coefficient
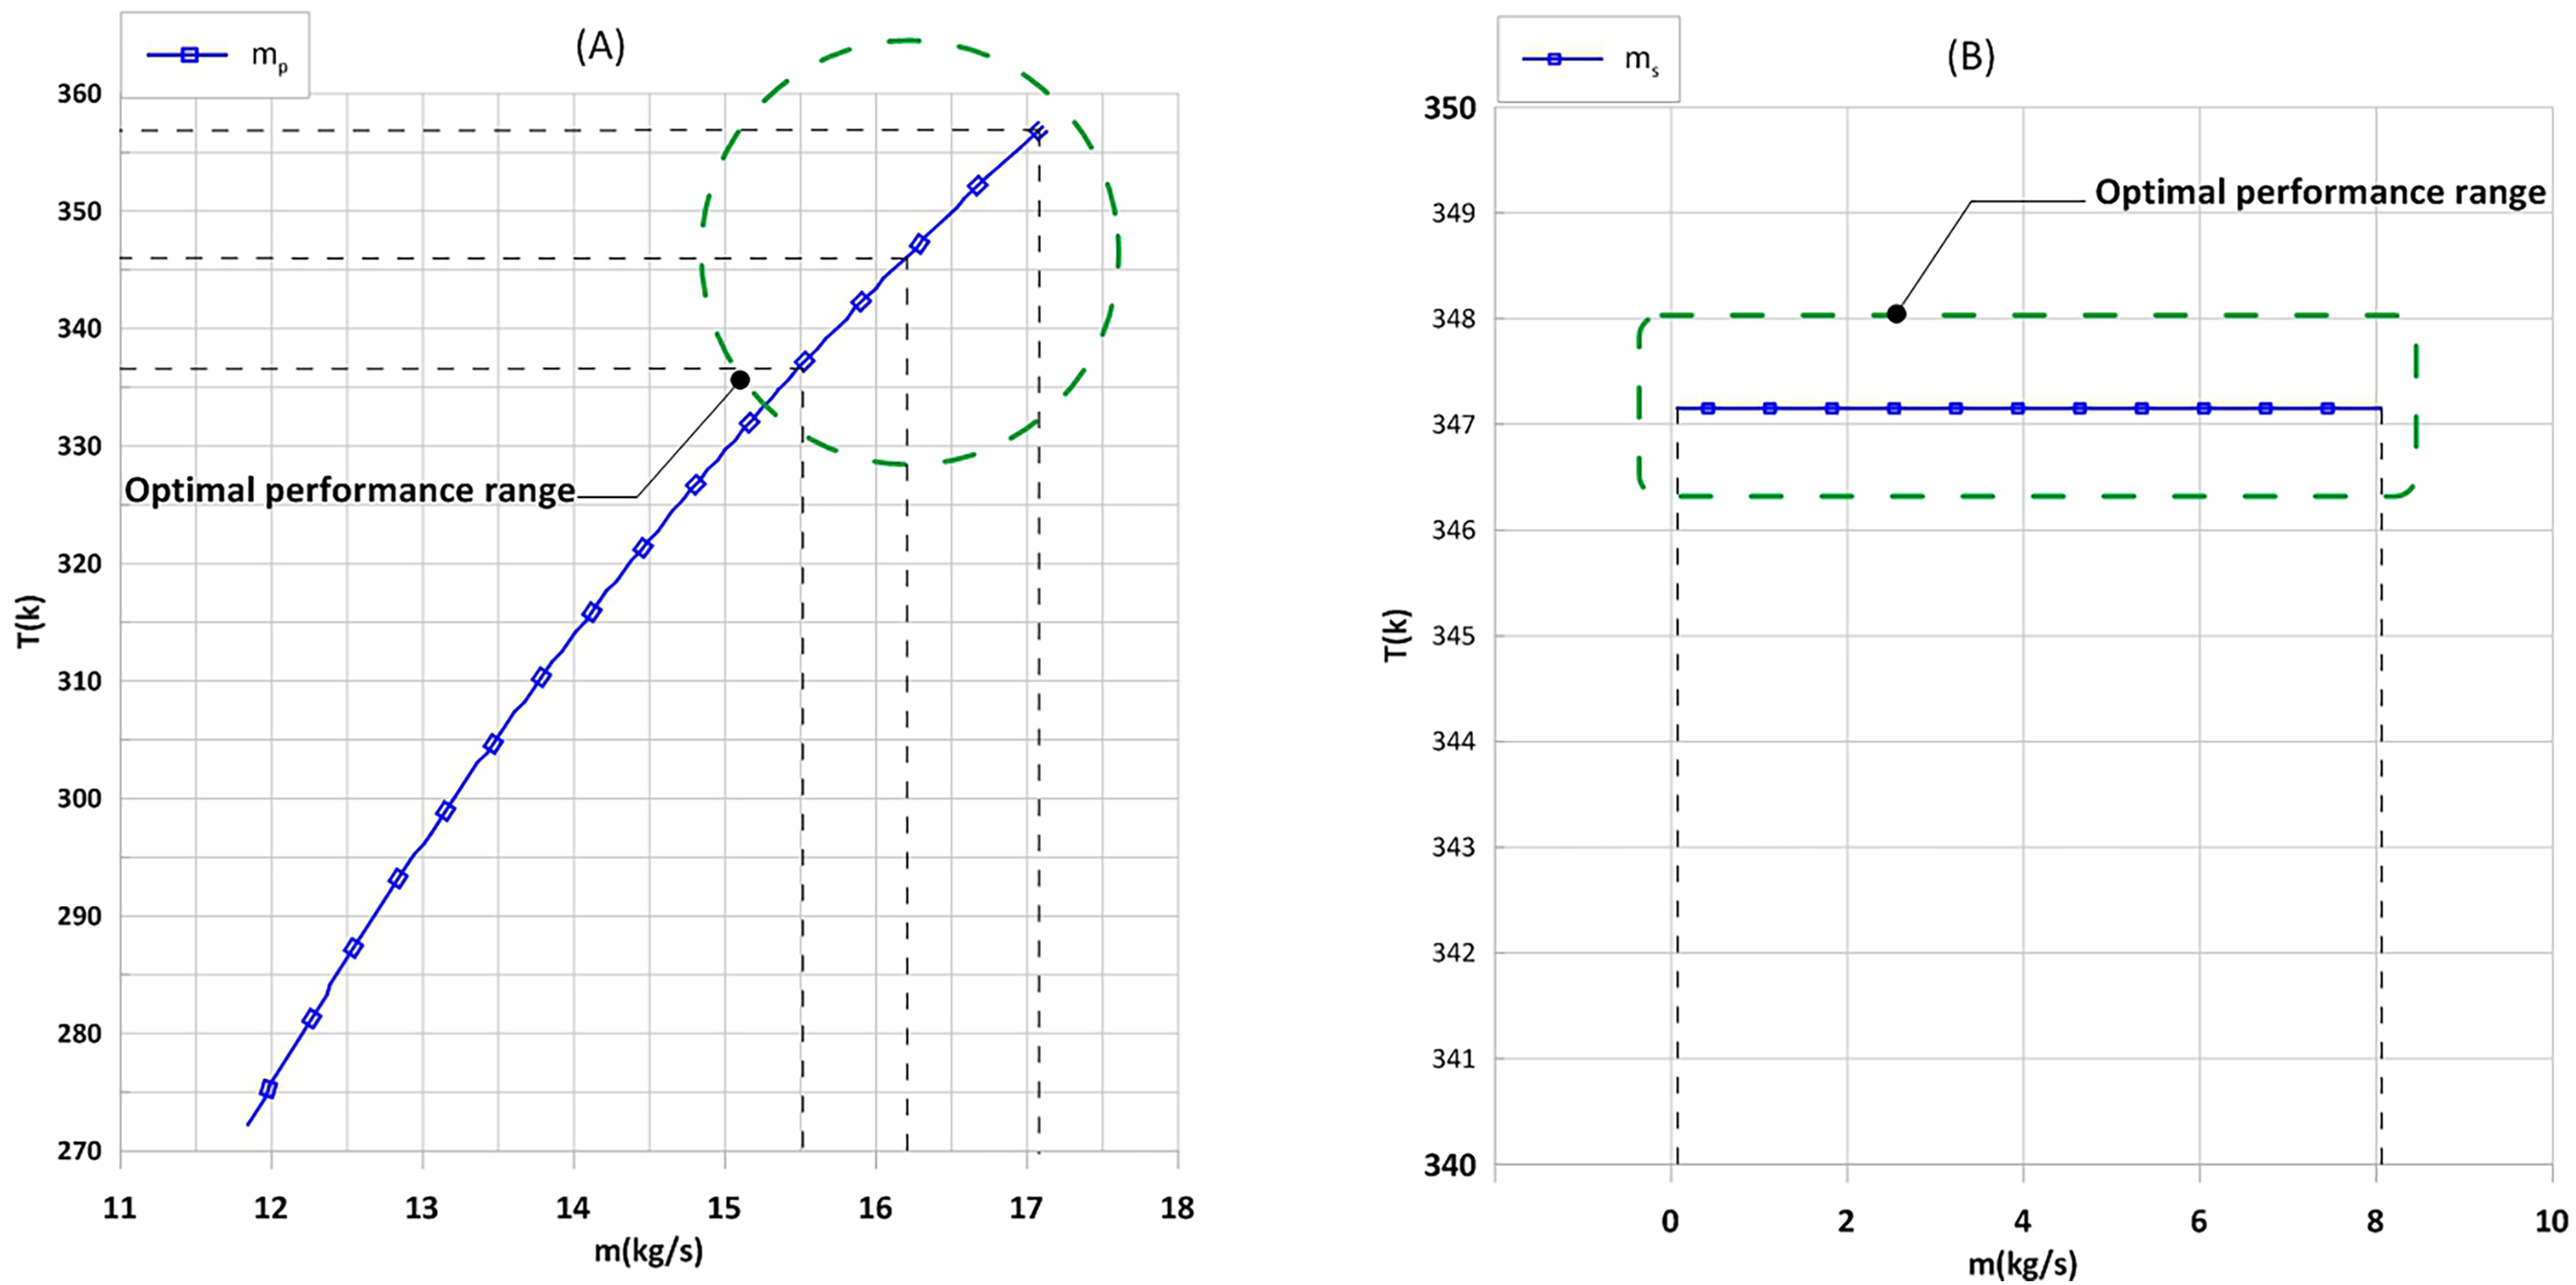
Optimal range of distribution and transmission network performance.
Analyzing different types of energy distribution and transmission networks
In central facilities, the optimal distribution of thermal energy is a selection of piping methods in main facilities to transfer thermal energy to consumption units following the amount of energy demand. Agents, including environmental conditions, the distance of consumption units to the main facilities, economic factors, and project conditions can significantly impact the piping method. The types of conventional piping methods based on the American Heating, Cooling, and Air Conditioning Association standard include single-pipe and two-pipe systems. Two-pipe systems are divided into direct return piping systems and reverse return piping systems. Selecting the best piping method by combining the effective factors in the optimal distribution of thermal energy in central facilities within the optimal range of performance can increase the availability of energy in consumption units, improve the efficiency of energy generators, and reduce energy wastage in the transmission path. Power, distribution, and transmission systems can be defined in operational conditions as SSDs systems and MSD systems. These systems differ in the type of operations in the transmission network energy flow distribution mechanism. In single-stage head and flow distribution systems, the flow from a generator to a consumption unit is provided by one or several parallel pumps in the network. In the best case, the performance range of this system will be within the optimal design range in the energy consumption unit. Unlike SSD systems, it will be possible to operate the system within the optimal design range in both energy-producing and energy-consuming regions in MSD systems due to the use of the flow separation method in different parts. In this system, the head and flow in each section are provided by an independent pumping system. As a result, this system will be more efficient in reducing energy consumption than the single-stage system.
Single-stage distribution systems (SSD)
In the SSD system, consumers send their energy requests to the generator via the transmission network. The energy generator produces thermal energy in accordance with the necessary amount of energy. Power is transferred to consumers via the transmission network. In this system, the flow rate in the transmission network is constant and equal to the maximum fluid flow rate to supply the heat load in the consumption units. As a result, it is impossible to change the flow rate based on the requests of the consumption units. In this case, the temperature difference is variable and dependent on the energy demand in the system. As stated earlier, energy demand in consumption units has a direct relationship with environmental temperature variations. The proposed method in the system performance within the optimal design range is to control the network capacity by applying the capacity control function through two or more pumps in accordance with the network capacity. Therefore, it allows us to apply different scenarios in the control system and somehow put the operational conditions on the consumer side within the design range. In this method, it is impossible to increase the flow rate in the generator part due to the use of a single-stage energy distribution network.
SSD modeling
According to equation (10), the amount of water flow carrying the system heat load was considered the objective function in this system, and the values of energy demand and system temperature were used as variables. The energy demand and the working scenario of pumps in the transmission network were used for performance evaluation. The amount of energy consumption in consumption units was calculated through the HDD method as the fundamental energy consumption values applied to the process. Variations in temperature and entropy values of the system were calculated with respect to the objective function constraints. Hence, the minimum flow rate of water carrying the thermal load enters the transmission network in different stages based on the scenario applied in different weather conditions. The amount of flow in two plans of frigid and cold weather, according to equation (25), was supplied by two pump devices with ½ hp consumption. Figure 11(a) depicts the performance range of the pumps. Accordingly, in the temperature range between 18°C and 12°C, one pump enters the circuit, whereas both pumps are on in the temperature range below 12°C. Figure 8 reports the system simulation results and the functional diagram of the pumps:

Simulating performance ranges of pumps in the single-stage distribution system.
Equation (17) was employed to calculate heat flux by changing the generator by considering the average convection coefficient
Values and variables in calculating the thermal flux of energy generator in the single-stage distribution system.

Calculation of fuel consumption (FD) 6
The thermal energy required to supply the thermal load of the building is provided by the energy generator using various thermal burners. Based on the thermal capacity of the energy generator, a thermal burner with a thermal total
Values and variables in calculating the energy generating heat flux in the SSD.

Energy consumption in SSD
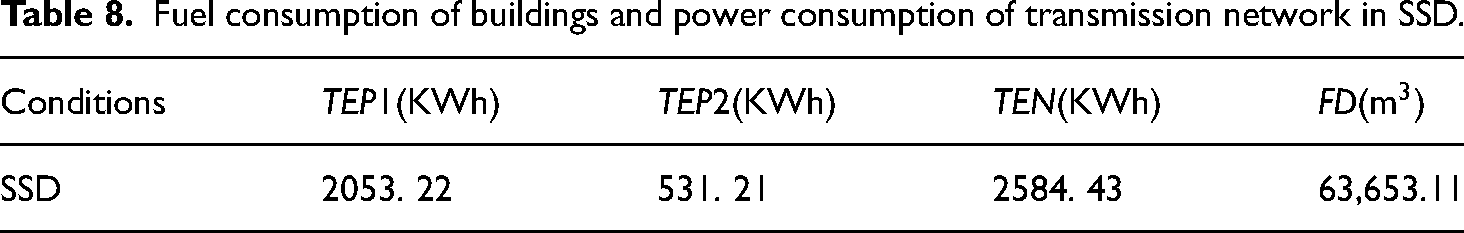
Table 8 reports the simulation results in the annual time frame including energy consumption of transmission network (TEP1) and (TEP2) total electrical energy required for pumps (TEN) as well as fuel consumption of buildings and FD. Comparing these results with the base values within the optimal range of network performance indicated the deviation rate of 7.24% in the reduction of generated thermal flux and a 4.5% increase in energy losses compared with the optimal conditions. The average network temperature difference
Fuel consumption of buildings and power consumption of transmission network in SSD.
Multi-stage distribution
According to Figure 5(a), the working conditions of the pump and the equivalent of 16.26 kg/s were considered in the primary circuit under design conditions to improve the generator efficiency. In this system, the working conditions of the pump in the secondary circuit in peak mode of consumption load and the equivalent of 8.06 kg/s were also considered to enhance the efficiency in the consumer sector. In this case, the flow intensity in the primary network will be larger than in that of the secondary network (
Scenario 1: In this case (

An essential advantage of this method is to expand the control range of the system capacity in proportion to the total thermal load capacity of the building. For instance, in hotels or retail teams where the thermal load capacity in consumption units depends on the passenger capacity or use of the business unit, using this method can reduce the energy consumption of the building. The primary operating range of the generator is used to provide the maximum thermal load. The building is selected from the first scenario, and the air temperature is less than 3.42°C. In this condition, electric heaters with low thermal capacity can be used as secondary generators at the entrance of each consumption unit, in which the control will be proportional to the request of energy consumers locally. To create the second condition when the primary generator enters the network, the temperature of the separator is reduced and set to 65°C. Generally, the thermal energy generated in the central system is based on the specific energy level depending on the project conditions. It is then directed to the consumption units through the distribution and transmission network, and the energy deficit is compensated for locally in the consumption units.
Multistage distribution modeling
In this system, the amount of discharge is considered in the initial fixed network. To benefit from the maximum thermal capacity of the generator, according to Figure 10(a), the optimal range of energy generating performance is between 16.2 (kg/s) and 17.1 (kg/s). Accordingly, the total amount of secondary network discharge is supplied by a circulation pump with two horsepower consumption. This pump operation in operational conditions follows is controlled by equations (26) and (27). The flow rate of water carrying the system thermal load in the secondary transmission network is different and is obtained from equation (10). In this system, the amount of water discharge carrying the thermal load of the system is used as the target function, and the amount of energy requested and the temperature of the system are considered variables. Temperature variations in the annual period was calculated in Metronome to determine the amount of energy request and define the scenario of the pumps in the transmission network. It was calculated as the fundamental energy consumption values and applied to the process. Variations in temperature and entropy values of the system were calculated in accordance with the constraints of the target function. The lowest flow of water carrying thermal charge with a constant temperature difference of 10 °C entered the secondary network. The total amount of secondary network discharge was supplied by a pump machine with a consumption of 1 hp. The requested discharge surplus was entered into the flow separator via a bypass pipe, according to Figure 5. In this system, the amount of discharge is adjusted with respect to the request of units consumed by a motorized three-way valve. Figure 12 demonstrates the results of system simulation in the annual time frame and the pump work diagram in the secondary transmission network. In this form, the performance of the transmission network in supplying the fluid discharge carrying the thermal load of the building

Simulation of pump work in the secondary transmission network.
According to the simulation results, the thermal flux of the generator was equal to 354.65 k obtained from equation (17). The average convection coefficient
Values and variables in calculating the thermal flux of energy generator in the multi-stage distribution system.

By adapting the system performance range to the optimal performance range shown in Figure 10, the deviation of this network from the optimal performance range was determined. Accordingly, the network in the MSD system based on the discharge adjustment to the request of consumers on bypass route in the consumption unit will be within the optimal range of performance. The productive sector, according to the use of pumps and flow separators, will be in adjusted to the optimal degree of effective performance.
Calculation of fuel consumption (FD)
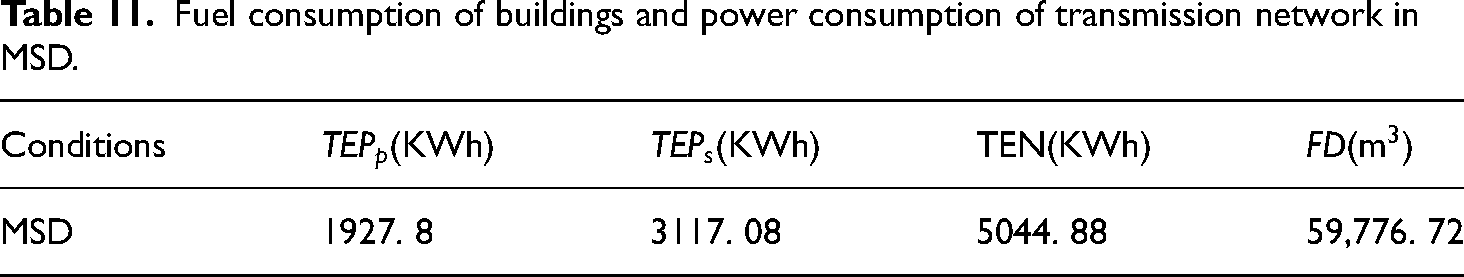
The fuel consumed in the building for supplying the thermal load was calculated through equation (18) with the default problem within the system performance range (Table 10). Accordingly, the total annual fuel consumption of the sample project through the MSD system was 59,776.72 m3 per year, which is estimated to be 6% lower than the fuel consumption in a SSD system.
Values and variables in calculating the thermal flux of energy generator in MSD.

Energy consumption in MSD systems
Table 11 reports the simulation results in the annual time frame including primary and secondary transmission network energy consumption, total
Fuel consumption of buildings and power consumption of transmission network in MSD.
Economic analysis
In this study, the average cost of power per kilowatt hour
Accordingly, Table 12 reports the total costs of fuel consumption
Calculation of

Moreover, the costs of benefits of saving
Costs of energy saving gains function
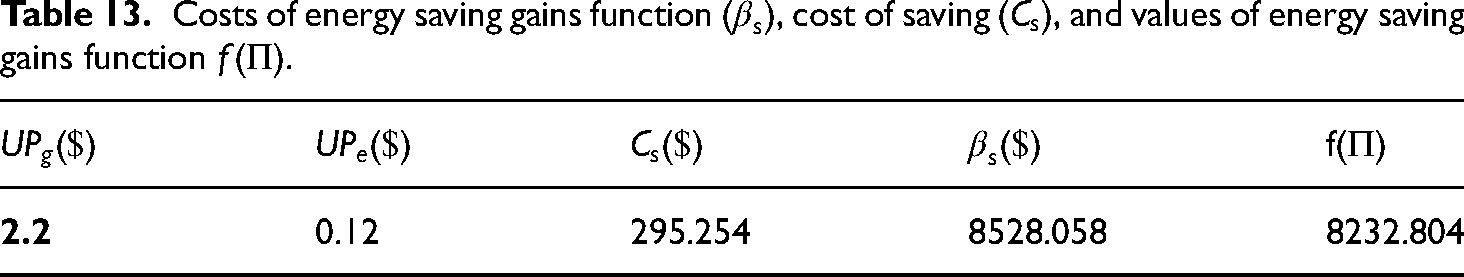
Substituting energy consumption costs in the SSD and MSD systems, the value of energy saving gains function
The results from the economic analysis of the project justify the superiority of MSD over SSD.
Comparison of results
In this study, thermal energy distribution and transmission networks in household applications were analyzed and evaluated by SSD systems and MSD systems through the flow bypass method

The results of comparing the required energy consumption in SSD and MSD systems.
Comparison of fuel consumption and electricity consumption required by transmission network in

In this study, a two-stage distribution system with bypass flow was used to design a MSD system. Evidently, changing the design method and using these novel techniques reduced fuel consumption by 6% and increased power consumption of transmission networks by 95% compared with single-stage transmission networks (SSD). Furthermore, this method reduced energy loss by 4.3% on the path. In conclusion, transmission networks play a key role in reducing or increasing the energy consumption of buildings. Moreover, the economic analysis shows about a 6% reduction in the total annual cost of energy consumption in buildings. The results suggest that MSD more effectively reduces the total energy consumption in buildings than SSD.
Conclusion
This study analyzed the effective factors in the thermal energy distribution system from the generator to the consumer in domestic use based on the amount of energy demand in the consumption units in a mathematical model to increase the availability of energy in the consumption units and reduce the energy wastage on the transmission path. For this purpose, technical and economic analyses were conducted. Temperature variations were calculated and simulated in Metronome, and the amount of energy consumption was measured in consumption units through the HDD method. To achieve optimal energy distribution conditions according to the consumer demand, the optimal performance ranges of the transmission network in the consumer and energy generator sectors were used as a base index. Hence, the distribution and transmission network was simulated with SSD and MSD methods. The deviation of each technique was calculated with respect to the base conditions. If the working temperature of the system is checked, the increase in the temperature of the generator along with the rise in the temperature difference of the system can cause an increase in the amount of exergy. Hence, the standard temperature of the generator with the highest temperature in spa systems was considered to be 85°C.
This study conducted technical and economic analyses of factors improving energy efficiency in household use by improving the distribution network. According to the comparison of the results obtained from the simulation of the SSD system with the fundamental values in the optimal range of the distribution network performance, the amount of deviation was 7.24% in the reduction of the heat flux of the generator. There was also a 4.5% increase in the energy losses compared with the conditions. The results obtained from the simulation of the MSD system with the flow bypass method
Given the energy saving function, the economic analysis of the system can show that a multi-stage distribution
The second law of thermodynamics was employed in this study to analyze the working temperature of the system, which is one of the basic principles of the energy explanation system design in any networks. Hence, the system entropy was explored at different levels. Further operations can be performed as the temperature increases. Apparently, reducing energy consumption and the system operating temperature in different weather conditions might be a wrong and dishonest belief.
Design parameters in a transmission network are related to various factors such as building use, regional weather conditions, and energy consumption in consumer units. According to the research findings, the use of BIM design is a favorite method adopted by engineers. In the design, the use of building facilities can significantly affect the type of design and reduce the costs of implementation and operations of a building.
In general, the following features and advantages of using the MSD system with the flow bypass method can be beneficial to the design and operation of a transmission network:
Broadening the scope of system capacity control according to energy demand in consumption units Mitigating fuel consumption Decreasing energy loss in the transmission network Enhancing the system exergy Improving the system efficiency in productive sectors and energy consumption units
Footnotes
Nomenclature
Subscripts
Abbreviations
Declaration of conflicting interests
The author(s) declared no potential conflicts of interest with respect to the research, authorship, and/or publication of this article.
Funding
The author(s) received no financial support for the research, authorship, and/or publication of this article.