
Abstract
In order to explore the characteristics of pressure pulsation signals and energy distribution of water flow at the guide vane considering impeller–guide vane interaction. The numerical simulation of the vertical axial flow pump device's steady and unsteady three-dimensional flow fields was carried out. The Hilbert–Huang method was used to conduct empirical mode decomposition decomposition and Hilbert spectrum analysis of pressure pulsation signal at each monitoring point in the inlet and outlet regions of the guide vane. The results show: Under the condition of 0.3Qbep, the internal pressure of the guide vane is obviously affected by the impeller, and there are large block-shaped vortex structures in the guide vane. Under the operating conditions of 1.0Qbep and 1.2Qbep, the size of the pressure area in the guide vane is basically not affected by the impeller, and the vortex structures in the guide vane are concentrated near the outlet of the guide vanes, and there are long strip-shaped vortex structures at the edge of the guide vane. The size and number of vortex structures decrease with the increase in flow rate. The pressure pulsation signal at the inlet of the guide vane is affected by the rotation of the impeller and exhibits good periodicity, with the main frequency centered around 146 Hz, and the energy ratio of the main frequency is up to 97.7%. There are low-frequency signals below 100 Hz and high-frequency signals fluctuating around 146 Hz in all three flow conditions. When the flow rate increases, the fluctuation amplitude of the high-frequency signal increases. The flow rate has a significant impact on the water flow at the outlet of the guide vane. At 0.3Qbep, its frequency is distributed in the range of 0–500 Hz, mainly concentrated in the area below 400 Hz. At 1.0Qbep, the frequency of pressure pulsation is distributed below 250 Hz after the guiding function of the guide vane. At 1.2Qbep, the water flow is mainly controlled by the rotation of the impeller, and after the energy recovery of the guide vane, its main frequency is still concentrated around 150 Hz, which is 337.2% and 268.5% of 0.3Qbep and 1.0Qbep. Under the working condition of 0.3Qbep, the proportion of intrinsic mode function energy corresponding to the dominant frequency at the center of the guide vane inlet is as high as 95.9%, and the proportion of intrinsic mode function energy corresponding to the dominant frequency at the shroud side and hub side of the guide vane is rather low. If the flow rate rises from 0.3Qbep to 1.2Qbep, the proportion of intrinsic mode function energy increases by more than 42%. Under the working conditions of 0.3Qbep and 1.0Qbep, the main frequency of pressure pulsation signal of water flow at the guide vane outlet is less affected by the impeller and the corresponding energy proportion is low. Under the working condition of 1.2Qbep, the main frequency of pressure pulsation signal is 4 times the rotational frequency and the corresponding energy proportion is higher than 60%.
Introduction
Due to the advantages of stable operation, high reliability, convenient installation and maintenance, and mature design technology, axial flow pumps are widely used in large and medium-sized pump stations with large flow and low head, and have been widely used in China's key projects such as the South to North Water Transfer Project, the Yangtze River to Huaihe River Water Diversion Project, and the Dongshen Water Supply Project. Impeller and guide vane are important components of the vertical axial flow pump device (VAFPD), and their matching of hydraulic performance directly affects the overall working performance of the pump device: The role of the impeller is to convert mechanical energy into kinetic energy, and the flow uniformity and stability are also destroyed when the water gets energy through the work of the impeller rotation, with a large velocity circulation. The guide vane recovers the water flow velocity circulation at the outlet of the impeller, converts kinetic energy into pressure energy, and makes the water flow enter the outlet conduit smoothly, reducing the hydraulic loss. However, if the guide vane does not match the impeller, the turbulent water flow inside the guide vane will cause serious instability of the water flow in the outlet conduit, reduce the hydraulic performance of the pump device, cause unit vibration, and even lead to safety accidents of the pump device in serious cases. Therefore, It is of great scientific significance and engineering value to study the internal flow characteristics of the guide vane under the condition of static and dynamic interference between the impeller and the guide vane based on the full flow conduit of the axial flow pump device. Due to the impeller-guide vane interaction, the flow pattern in the guide vane is very complex due to the impact of the rotation of the impeller, and the flow near the impeller outlet is also impacted by the number and structure of the guide vane, so the flow pulsation in the guide vane also has strong complexity.
At present, several academics have conducted in-depth research on the axial flow pump device, Zhang et al.,1,2 Feng et al. 3 and many other scholars4–6 have carried out rich research on blade tip clearance; Fu et al., 7 Kan et al. 8 and Zhang et al. 9 studied the operating characteristics of VAFPD under special conditions; Many scholars10,11 explored the energy characteristics of VAFPD; Mu et al. 12 and Zhang et al. 13 optimized the structure of the VAFPD, improving the hydraulic performance of the pump device; Qian et al., 14 Zhang et al. 15 and Lin et al. 16 explored the flow field characteristics of each flow passage component of the VAFPD. Among them, the study of the water pressure pulsation signals (PPSs) of the axial flow pump device is very meaningful. Monitoring and analyzing the PPS characteristics of water flow is an important means of monitoring and predicting the status of the pump device, as well as ensuring its safe and reliable operation. At present, the analysis of the water PPS inside the pump device is very rich, such as Yang et al. 17 combined physical model test and numerical simulation to explore the flow field's variation law in the hump section of the siphon outlet conduit, the PPS and the influence of pier separation on the pressure and velocity distribution on the inner wall of the straight outlet duct and its vicinity. Zhang 18 et al. studied the unsteady flow structure and PPS characteristics in a centrifugal pump using a hybrid Reynolds averaged Navier Stokes/large eddy simulations method. Wang 19 et al. analyzed the frequency domain characteristics of PPS in a mixed flow pump as a turbine based on Fourier frequency transform. Al-Obaidi 20 and Al-Obaidi and Mohammed 21 analyzed the effect of various impeller blade angles on characteristic of the axial pump with pressure fluctuations based on time and frequency-domain Investigations. He 22 et al. explored the PPS characteristics of a pump-turbine in a draft tube. It can be seen that the current research on the internal flow pulsation characteristics of the pump device has achieved many results and has a high reference value. However, the analysis methods of pulsation time-frequency signals mainly focus on Fourier frequency transform,23–26 short-time Fourier transform27–30 and wavelet transform.31–33 Fourier transform is only suitable for the analysis of stationary signals with fixed frequency, and is not suitable for the analysis of non-stationary and non-linear complex pulsation signals.34–36 The wavelet transform is essentially a window-adjustable Fourier transform, and does not get rid of the constraints of Fourier transform.37,38 The decomposition effect depends largely on the selection of wavelet basis functions. In addition, although previous studies have identified the time-domain and frequency-domain characteristics of PPS of internal water flow in pump devices under different conditions,39,40 which are helpful for the hydraulic design of axial flow pumps, in the spectral analysis of previous studies, the presence of energy at a certain frequency means that sine or cosine waves with that frequency exist over the entire signal duration, It is impossible to analyze the possibility and specific occurrence time of a wave of this frequency occurring at a certain time during the entire duration of the signal. Hilbert–Huang transform (HHT) overcomes these limitations: If there is energy at a certain frequency in the signal, it indicates that there must be oscillation at that frequency, which can accurately reflect the actual frequency component of the signal and has certain statistical significance.
Considering the interaction between the impeller and guide vane, the complexity of the PPS caused by the turbulent flow of water in the inlet and outlet areas of the guide vane, the internal vortex structure of the guide vane was explored, and the Hilbert–Huang transform method was used to analyze the water pressure pulsation caused by dynamic and static interference in the pump device. At the same time, the three-dimensional Hilbert time spectrum including time, frequency, and amplitude was analyzed, Determine the energy proportion of different frequency bands in the PPS, which can be used to monitor the operating status of the pump device during the operation and maintenance of the pump station, timely detect possible faults, and provide support for noise reduction and stability analysis of the pump device.
Research object and test device
The VAFPD is the subject of this paper. There are five parts to the flow passage: the elbow inlet conduit, impeller, guide vane, 60° elbow, and siphon outlet conduit. The three-dimensional model is shown in Figure 1, and the main design parameters are shown in Table 1.

Three-dimensional model structure of vertical axial flow pump device (VAFPD).
Main design parameters of vertical axial flow pump device (VAFPD).

On the closed test-bed of hydraulic machinery in the key laboratory of Jiangsu province, the model test of VAFPD is conducted. The VAFPD model is shown in Figure 2(a) and the three-dimensional model of the test bench is shown in Figure 2(b).

Physical model test bench for VAFPD. (a) VAFPD model. (1) closed inlet tank (2) elbow inlet conduit (3) axial flow pump (4) 60° elbow (5) siphon outlet conduit (6) main pump motor (7) closed outlet tank (8) PVC pipe (9) pipeline centrifugal pump (10) electromagnetic flowmeter (11) butterfly valve. (b) Three dimensional diagram. VAFPD: vertical axial flow pump device; PVC: polyvinyl chloride.
Numerical simulation and experimental verification
Turbulence model and calculation boundary condition setting
Numerical simulation of the pump device was conducted using ANSYS CFX software. The fluid motion in the pump device follows the conservation of mass, momentum, and energy. It can be described as incompressible three-dimensional viscous turbulence. The fluid inside the pump follows the continuity and momentum equations without considering the heat exchange between the components, the continuity equation is40,41:
The momentum equation is40,41:
The RNG k-ε turbulence model can better deal with the problems of high strain rate and curved streamlines, and improve simulating the rotating flow and vortex flow in the average flow. The RNG k-ε turbulence model has good adaptability in the numerical calculation of the flow field in the pump device.7,42Therefore, this paper uses the RNG k-ε model to simulate the VAFPD, the governing equation is 42 :


Among them: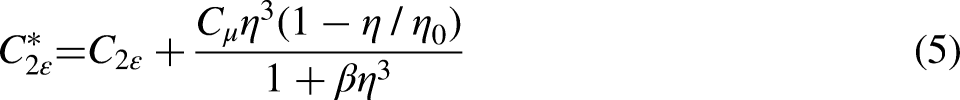


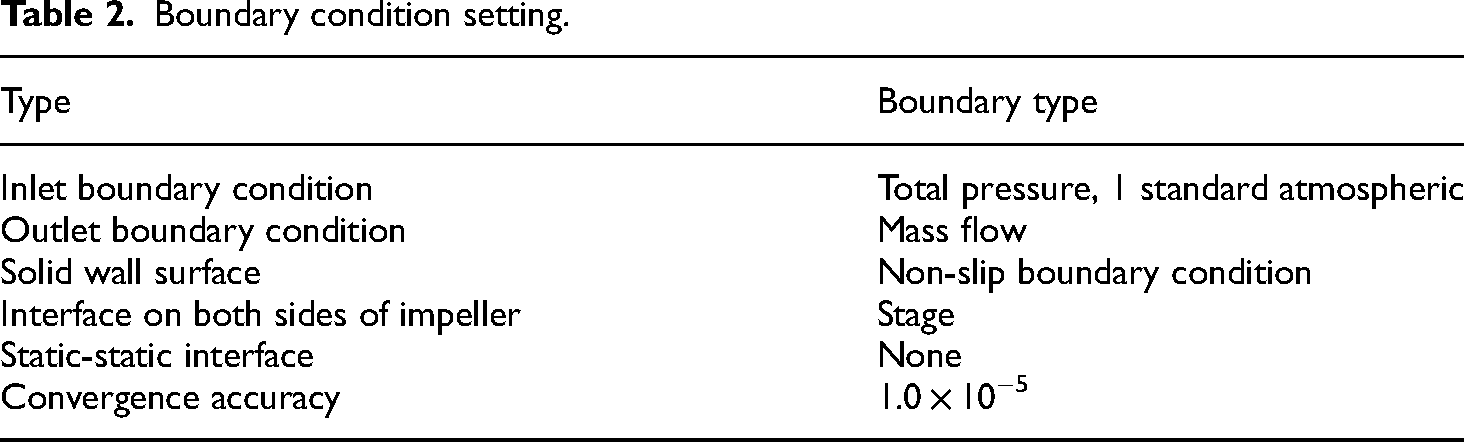
The boundary conditions are specified in the style depicted in Table 2 with reference to literary works3,43 in order to more accurately simulate the real flow inside the pump device.
Boundary condition setting.
The interface on both sides of the impeller is set to Transient Rotor Stator for unsteady calculation. The determination of the time step for unsteady computation satisfies the following criterion of Courant number
44
:
According to the sampling theorem fs.max
Division of computational domain grids
Unstructured grid is widely used because of its advantages of convenient generation and automatic adaptation to various geometric figures. However, a structured grid still has the advantages of fast generation speed, high grid quality and capturing physical surfaces accurately. Using the advantages of a structured grid, this paper uses ANSYS TurboGrid software to mesh the calculation domain of the impeller and guide vane, and uses ICEM CFD software to generate structured grid topology on the inlet conduit, outlet conduit, and elbows, and uses O-type topology for encryption. The wall grid of each flow structure is shown in Figure 3.

Wall mesh of each flow structure of pump device.
It is vital to verify grid number in order to minimize the effect of grid size and number of grids on the results of calculations. When the grid is refined to a specific degree, the solution becomes less sensitive to grid number, indicating that the change in grid number won't have a significant impact on the solution results. At this time, it can be considered that the numerical calculation is independent of the number of grids. Under the optimal flow working condition (1.0Qbep), the results of different grid numbers on the efficiency of the VAFPD are selected for mesh number independence analysis. A total of 8 mesh schemes are used for comparison, and the results are shown in Figure 4. The efficiency calculation formula of the pump device is
45
:
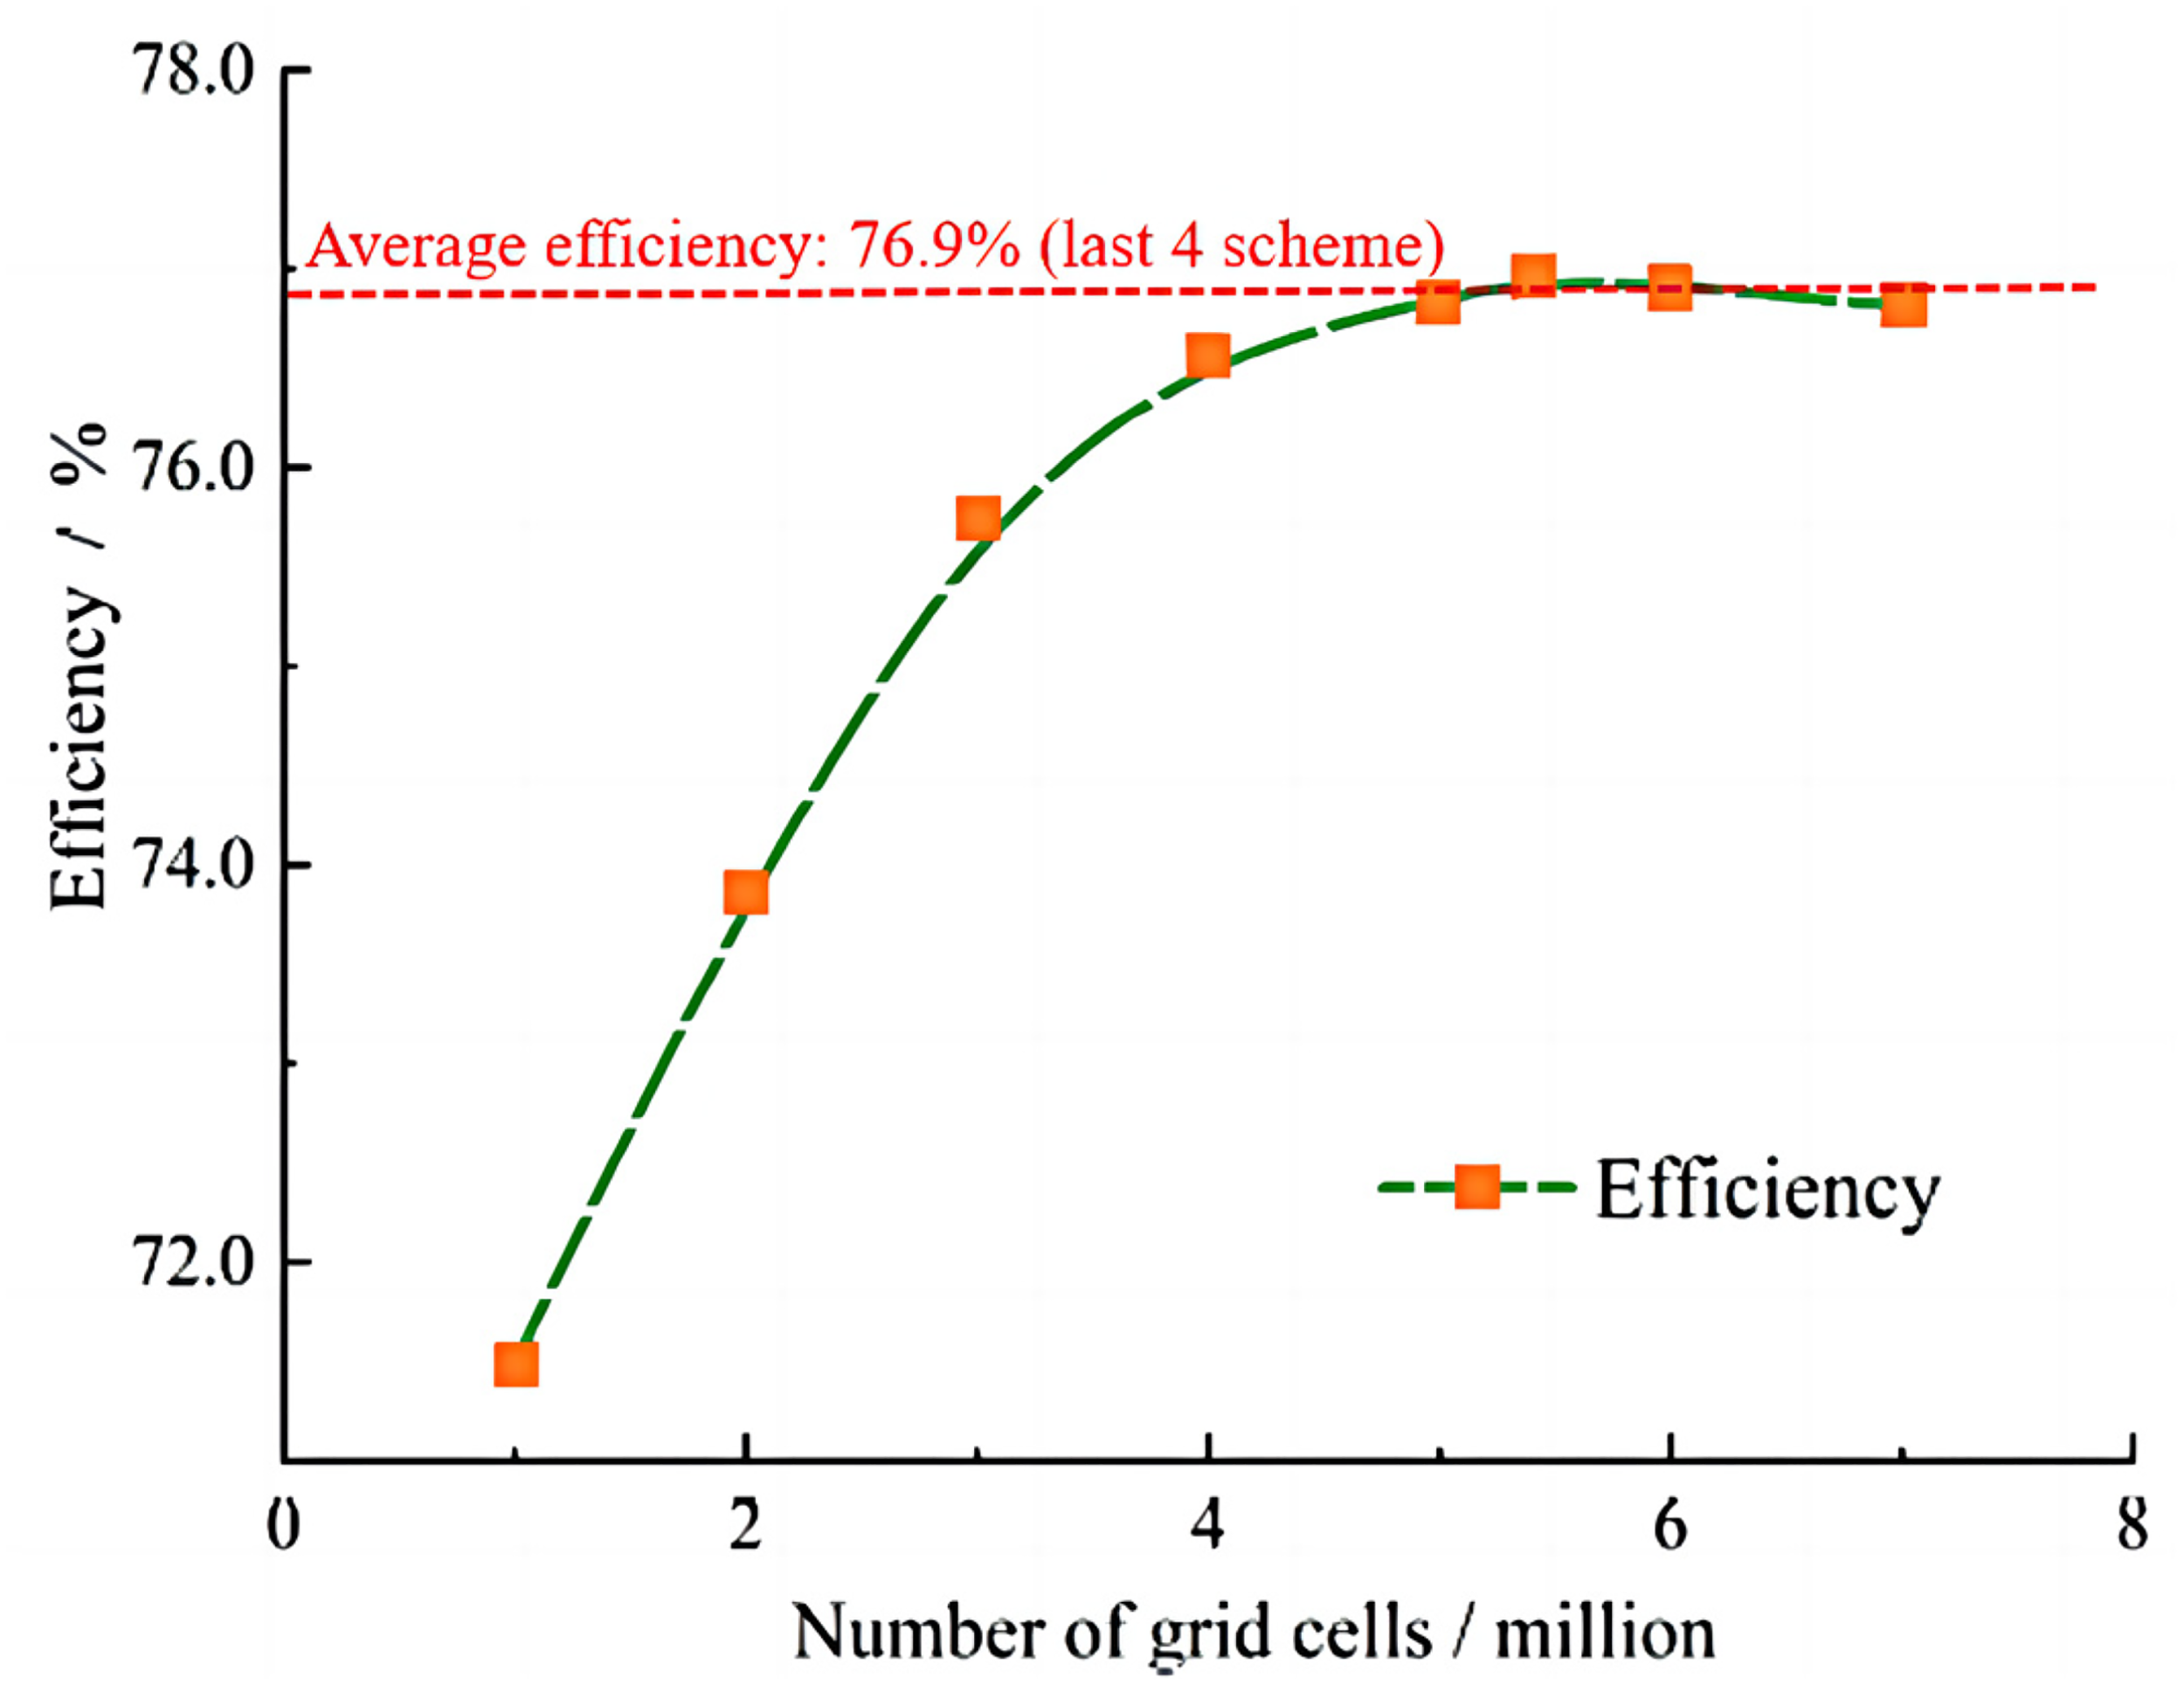
Pump device efficiency curve with different grid numbers.
Where Q is the flow rate, H is the head, Pa is the pump shaft power.
As can be seen from the Figure 4, when there are 5.1 million grids instead of 3.9 million, the rate of change in pump efficiency decreases noticeably, and the absolute deviation is less than 0.5%, reaching 0.32%, meeting the requirements for the calculation. When the grid is encrypted to 5.47 million, the absolute deviation of the pump device efficiency is further reduced to 0.14%, and then the efficiency change rate of the pump device tends to be stable. Therefore, this paper selects the scheme with about 5.47 million grids number to numerically calculate the VAFPD.
Utilizing the grid convergence index (GCI) to confirm the grid convergence of the pump device, and selecting the grid number that allows the numerical solution to reach a quasi-steady state.44,46 The device efficiency under the optimal flow working condition 1.0Qbep is selected as the parameter to calculate the GCI results. The results are shown in Table 3. CGI decreases gradually with the grid densification, which is less than 1%, illustrating that the dispersion error is small. 42
Grid convergence index (GCI).

After mesh independence and convergence analysis, the numerical calculation of the VAFPD was finally determined under the total mesh number of 5.47 million.
Experimental verification
According to SL 140-2006 “Code for model pump and its installation acceptance tests” and IEC60193:2019 “Hydraulic turbines, storage pumps and pump turbines Model acceptance tests,” the pump device's energy performance was tested. The efficiency and head test values of the VAFPD at 2200 r/min speed were tested. The results are shown in Figure 5 that display that the trend of the performance curve obtained by the numerical simulation and the experimental method is consistent. The numerical calculation results and the experimental results accord well in the region of high efficiency. The head curve is slightly different in the small flow region, mainly due to the complex flow pattern in the small flow region. The efficiency curve is slightly different in the large flow region. In the vicinity of the optimal conditions (1.0Qbep), the relative error of the head is 2.36%, the absolute error of efficiency is 1.87%; in the range of 0.3Qbep∼1.2Qbep, the relative error of the head and the absolute error of efficiency are not more than 5%. In summary, through comparison, it can be concluded that the results of the numerical calculations and the findings from the tests on the physical model correspond well. The numerical calculation results are accurate in reflecting the internal flow features of the VAFPD and are truthful and believable.

Pump device energy performance verification. (a) efficiency comparison (b) head comparison.
The error bar in the figure is not an accurate value, indicating the relative size. The comprehensive uncertainty of the head in the experiment is 0.01%, and the comprehensive uncertainty of the efficiency is 0.191%
Calculation method and principle
The components of HHT are the Hilbert transform and empirical mode decomposition (EMD). EMD is the core part of this method, and Huang does not assume what signals comprise based on sine signals. Instead, any complex signal can be broken down into a limited number of intrinsic mode function (IMF), and then Hilbert Transform is performed on each IMF component to obtain the instantaneous frequency with physical significance, corresponding Hilbert spectrum and energy distribution, which more intuitively presents the time-frequency characteristics of each component of the original signal.
Intrinsic mode function
The IMF needs to fulfill two requirements
34
:
In the whole data segment, the number of extreme points Ne and the number of zero-crossing N0 must be equal or not more than one, namely |N0- Ne|≤1. At any time t, the mean value of the upper envelope determined by the local maximum point and the lower envelope determined by the local minimum point is 0, that is, with regard to the time axis, the upper and lower envelopes are locally symmetric.
The above two conditions are the important basis for judging whether the signal is IMF component. The concept of IMF lays the foundation for EMD decomposition and Hilbert spectrum analysis.
Empirical mode decomposition
Usually, most signals can not meet the conditions of IMF, so EMD method is used to decompose a signal into a number of simple oscillation functions which meet the conditions of IMF components and this process is called Sifting Process. As shown in Figure 6, the specific steps of the Sifting Process are as follows
34
:
Input signal x(t). Set g(t)=x(t), calculating the local maxima and minima of g(t). Interpolate the local maxima and the local minima by a cubic spline to form upper and lower envelopes of g(t), denoted as emax(t) and emin(t), respectively. Calculate the mean m(t) of the upper and lower envelopes of g(t): Subtract m(t) from g(t) to obtain the remaining term h(t): Determine whether h(t) meets the IMF conditions, and if so, output the IMF component xn: If the IMF conditions are not met, set x(t)=h(t) and repeat steps (2)–(6) until the IMF component that meets the constraint conditions is obtained, After decomposing the IMF component xn from signal g(t), calculate the residual value r:


Empirical mode decomposition (EMD) flowchart.
Re set g(t)=r, repeat steps (2)–(7), and obtain several IMF components in sequence.
If the residual value r still has two extrema, continue to repeat steps (2)–(6) until the residual value r is a monotonic function. The original signal x(t) is decomposed into the sum of a series of intrinsic mode functions xn and residual r, i.e.
34
:
Empirical mode decomposition
For a given IMF component function x(t), we can get his Hilbert Transform results
34
:
With x(t) as the real part and y(t) as the imaginary part, an analytic signal z(t) can be constructed
32
:


Hilbert spectrum and marginal spectrum
An original non-stationary signal is decomposed into the sum of several IMF components and residuals. For each IMF component, the Hilbert transform and the corresponding analytical signal are obtained. The corresponding Hilbert spectrum is denoted by 
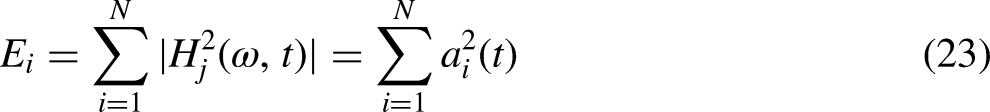

On the basis of Hilbert spectrum 
Result analysis
Analysis of internal flow field of guide vane
Figure 7 is the pressure contour of the characteristic section of the impeller and the guide vane area over time under three working conditions in a cycle. There is a large pressure gradient in the pressure distribution under 0.3Qbep condition, and there is a large low-pressure zone under the impeller domain blade at 2/3 T. The high-pressure area is mainly distributed at the shroud of the impeller domain, and one side of the guide vane body, and the area between the impeller and the guide vane shows a low-pressure area that changes with the rotation of the impeller. Under the 1.0Qbep condition, the pressure distribution between the impeller and the guide vane body gradually increases from the hub to the shroud, and the area of the high-pressure zone and the low-pressure zone does not change significantly with the rotation of the impeller. The 1.2Qbep condition is different from the other two conditions. At 2/3 T, a high-pressure zone appears below the blade. Under this condition, the high-pressure area is mainly distributed at the outlet of the guide vane, and the area between the impeller and the guide vane is mainly high-pressure. At 1/3 T and 2/3 T, there is a small range of low-pressure area at the hub of the impeller outlet.

Pressure contours of impeller and guide vane domain. (a) 0.3Qbep. (b) 1.0Qbep. (c) 1.2Qbep.
The Ω criterion is used to identify the internal vortex structure of the guide vane, which avoids the drawbacks of traditional vortex identification methods that are greatly affected by the threshold, resulting in the inability to recognize or even errors in the vortex structure in the flow field. The definition of threshold Ω is
49
:
Figure 8 shows the internal vortex structures of the guide vane under different flow conditions (threshold Ω=0.52). From the results, it can be seen that the distribution of vortex structures in the guide vane under various conditions is relatively uniform. At 0.3Qbep, the vortex structures of the guide vane mainly present a blocky distribution and have a large volume, which corresponds to the chaotic water flow and significant deformation and dissipation under this operating condition. Under the 1.0Qbep condition, the vortex structures inside the guide vane are mainly distributed near the outlet of the guide vane, and the distribution is relatively uneven. The vortex structures at the inlet are relatively small, and there is a long strip-like vortex structure at the edge of each blade of the guide vane. Under the 1.2Qbep working condition, the distribution pattern of the vortex structure inside the guide vane is basically consistent with that under the 1.0 Qbep condition, but the size and number of vortex structures have decreased to a certain extent. The long strip vortex structures on the blade edge are significantly weakened, and there is a strip-like low-speed vortex structure at the outlet directly above the guide vane body blade that is consistent with the blade curvature.
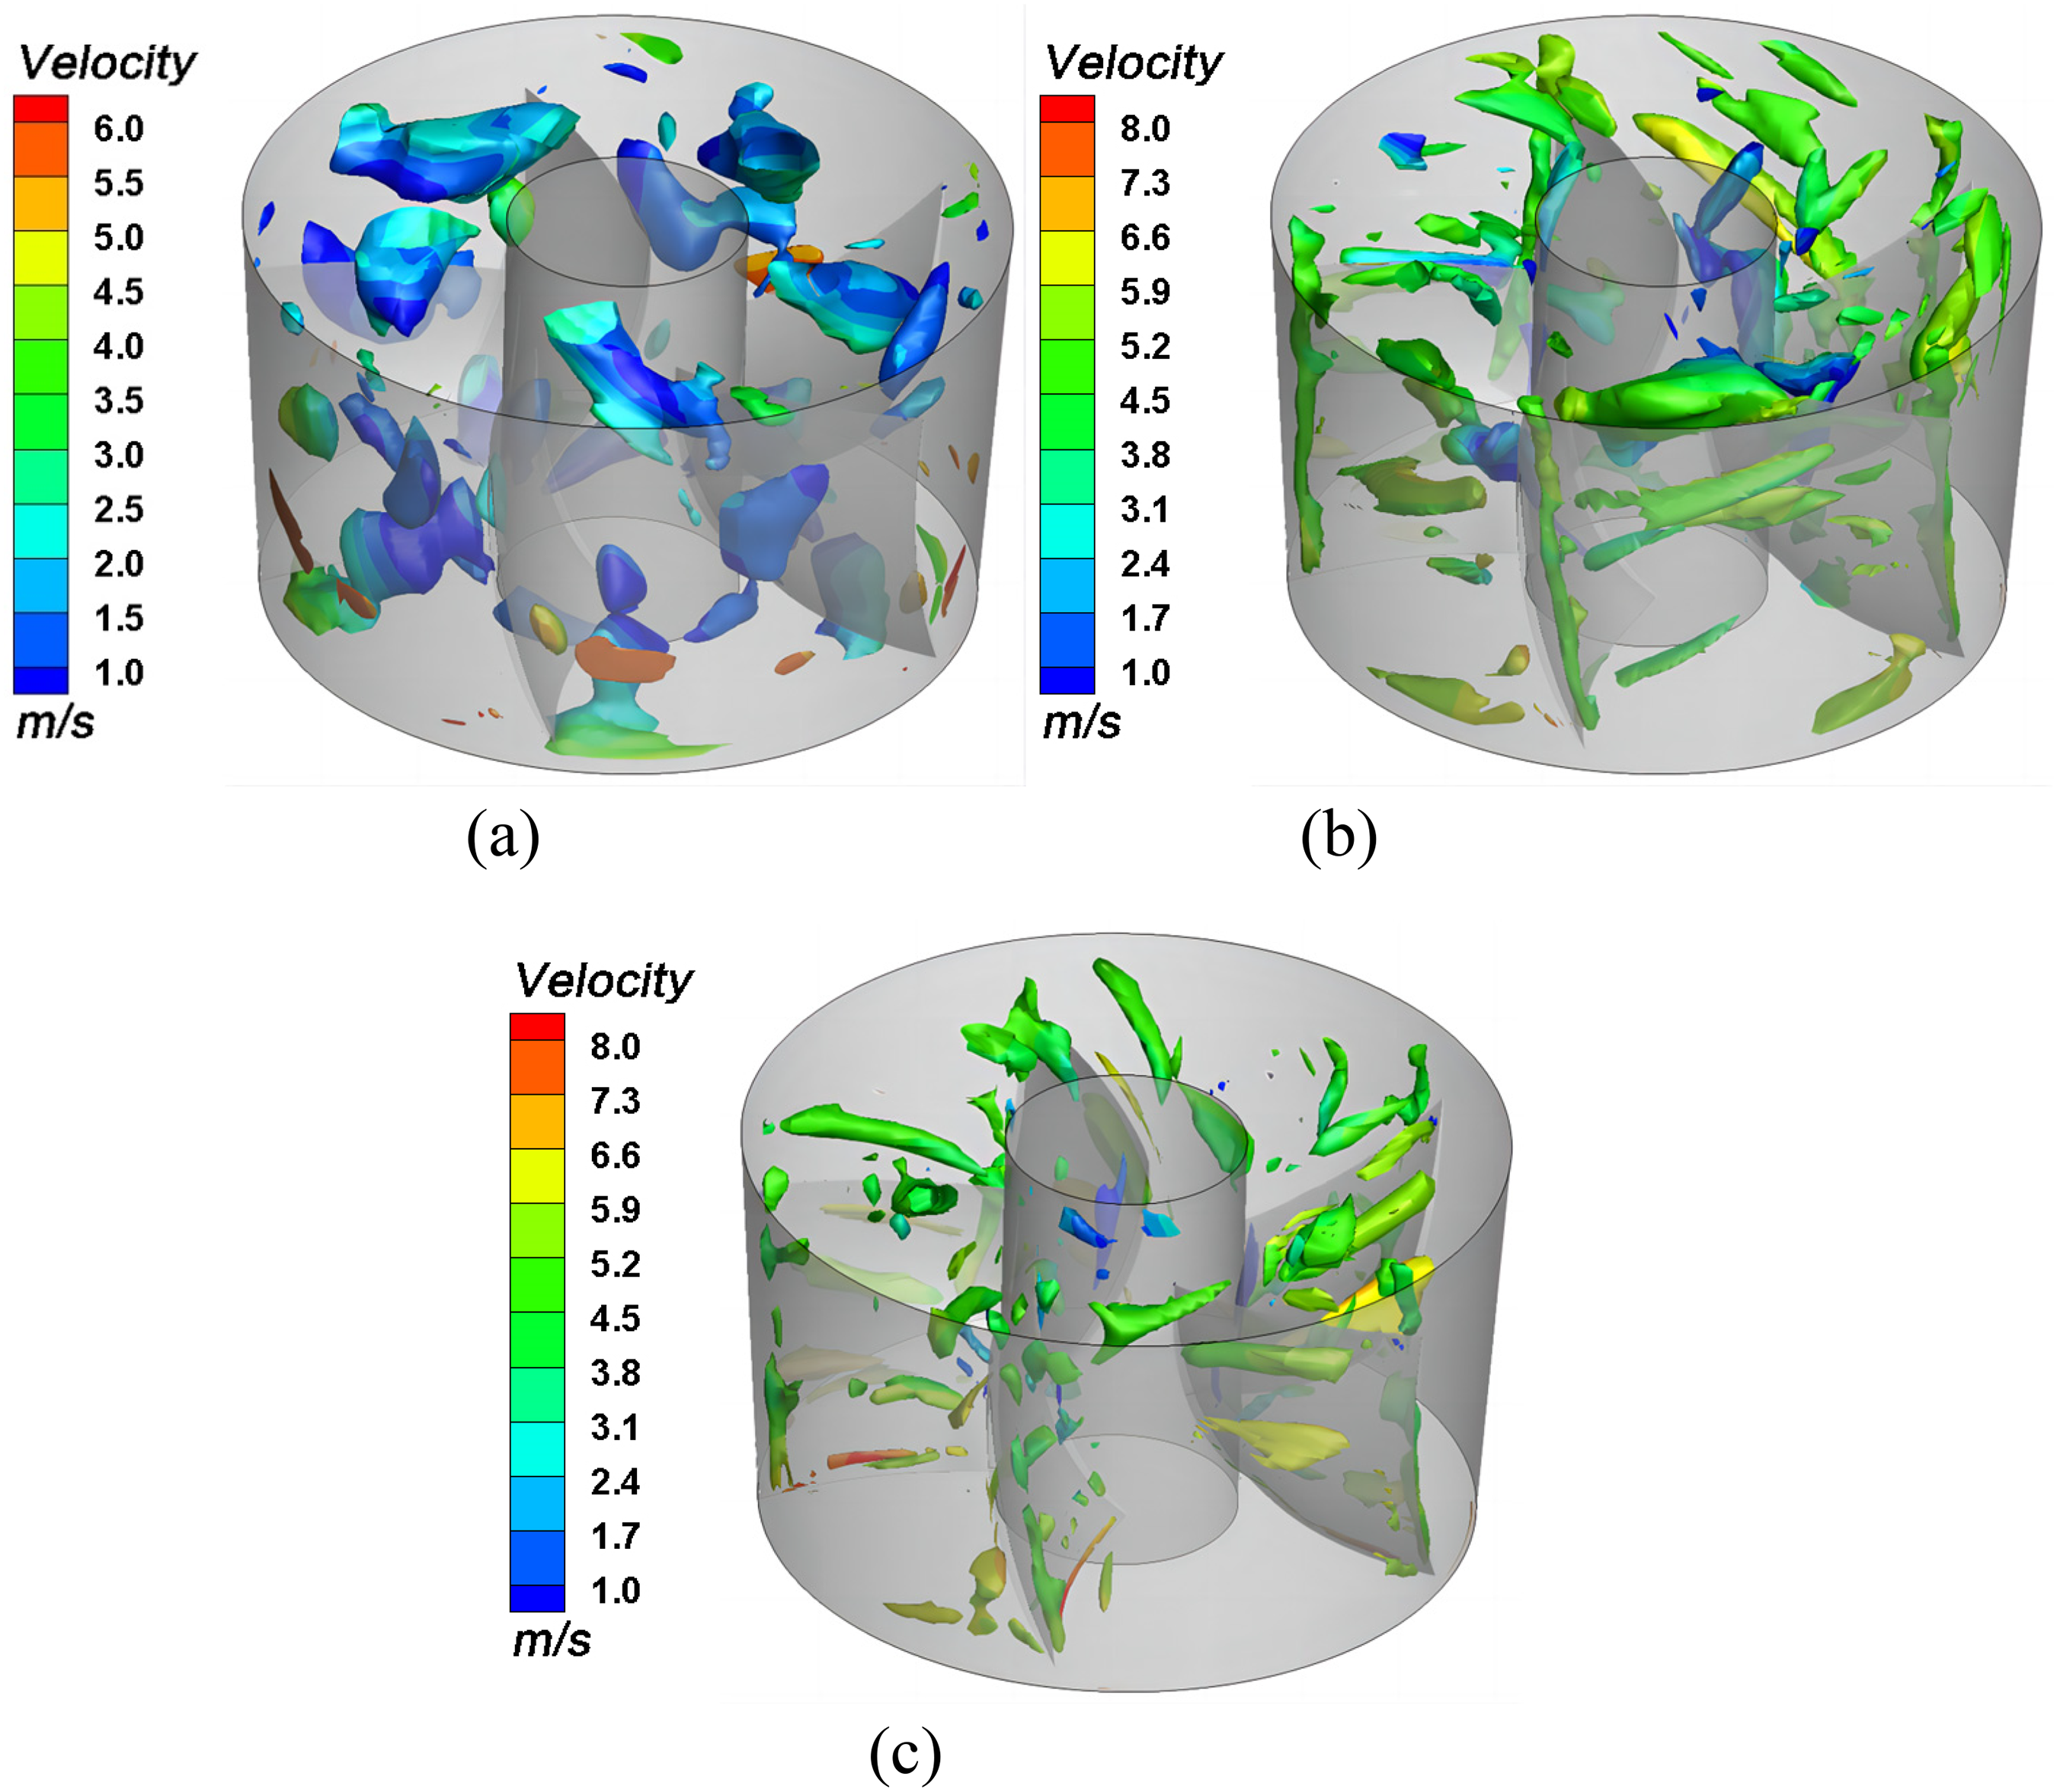
Internal vortex structures of the guide vane (ω=0.52). (a) 0.3Qbep (b) 1.0Qbep. (c) 1.2Qbep.
Arrangement of guide vane pulsation monitoring points
In order to investigate the variation law of PPS in the guide vane of the VAFPD, the PPS monitoring points (IHP01, IMP02, ISP03) were set up at the guide vane inlet (0.183D from the impeller centerline). The PPS at monitoring points (OHP04, OMP05, OSP06) are positioned near the guide vane outlet (0.767D from the impeller centerline), as shown in Figure 9(a). To further substantiate the accuracy of the VAFPD's numerical calculation results, two monitoring points P07 and P08 are arranged at the center of the siphon outlet passage to verify the accuracy of the numerical simulation of PPS (Figure 9(b)).
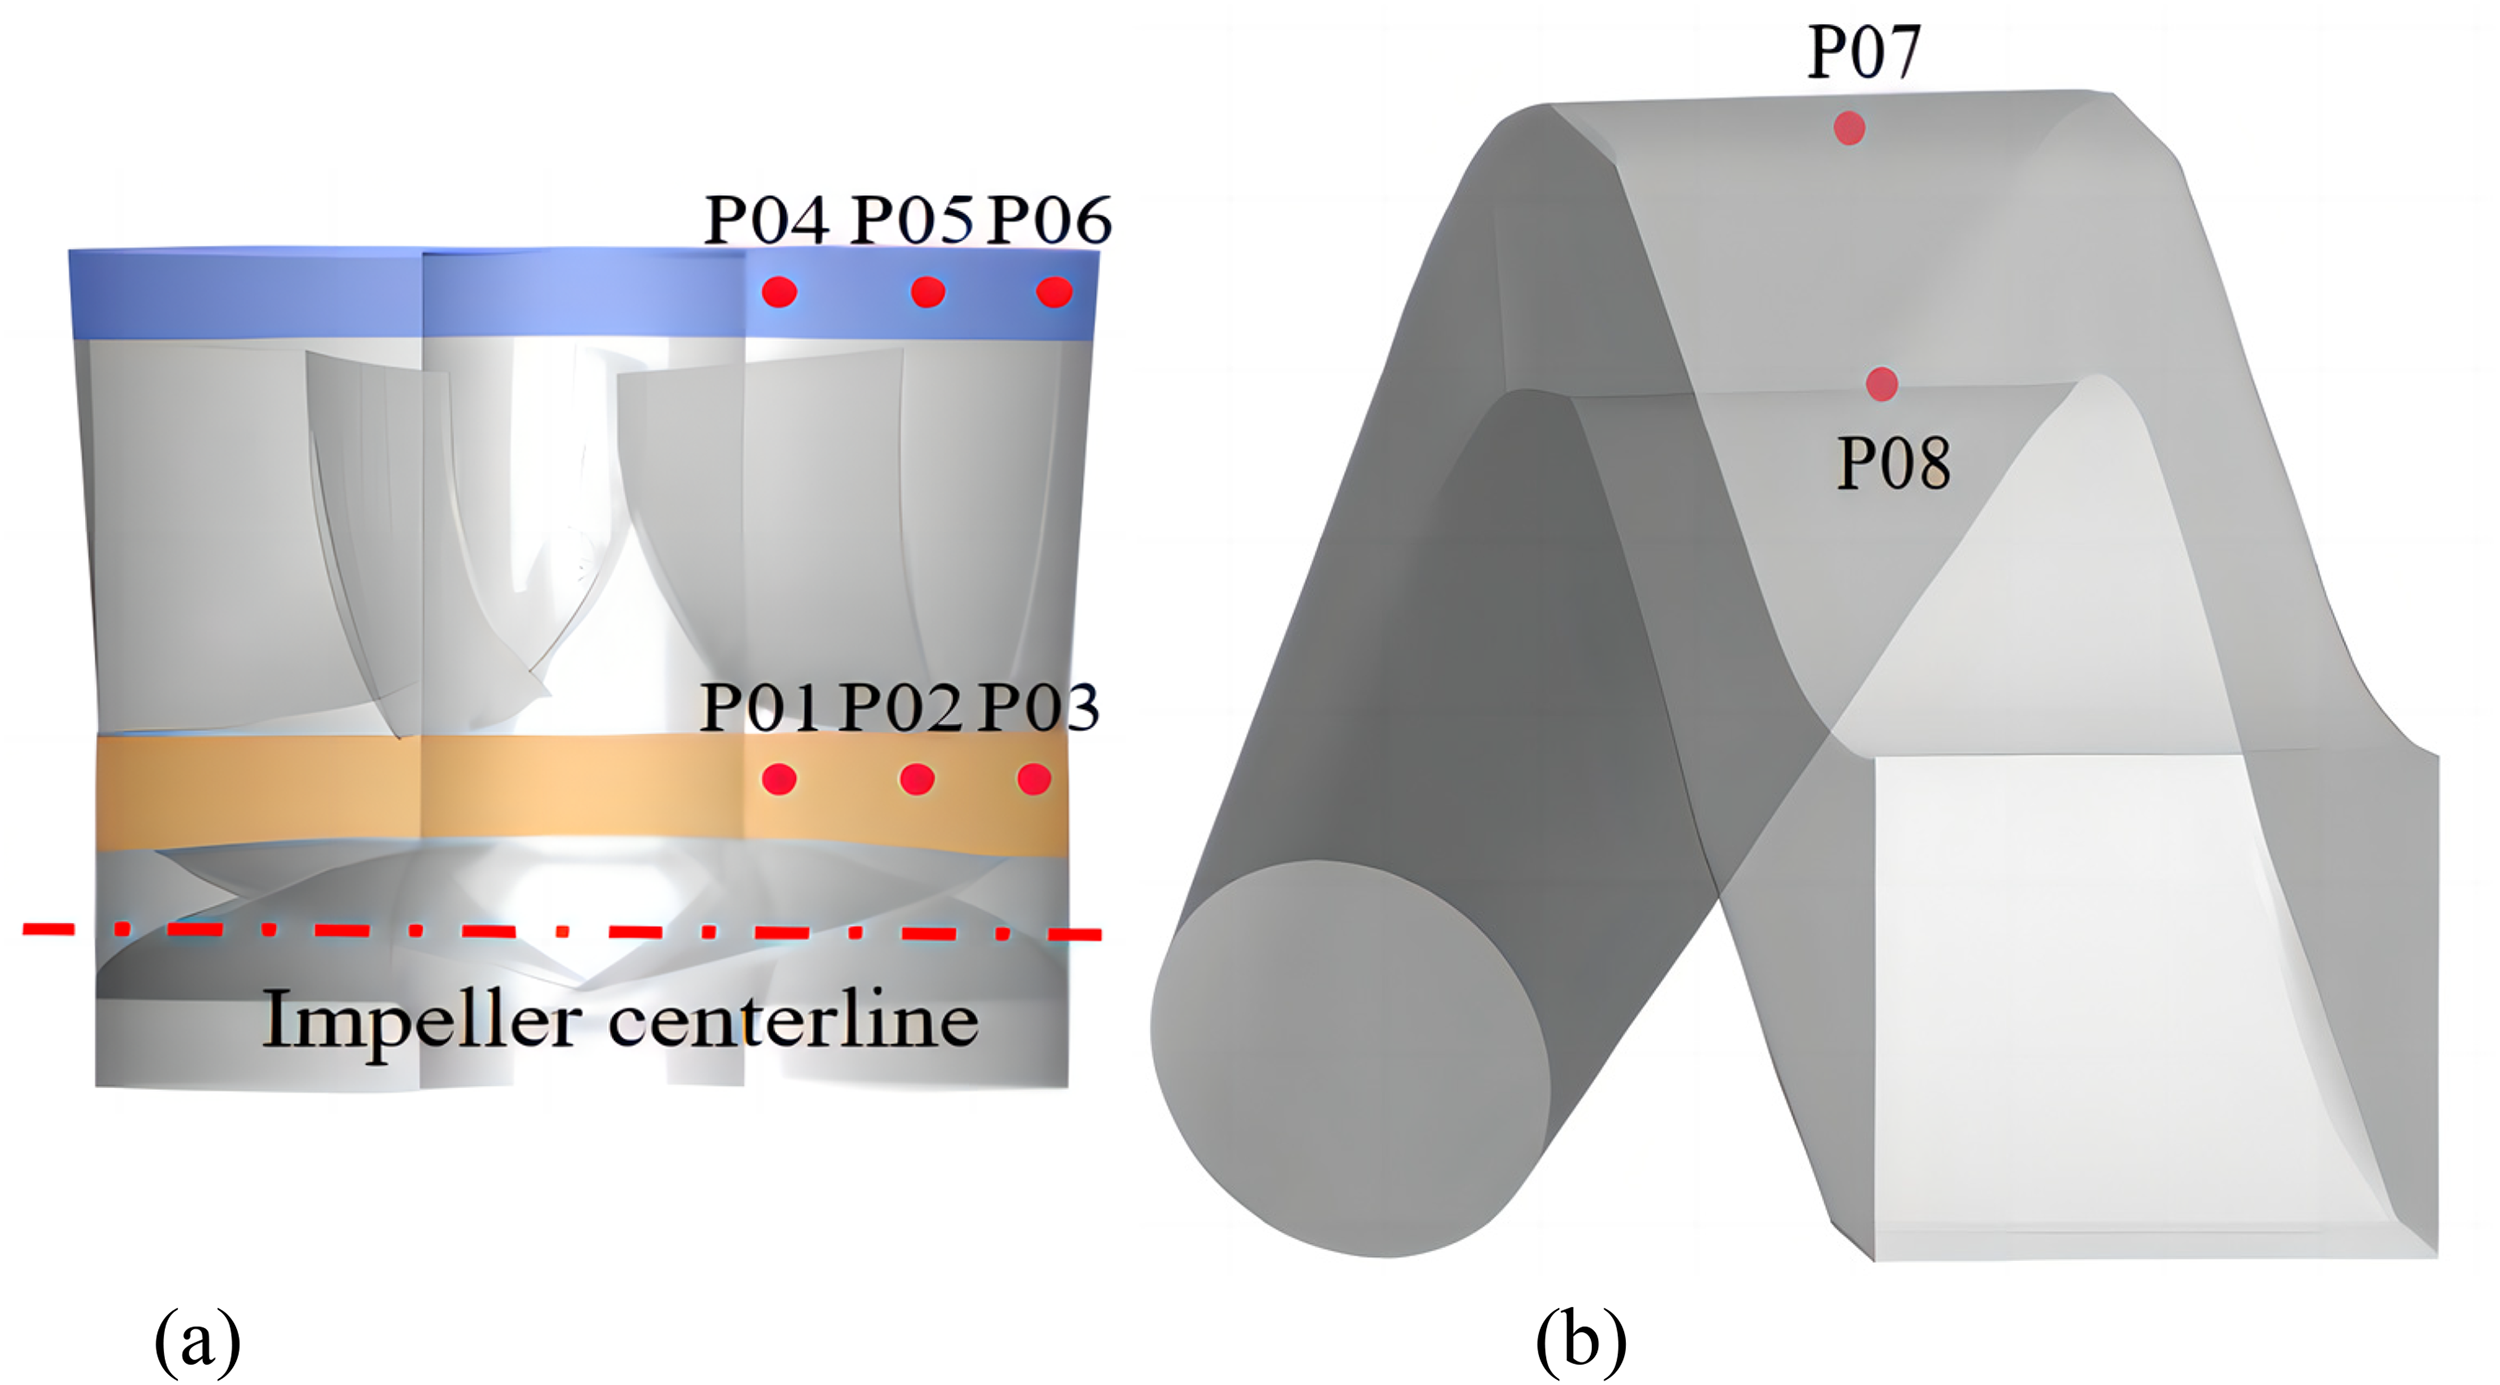
Arrangement of pulsation monitoring points. (a) Guide vane (b) Siphon outlet conduit.
Verification of numerical simulation results
The pressure pulsation test adopts CY302 high-precision digital pressure sensor. Through the use of a 485-20 digital sensor hub and data acquisition software, the two pressure sensors’ synchronous data acquisition is made possible, as shown in Figure 10. The parameters of CY302 high-precision digital sensor are shown in Table 4. Because the material of the impeller and guide vane is metal, and it is made by numerical control machining, to install sensors easily while maintaining water tightness, two pressure sensors (P07, P08) are positioned at the hump section's top and bottom of the siphon outlet conduit constructed of acrylic material. The arrangement position of the pressure sensor and the number of each monitoring point are shown in Figure 11.
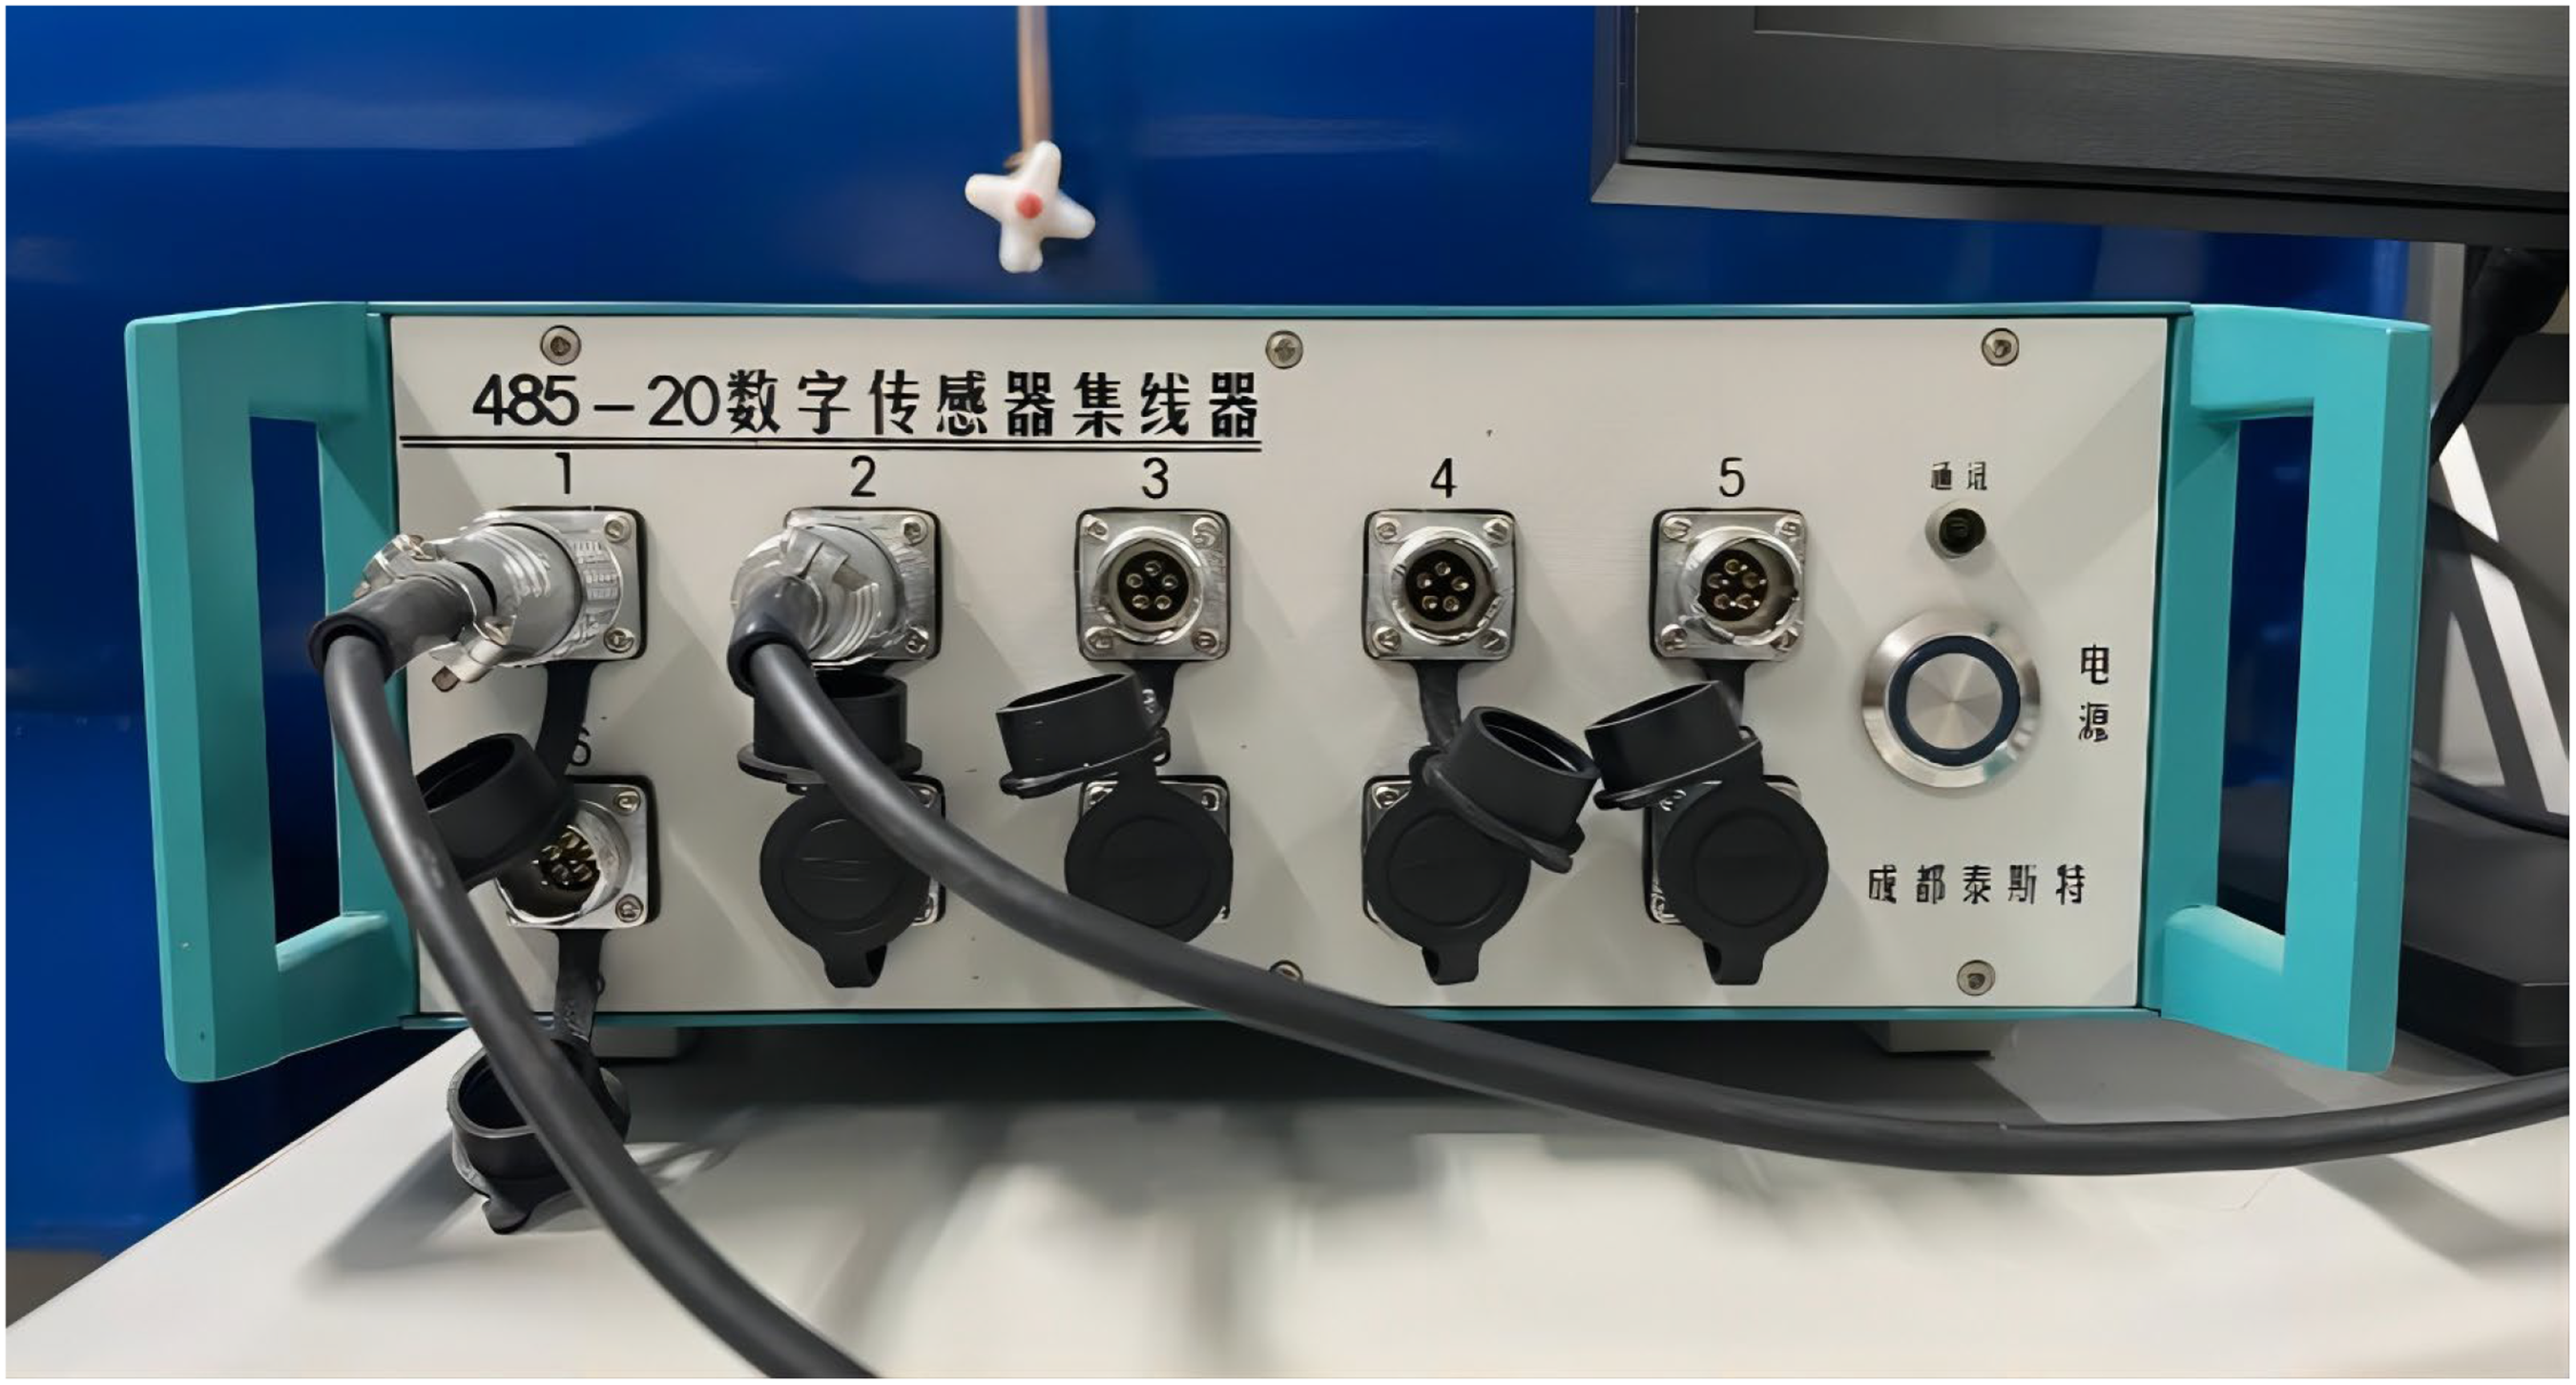
485-20 digital sensor hub.

Hump section pressure sensor setting diagram.
Basic parameters of CY302 high-precision digital pressure sensor.

When analyzing the PPS at monitoring points inside the pump device, the pressure pulsation coefficient Cp is used to feature the PPS.
43
The Cp is defined as:
In order to increase the reliability of the calculation results, as rotation time increases, the calculation stabilizes, so the PPS data of the last five rotation cycles of the numerical simulation are taken to analyze the pump device. Taking the data of 5 cycles of P07 and P08 at the hump section's top and bottom under the working condition of 1.0Qbep, the PPS physical model test results and the unsteady PPS numerical calculation results are fast Fourier transformed, and the PPS frequency domain diagram is drawn and compared. The results are shown in Figure 12.

Pressure pulsation comparison of EXP and CFD. (a) P07 (b) P08.
As shown in Figure 11, the main frequency of PPS of the model test and numerical simulation at P07 and P08 is at 14.6 Hz, and the error is small in the low-frequency band. The Cp of the test is higher than that of the numerical simulation results. The main frequency of the unsteady pulsation prediction results of the siphon outlet conduit is consistent with the test results. The numerical calculation results of the unsteady flow field of the pump device are credible and can be used for further HHT analysis.
Analysis of pressure pulsation features
Analysis of PPS at the guide vane inlet
Figure 13 shows the EMD decomposition results of the PPS at monitoring points near the guide vane inlet (IHP01, IMP02, ISP03) under 0.3Qbep working condition. Table 5 shows the average frequency and energy ratio of each IMF. At the guide vane inlet, the impeller rotation has a considerable impact on the water flow, and there are 4 peaks and 4 valleys in each rotation cycle. Under the small flow working condition (0.3Qbep), the PPS at IHP01 at the hub side and ISP03 at the shroud side can be decomposed into PPS nearly 8 times that of the rotational frequency (293.33 Hz), and the main energy distribution of the PPS at the three monitoring points is near 4 times of the rotational frequency (146.67 Hz). The average frequencies of the five IMFs at IHP01 are, respectively, at 8, 4, 1, 0.5, and 0.15 times of the rotational frequency, and they all have some energy proportions, accounting for 28.041%, 34.202%, 15.693%, 7.116%, and 13.865%, respectively. The average frequencies of the four IMFs at IMP02 are respectively located at 8, 4, 0.8, and 0.3 times of the rotational frequency, of which 4 times of the rotational frequency corresponds to 95.9% of the IMF energy, which occupies an absolute dominant position, while the other components account for less than 2%. The average frequencies of the five IMFs at ISP03 are, respectively, at 8, 4, 1, 0.5 and 0.3 times of the rotational frequency. The proportion of high-frequency pulsation energy is 55.2%, the proportion of energy at 4 times of the rotational frequency is 43.0%, and the proportion of energy of other components is less than 1%.
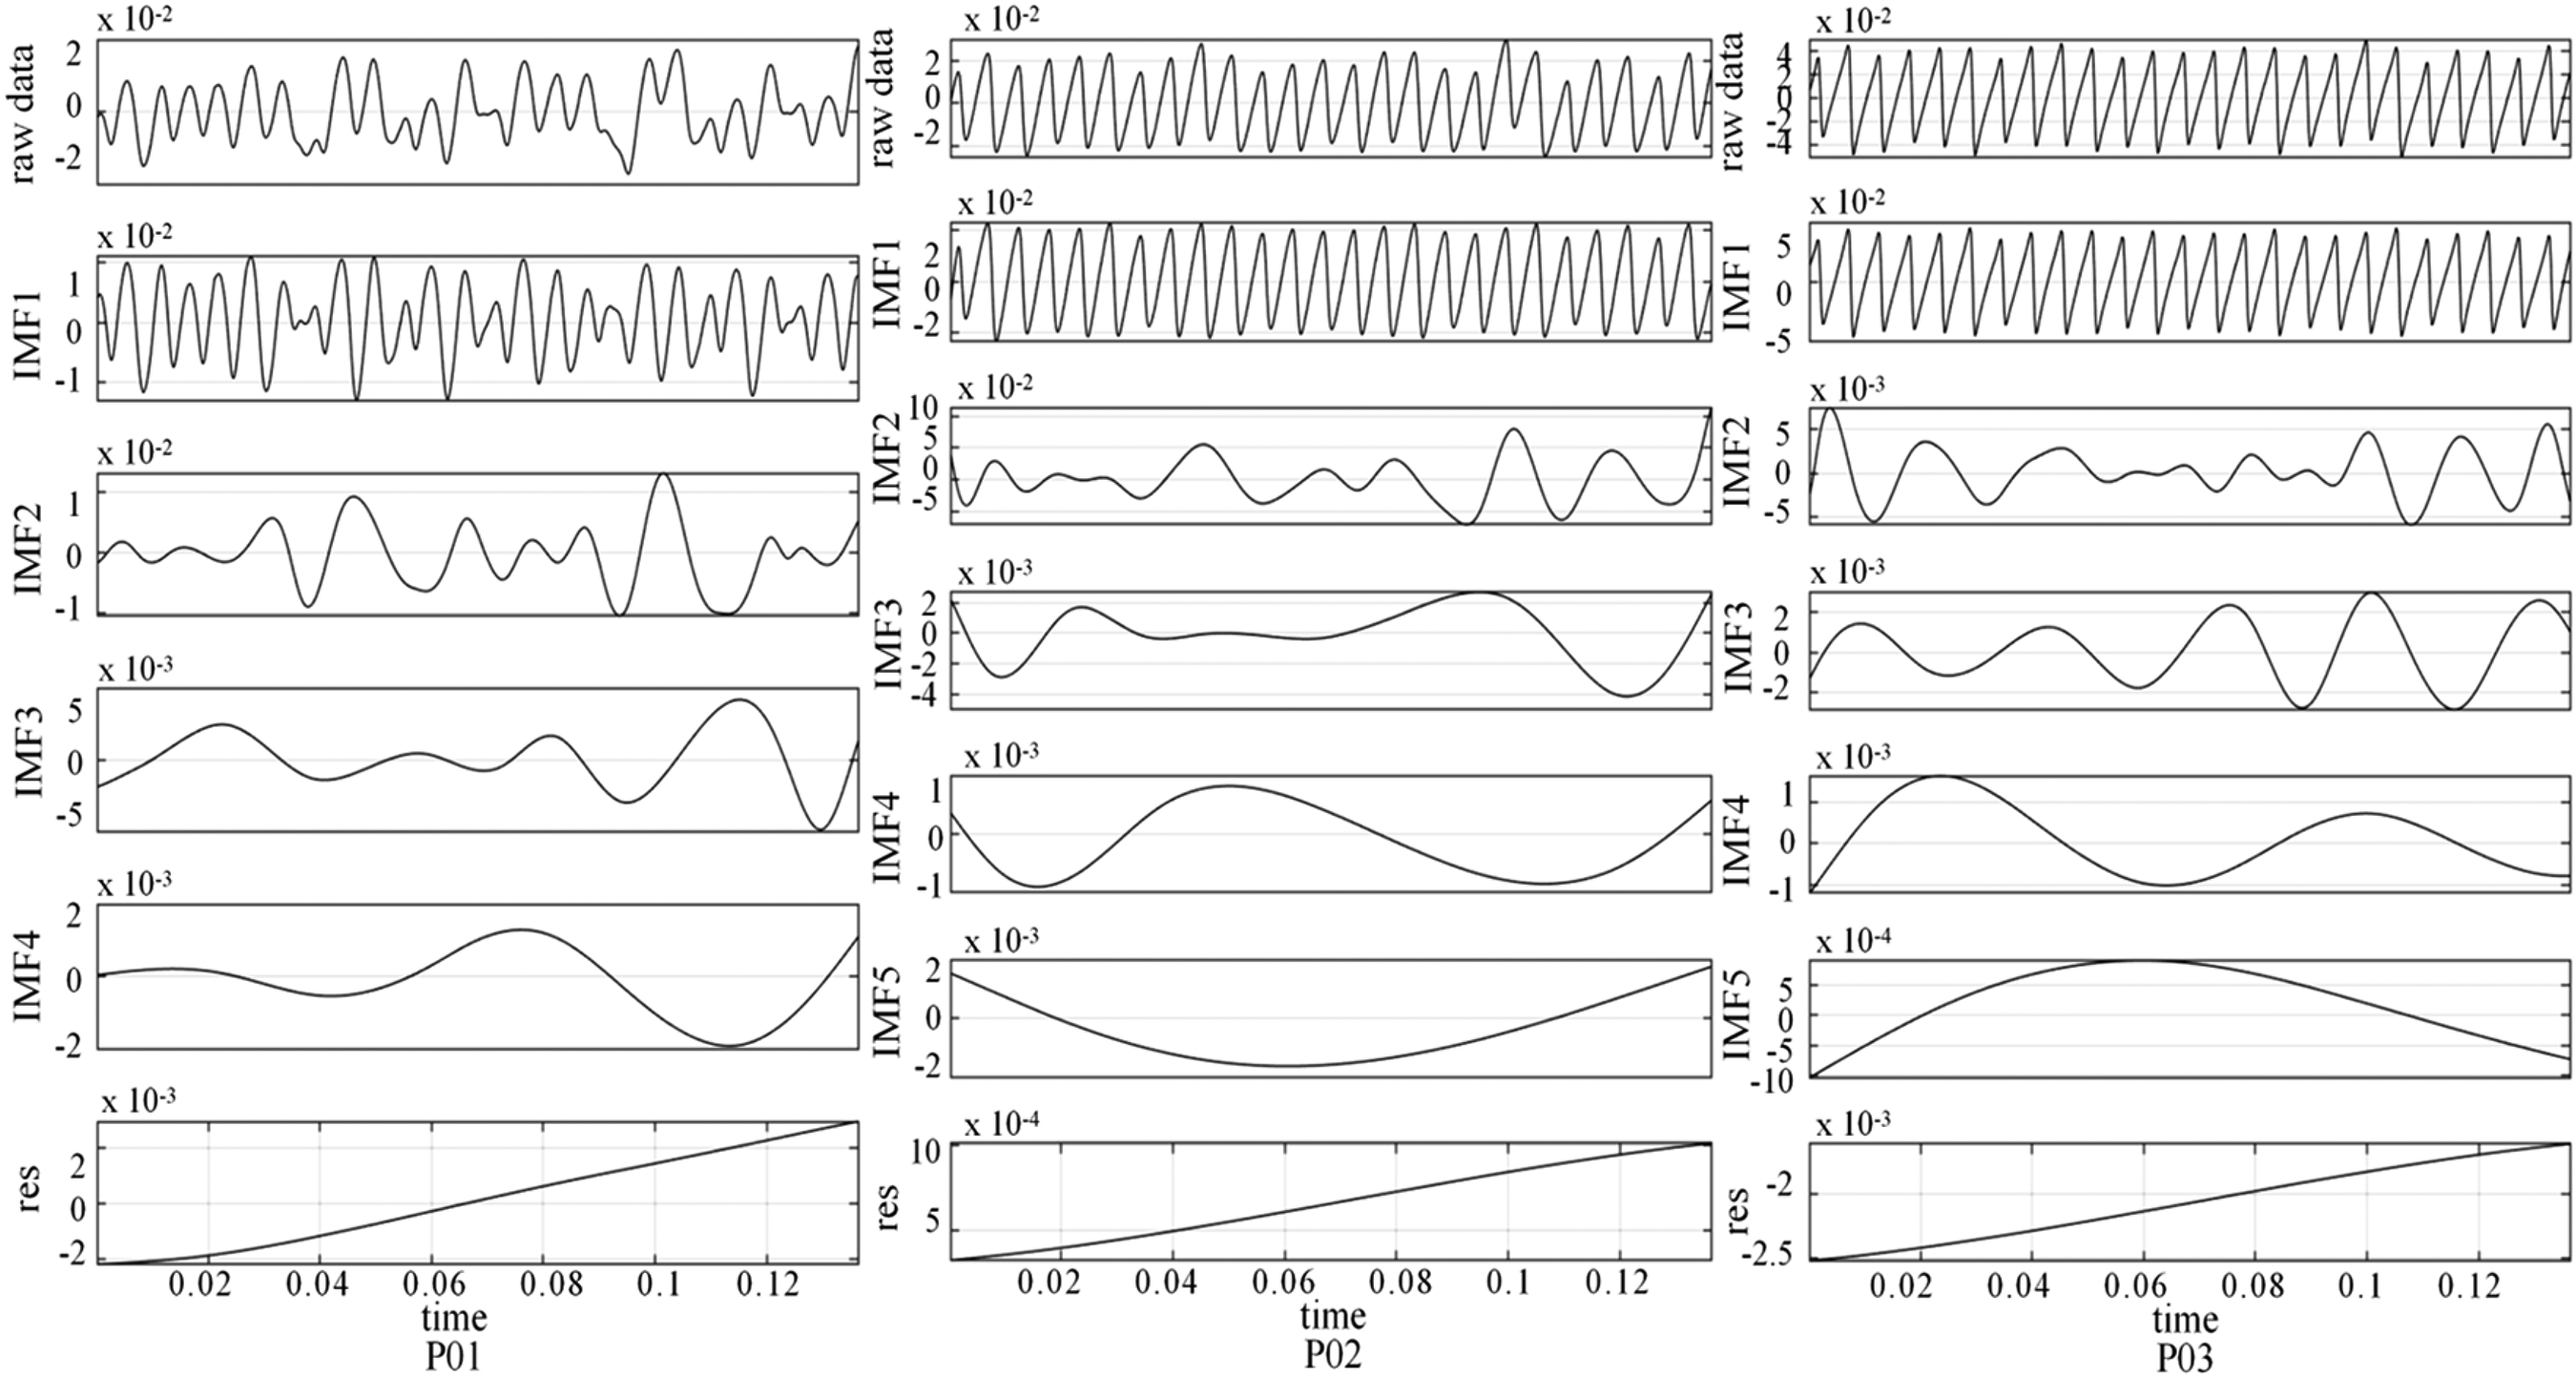
EMD decomposition of PPS at the guide vane inlet (0.3Qbep). EMD: empirical mode decomposition; PPS: pressure pulsation signal.
Average frequency distribution and energy ratio of each intrinsic mode function (IMF) (0.3Qbep).
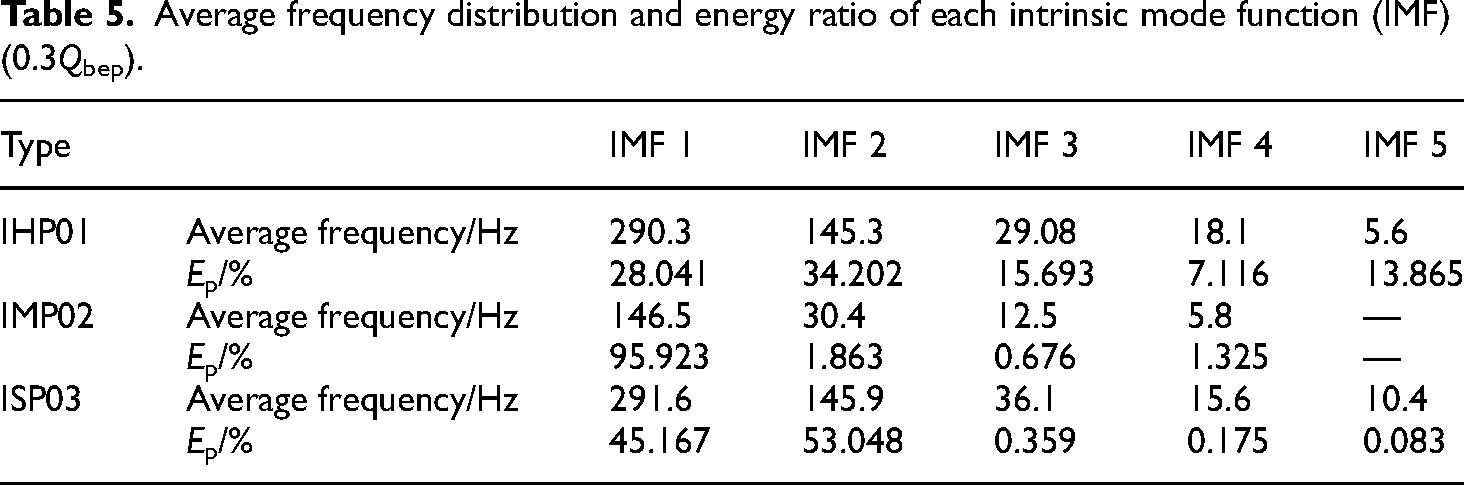
Figure 14 shows the EMD decomposition results of the PPS at monitoring points near the guide vane inlet (IHP01, IMP02, ISP03) under 1.0Qbep working condition. Table 6 shows the average frequency and energy ratio of each IMF. At the guide vane inlet, the impeller rotation has a considerable impact on the water flow, and there are 4 peaks and 4 valleys in each rotation cycle. Under the 1.0Qbep working condition, the average frequencies of the four IMF's at IHP01 are respectively at 4, 1.4, 0.7 and 0.3 times of the rotational frequency, of which 4 times of the rotational frequency corresponds to 52.1% of the IMF's energy, 1.4 times of the rotational frequency corresponds to 37.4% of the IMF's energy, and the energy ratios of other components are below 5%. The average frequencies of the five IMF at IMP02 are respectively located near 4, 1.3, 0.5, 0.3, and 0.15 times of the rotational frequency, of which 4 times of the rotational frequency corresponds to 92.3% of the IMF energy, accounting for dominant position, 1.3 times of the rotational frequency corresponds to 5.2% of the IMF energy, and the remaining components account for less than 2%. The average frequencies of the five IMFs at ISP03 are respectively at 4, 1.6, 0.8, 0.3, and 0.15 times the rotational frequency, of which 4 times of the rotational frequency corresponds to 97.7% of the IMF energy, accounting for a dominant position, while the energy of the other components is less than 2%.

EMD decomposition of PPS at the guide vane inlet (1.0Qbep). EMD: empirical mode decomposition; PPS: pressure pulsation signal.
Average frequency distribution and energy ratio of each intrinsic mode function (IMF) (1.0Qbep).

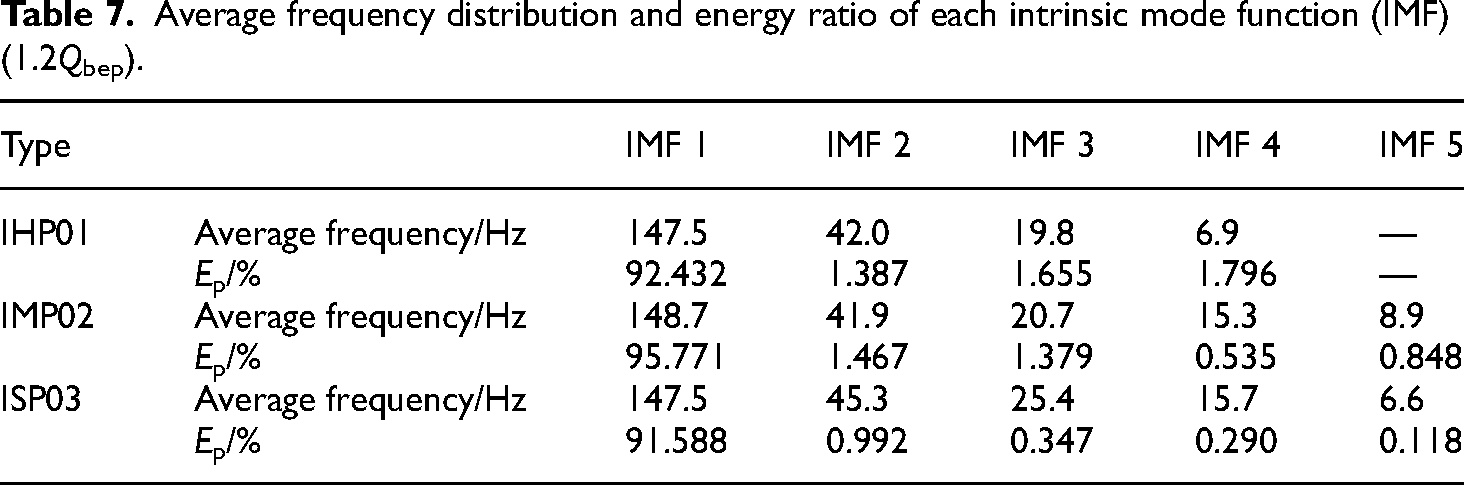
Figure 15 shows the EMD decomposition results of the PPS at monitoring points near the guide vane inlet (IHP01, IMP02, ISP03) under 1.2Qbep working conditions. Table 7 shows the average frequency and energy ratio of each IMF. At the guide vane inlet, the impeller rotation has a considerable impact on the water flow, and there are 4 peaks and 4 valleys in each rotation cycle. Under the large flow working condition (1.2Qbep), the average frequencies of the four IMFs at IHP01 are, respectively, at 4, 1.0, 0.5 and 0.2 times of the rotational frequency, of which 4 times of the rotational frequency corresponds to 92.4% of the IMF energy, which is the main frequency of PPS, and the energy proportions of the other components are below 2%. The average frequencies of the five IMFs at IMP02 are, respectively, around 4, 1.0, 0.5, 0.4 and 0.2 times of the rotational frequency, of which the corresponding IMF energy ratio of 4 times of the rotational frequency is 95.8%, and the energy ratio of the other components is relatively small, which is less than 2%. The average frequencies of the five IMFs at ISP03 are respectively at 4, 1.2, 0.7, 0.5, and 0.2 times of the rotational frequency, of which 4 times of the rotational frequency corresponds to 91.6% of the IMF energy, which is the main frequency of PPS, and the energy ratio of the other components is less than 1%.
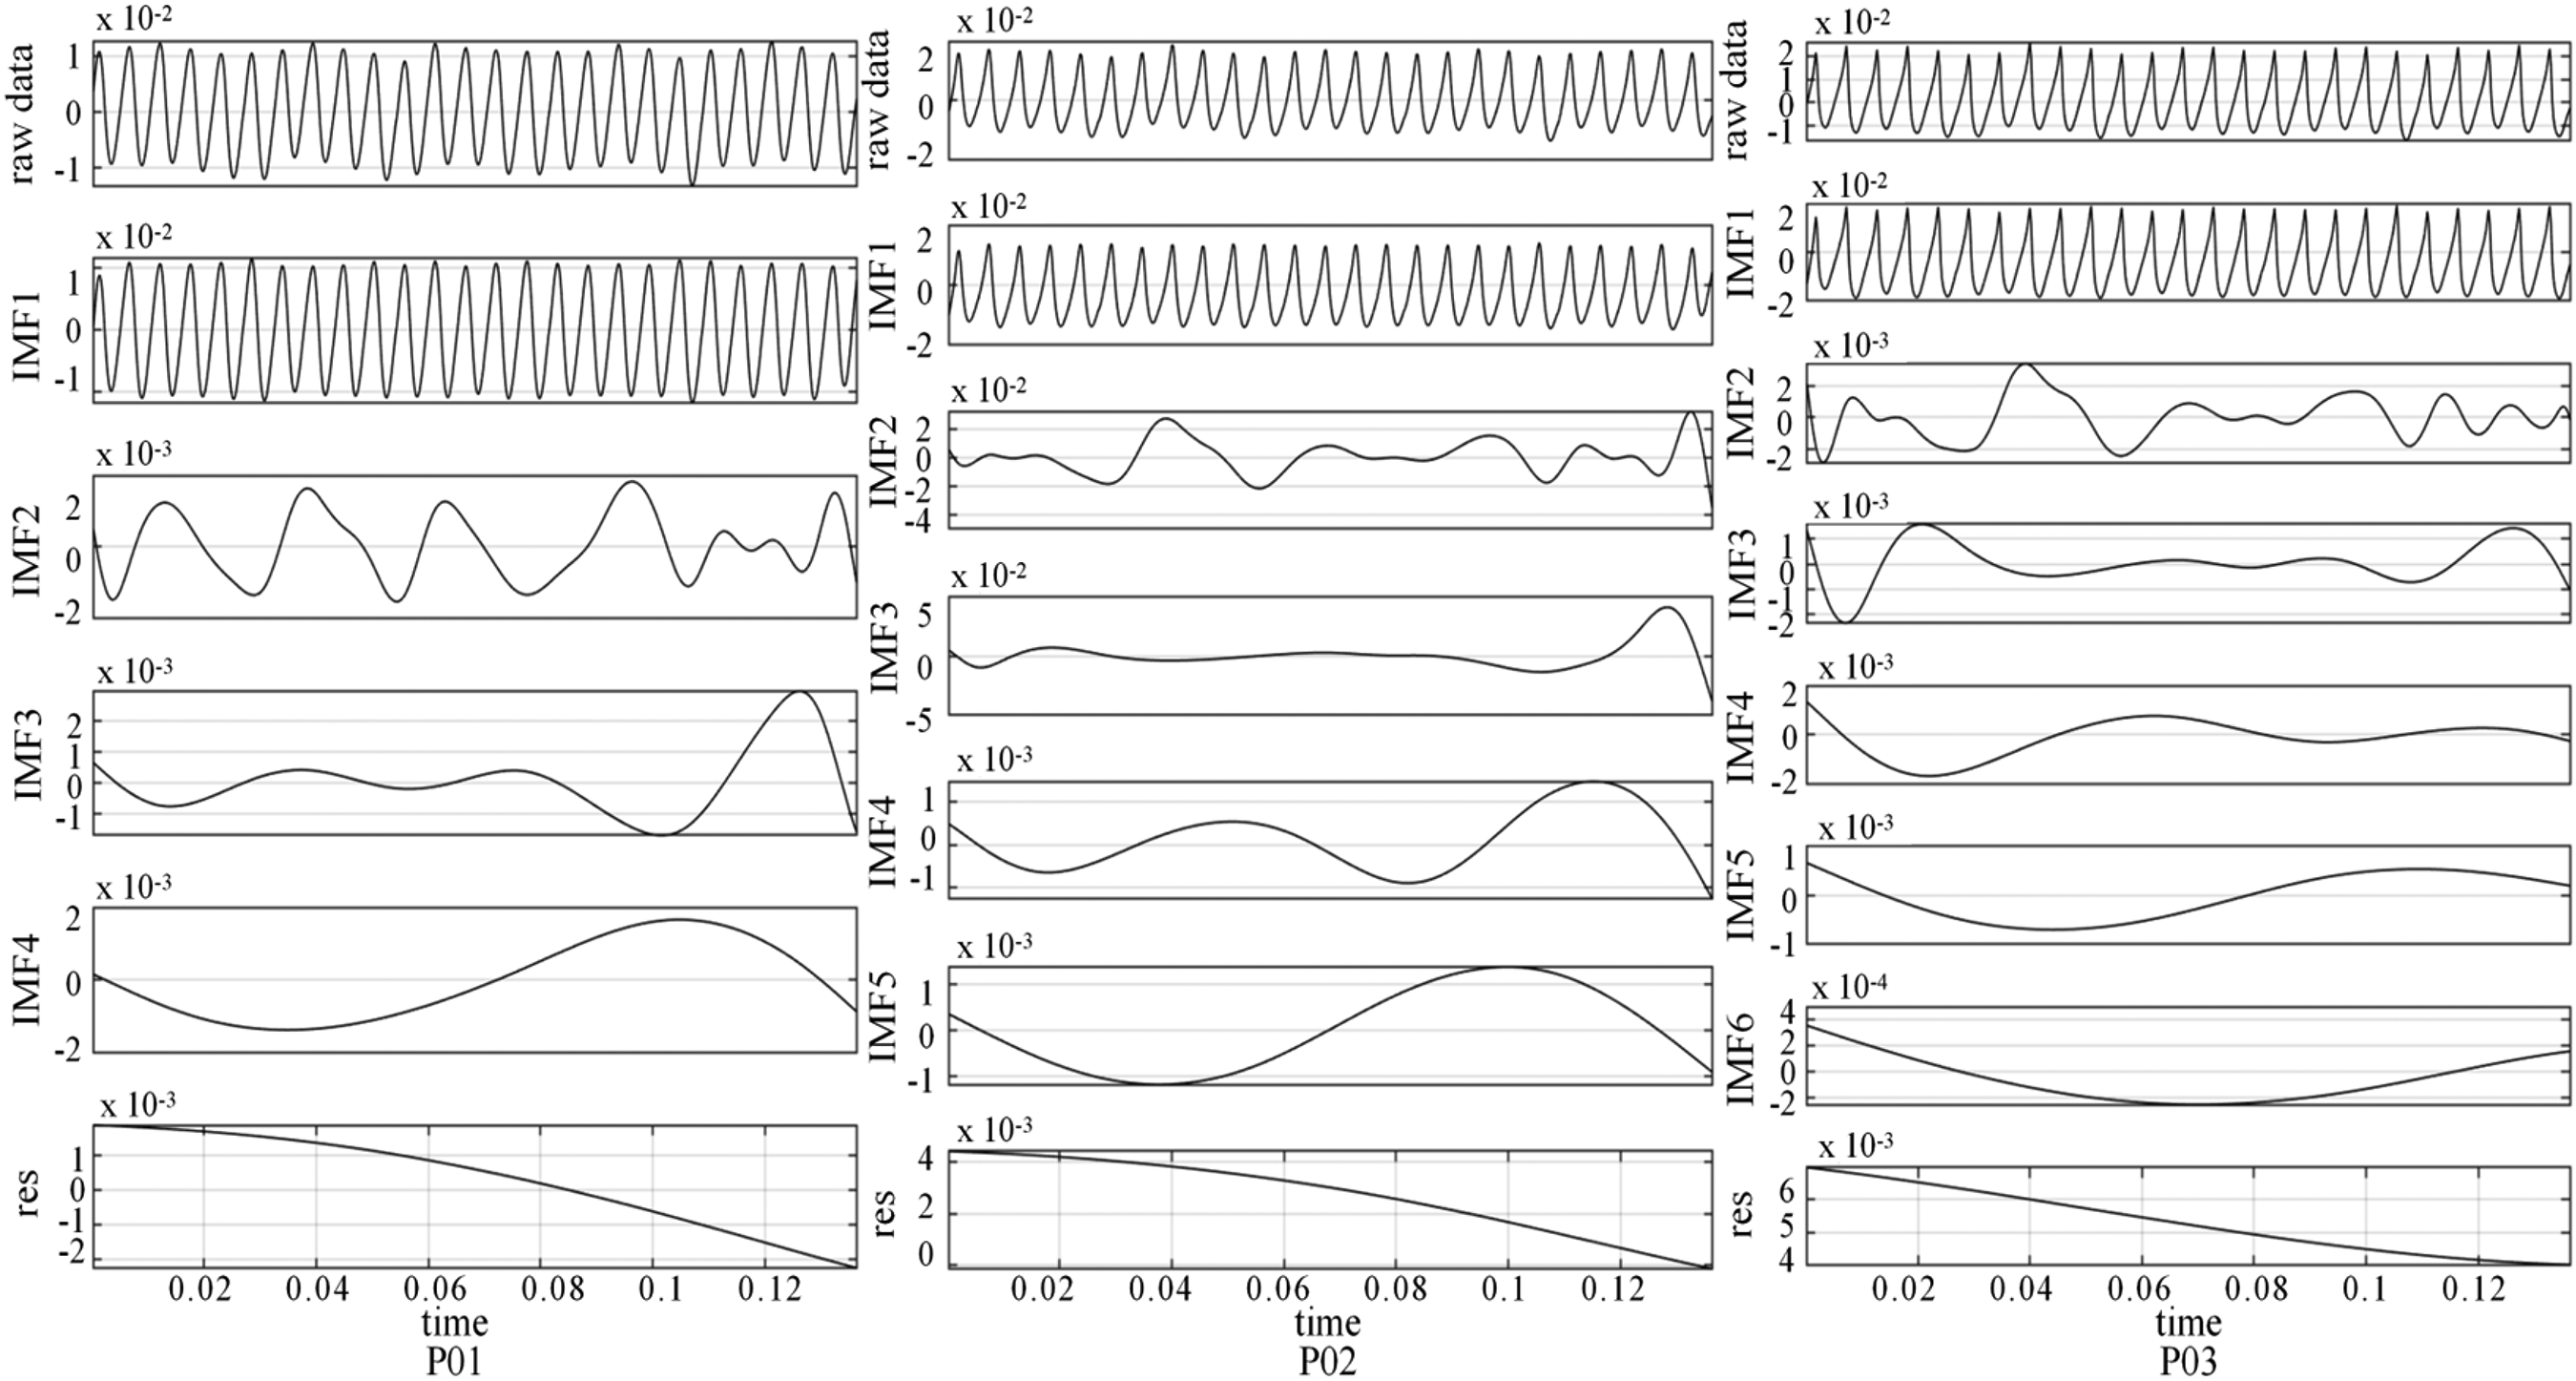
EMD decomposition of PPS at the guide vane inlet (1.2Qbep). EMD: empirical mode decomposition; PPS: pressure pulsation signal.
Average frequency distribution and energy ratio of each intrinsic mode function (IMF) (1.2Qbep).
The pressure pulsation Hilbert spectrum and marginal spectrum (Figure 16) were analyzed by selecting IMP02 in the center of the flow area at the guide vane inlet. Under the flow rate of 0.3∼1.2Qbep, the energy of the PPS at IMP02 is mostly focused in the high-frequency band of 100–300 Hz, and it is periodically fluctuating, corresponding to 4 times frequency. From the spectrum distribution, there are low-frequency signals below 50 Hz in all three conditions. In terms of dominant frequency, the pulsation frequency band under small flow working conditions (0.3Qbep) is more concentrated, and is concentrated in the 100–200 Hz frequency band. The spectrum distribution law does not significantly alter between the optimal condition (1.0Qbep) and the high flow working condition (1.2Qbep), which is less affected by flow changes. In terms of pulsation amplitude, in response to an increase in flow, the peak value of Cp at the main frequency (146 Hz) shows a downward trend, and the small flow working condition is 1.1 and 1.5 times of the optimal flow and large flow working condition respectively.

Hilbert spectrum and marginal spectrum of pressure pulsation signal (PPS) (P02). (a) 0.3Qbep. (b) 1.0Qbep. (c) 1.2Qbep.
Based on the above analysis, the average frequency of the IMF component with the highest energy proportion at the inlet of the guide vane under different flow conditions is around 146 Hz (4 times the rotational frequency), which is mainly affected by the rotation of the impeller. However, the average frequency of the IMF component with the highest proportion of flow at 0.3Qbep is slightly lower, while the average frequency is slightly higher at 1.0Qbep and 1.2Qbep. This is because there are low-frequency signals below 100 Hz and high-frequency signals fluctuating around 4 times the rotational frequency in all three flow conditions. However, as the flow rate increases, the influence of impeller rotation on the water flow increases, and the fluctuation amplitude of high-frequency signals increases, resulting in an increase in the average frequency.
Analysis of PPS at the guide vane outlet
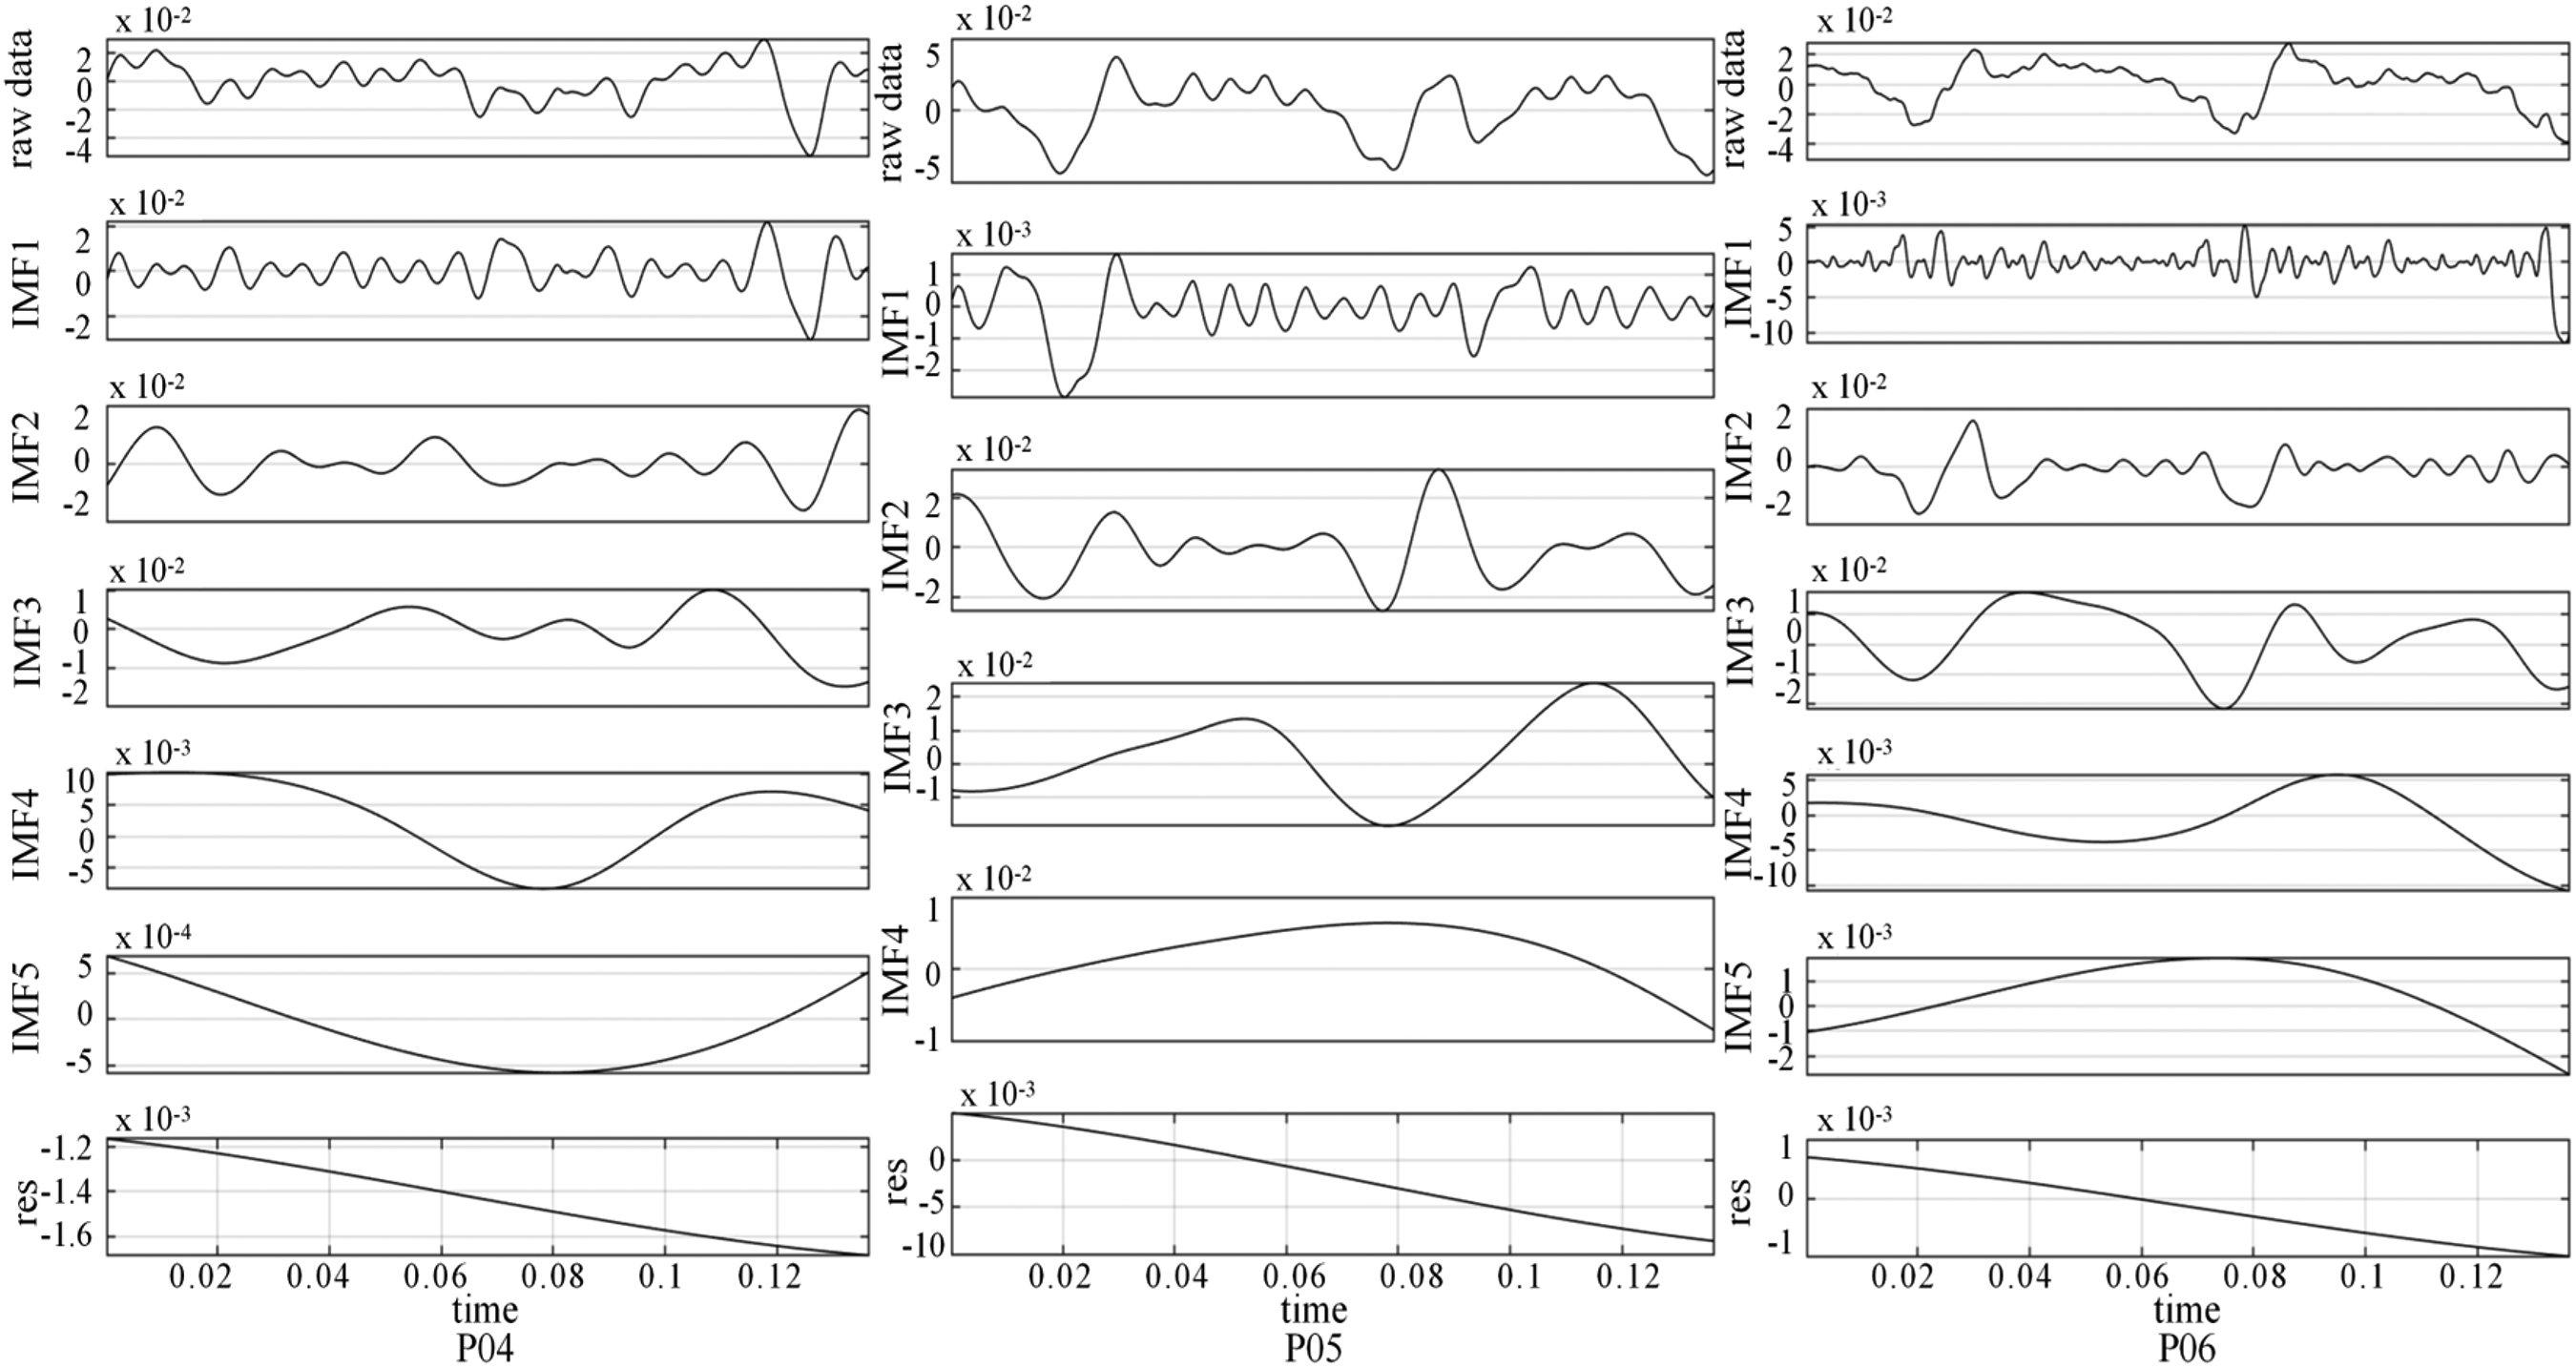
Figure 17 shows the EMD decomposition results of PPS at monitoring points near the guide vane outlet (OHP04, OMP05, OSP06) under 0.3Qbep working condition. Table 8 shows the average frequency and energy ratio of each IMF. The PPS at each monitoring point at the guide vane outlet has a greater change than that at the guide vane inlet, and does not show obvious periodicity. Compared with the guide vane inlet, although IMF 1 corresponding to 4 times the blade frequency can still be decomposed, the energy proportion is less than 30%, which is no longer the dominant frequency of the PPS, and the pressure pulsation frequency is shifted as low frequency. The average frequencies of the remaining four IMFs at OHP04 on the hub side are 44.1, 22.0, 14.7, and 5.4 Hz respectively, of which the corresponding energies of IMF 2 and IMF 3 distributed on both sides of the one times rotational frequency account for the largest proportion, 38.54% and 41.29% respectively. The dominant frequency of OMP05 is 42.6 Hz corresponding to IMF2, and the energy ratio reaches 70.2%, while the energy ratio of other low-frequency components is less than 1%. The average frequencies of the other three IMFs at OSP06 at the shroud side are 44.1, 26.4, and 8.5 Hz, respectively, of which IMF 2 and IMF 3 account for the largest proportion of energy, 46.48% and 9.54% respectively.

EMD decomposition of PPS at the guide vane outlet (0.3Qbep). EMD: empirical mode decomposition; PPS: pressure pulsation signal.
Average frequency distribution and energy ratio of each intrinsic mode function (IMF) (0.3Qbep).

Figure 18 shows the EMD decomposition results of the PPS at monitoring points near the guide vane outlet (OHP04, OMP05, OSP06) under 1.0Qbep working condition. Table 9 shows the average frequency and energy ratio of each IMF. The average frequencies corresponding to the five IMFs at the hub side OHP04 are 136.5, 57.2, 20.1, 6.9, and 2.6 Hz, respectively. The energy is evenly distributed from IMF1 to IMF4, and the energy proportion is more than 20%. At OMP05, there is a high-frequency component with an energy ratio of 16.5%. The energy ratios of IMF 2 (average frequency 51.4 Hz) and IMF 3 (average frequency 14.7 Hz) are 37.98% and 35.42%, respectively, and the dominant frequency falls within this range. The high-frequency energy of OSP06 at the shroud side is relatively small, and the energy ratio of the high-frequency component is only 2.8%. The average frequencies corresponding to IMF2–IMF5 components are 51.42, 36.7, 14.7, and 7.3 Hz, respectively. Among them, the energy ratio of IMF3 is the largest, 67.36%, that is, the dominant frequency falls near 36.7 Hz.
EMD decomposition of PPS at the guide vane outlet (1.0Qbep). EMD: empirical mode decomposition; PPS: pressure pulsation signal.
Average frequency distribution and energy ratio of each intrinsic mode function (IMF) (1.0Qbep).

Figure 19 shows the EMD decomposition results of PPS at monitoring points near the guide vane outlet (OHP04, OMP05, OSP06) of 1.2Qbep. Table 10 shows the average frequency and energy ratio of each IMF. At 1.2Qbep working condition, the monitoring points have good periodicity, and the high-frequency component IMF1 of PPS accounts for a relatively high proportion of energy, which is 61.04%, 80.35%, and 64.23%, respectively. The average frequency of this component is around 146 Hz (4 times the rotational frequency).
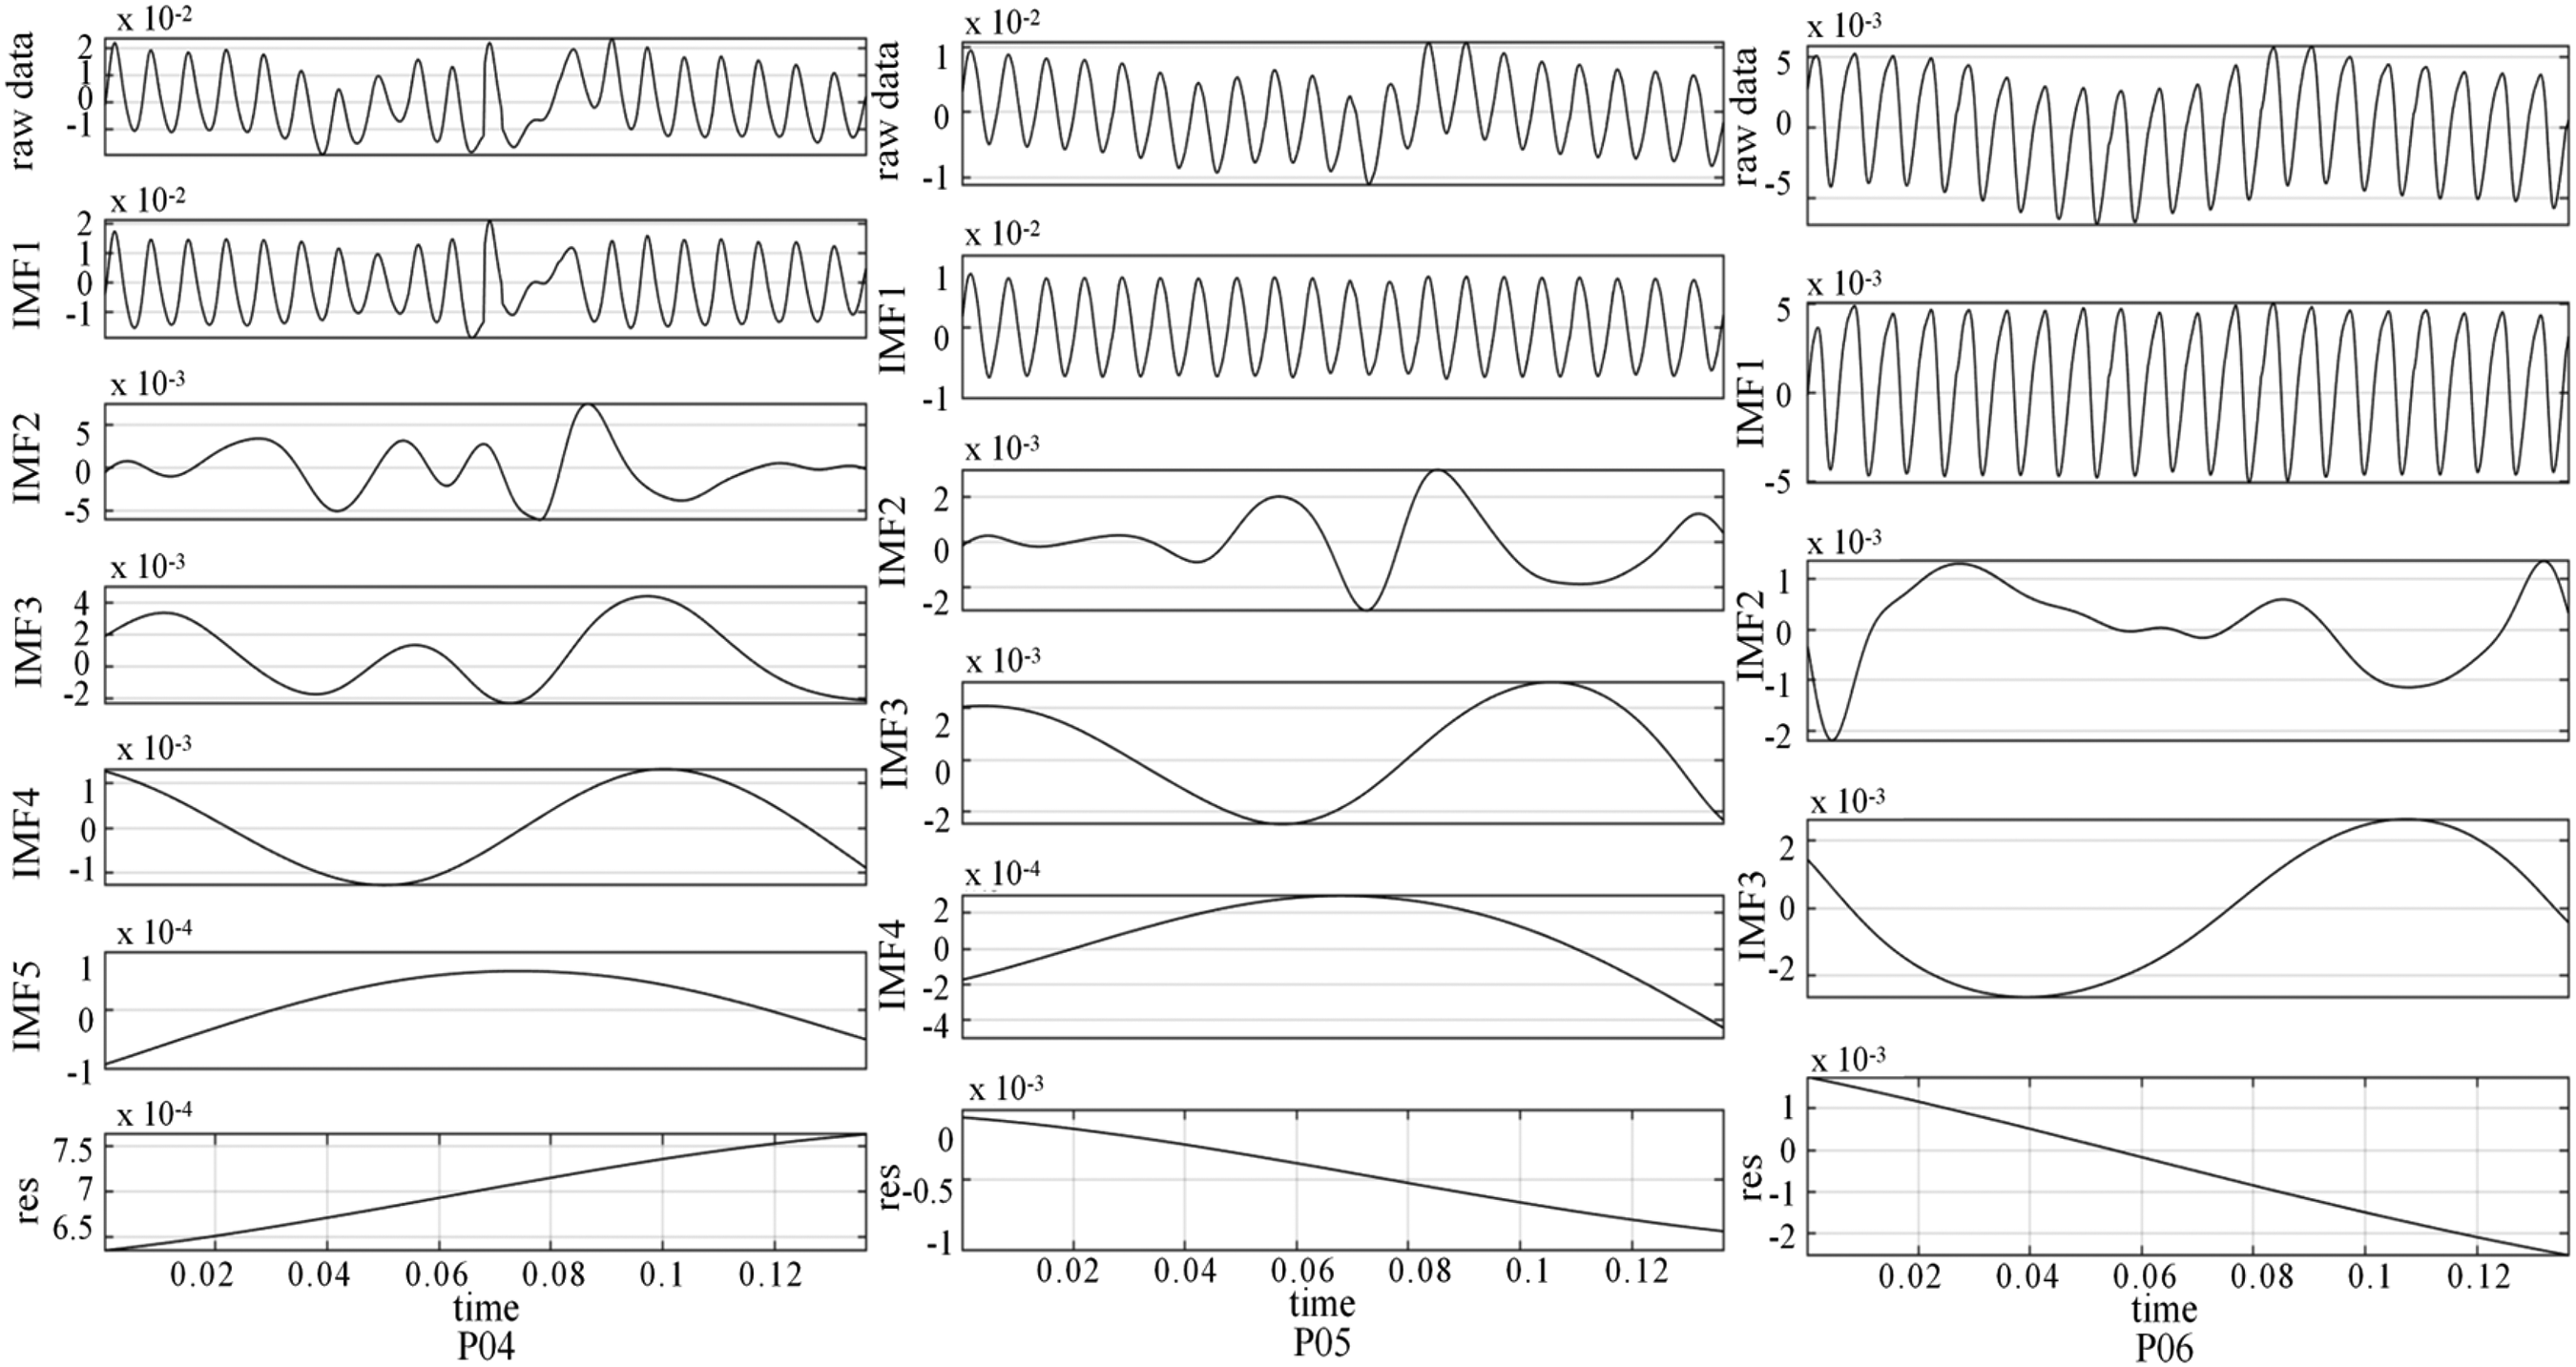
EMD decomposition of PPS at the guide vane outlet (1.2Qbep). EMD: empirical mode decomposition; PPS: pressure pulsation signal.
Average frequency distribution and energy ratio of each intrinsic mode function (IMF) (1.2Qbep).

OMP05 was selected for Hilbert spectrum and marginal spectrum analysis of pressure fluctuation (Figure 20). It can be seen from the results that under the 0.3–1.2Qbep working condition, the energy of PPS at OMP05 is mainly concentrated in the frequency band below 200 Hz, but under 1.0Qbep, the high-frequency signal is relatively unstable. In the first and fourth cycles, the frequency suddenly drops to less than 50 Hz, and the high-frequency components of the other two working conditions fluctuate periodically, corresponding to four times of frequency. Compared with IMP02, the marginal spectrum is shifted to the secondary dominant frequency. As for the amplitude of pulsation, in response to an increase in flow rate, the peak value of Cp at the main frequency increases first and then decreases. The small flow working condition is 2.1 and 1.5 times the optimal flow and large flow working condition, respectively.

Hilbert spectrum and marginal spectrum of pressure pulsation signal (PPS) (P05). (a) 0.3Qbep. (b) 1.0Qbep. (c) 1.2Qbep.
Through the above analysis, it can be found that the flow rate has a significant influence on the flow at the guide vane outlet. The average frequency of the IMF component with the highest energy proportion at 0.3Qbep and 1.0Qbep is around 43 Hz and 54 Hz, while the average frequency at 1.2Qbep rises to 145 Hz, approaching 4 times the frequency. It can be found from Hilbert spectra and marginal spectra of pressure fluctuation signals of water flow that large vortices exist due to the effect of guide vane wall diversion on water flow at 0.3Qbep, and their frequencies are distributed in the range of 0–500 Hz, mainly in areas below 400 Hz. At 1.0Qbep, the flow pattern inside the guide vane is improved, and the pressure fluctuation frequency is distributed below 250 Hz after the guide vane is diverted. At 1.2Qbep, the flow becomes dominated by impeller rotation. Although some energy is recovered in the guide vanes, their primary frequency is around 150 Hz.
Analysis of PPS in guide vane
Figure 21 shows the average frequency of IMF with the highest energy ratio in the flow PPS at the guide vane inlet and guide vane outlet under 0.3Qbep working condition and its energy ratio. Under the working condition of 0.3Qbep, the average IMF frequencies at the hub side (IHP01), shroud side (ISP03) and center (IMP02) of the guide vane inlet area are similar in value, about 146 Hz. The corresponding energy ratio is the highest at IMP02, followed by ISP03 and IHP01, which are 95.9%, 53.0%, and 34.2%, respectively, which proves that flow in the middle area of guide vane inlet is greatly affected by impeller rotation. The average IMF frequency at the center of the guide vane outlet (OMP05) is 42.6 Hz, slightly lower than 44.1 Hz at the shroud side (OSP06) and hub side (OHP04) due to the large wall effect of water flow under low flow conditions. The corresponding energy proportion law is similar to that at the guide vane inlet. The corresponding energy proportion at OMP05, OSP06, and OHP04 is 70.2%, 46.5%, and 38.5%, respectively, which indicates that the guide vane can recover water circulation well.

Average frequency and energy share of major intrinsic mode functions (IMFs) (0.3Qbep).
Figure 22 shows the average frequency and energy proportion of IMF with the highest energy proportion in the flow PPS at the guide vane inlet and guide vane outlet under 1.0Qbep working condition. The results show that the average frequency of IMF at IHP01 is 152.9 Hz at 1.0Qbep, which is slightly higher than 147.3 and 147.2 Hz at IMP02 and ISP03. The corresponding energy ratio from ISP03 to IHP01 gradually decreases, which are 97.7%, 92.3%, and 52.1%, respectively, indicating that the flow in the middle of the guide vane inlet and in the rim area is mainly affected by impeller rotation, while the flow in the hub area is affected by wall effect, and the main fluctuation frequency and energy proportion change. At the guide vane outlet, the average frequency of IMF from OHP04 to OSP06 decreased gradually due to the double effect of impeller rotational frequency and wall disturbance, which are 57.2, 51.4, and 36.7 Hz, respectively. The corresponding energy ratio was similar to that at the guide vane inlet, which is 67.4%, 38.0%, and 32.1%, respectively, from OSP06–OHP04, indicating that guide vane can recover water circulation well, but the energy proportion corresponding to main frequency decreases compared with small flow condition due to the increase of flow rate.
Average frequency and energy share of major intrinsic mode functions (IMFs) (1.0Qbep).
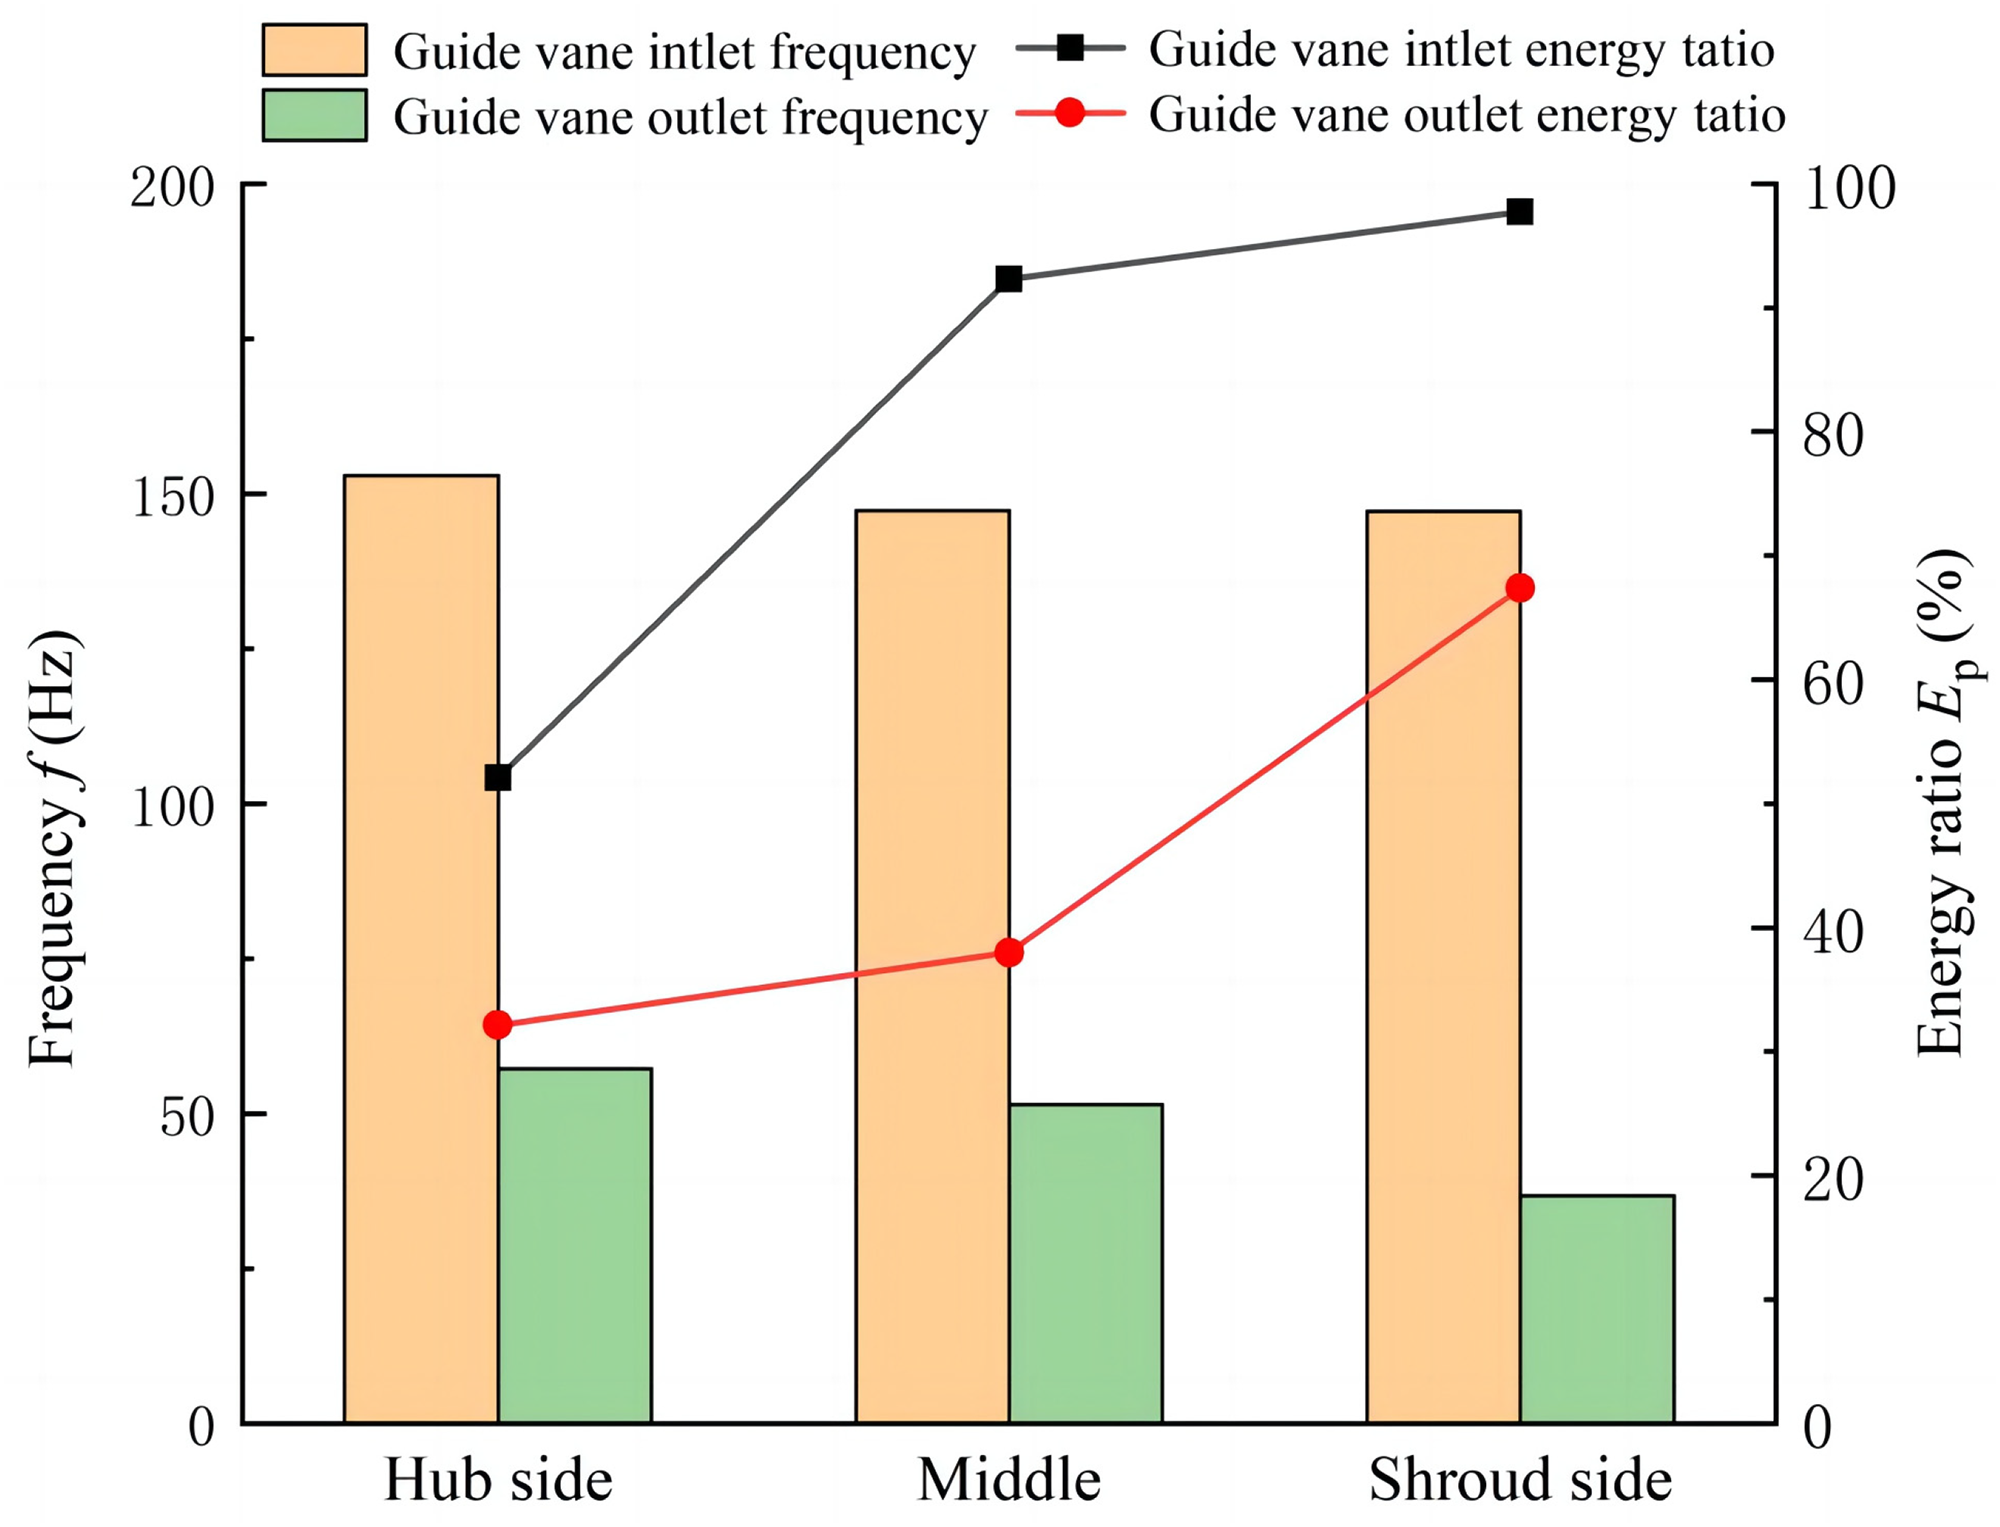
Figure 23 shows the average frequency and energy proportion of IMF with the highest energy proportion in the flow PPS at the guide vane inlet and guide vane outlet under 1.2Qbep working condition. Under the condition of 1.2Qbep, the average IMF frequency of IMP02 in the guide vane inlet is 148.7 Hz, which is slightly higher than 147.5 Hz of IHP01 and ISP03. The corresponding energy proportions of IMP02, ISP03, and IHP01 are 95.8%, 92.4%, and 91.6%, respectively. At the guide vane outlet, the frequency of water flow fluctuation is mainly affected by the impeller rotating frequency and is little affected by wall disturbance. The average frequency of IMF from OHP04 to OSP06 increases gradually, which are 142.4, 146.9, and 147.9 Hz, respectively. The corresponding energy ratio of OMP05 is 80.4%, which is slightly higher than 64.4% and 61.0% of OSP06 and OHP04, which indicates that the main frequency of water flow is controlled by impeller rotation even after guide vane guiding water flow and circulation recovery due to excessive flow.

Average frequency and energy share of major intrinsic mode functions (IMFs) (1.2Qbep).
Under 0.3Qbep condition, the flow is greatly affected by the guide vane wall. The main fluctuation frequency of the flow significantly decreases after passing through the guide vane, which can guide water flow and recover circulation well. When the flow increases, the main frequency decreases under the joint action with the guide vane wall, and the influence of impeller rotation increases, but the energy proportion corresponding to the main frequency decreases compared with the 0.3Qbep condition. Under the 1.2Qbep condition, the main frequency of water flow has not changed significantly after it is guided by the guide vane, and the energy proportion corresponding to the main frequency is high, which indicates that the water flow is mainly controlled by the rotation of the impeller.
Conclusion
In this study, the complex flow pressure fluctuation signals generated by the interaction between the impeller and the guide vane are analyzed. Considering the impeller–guide vane interaction, the three-dimensional steady and unsteady numerical calculation of the VAFPD is carried out, and the energy performance of the VAFPD is predicted, and compared with the experimental results to verify the validity of the numerical calculation. The vortex structure inside the guide vane was analyzed and the Hilbert–Huang method was used to analyze the time–frequency characteristics of the PPS inside the guide vane, and the PPS spectrum and energy distribution characteristics of the feature points at different positions of the guide vane are obtained. The following conclusions were reached:
Under the 0.3Qbep condition, the flow in the guide vane is chaotic and has large deformation and dissipation, the internal pressure is obviously affected by the impeller, and there are some large volume vortex structures with block distribution. Under 1.0Qbep and 1.2Qbep conditions, the area of the high-pressure zone and the low-pressure zone in the guide vane is basically not affected by the impeller, and the vortices in the guide vane body are mainly distributed near the outlet of the guide vane, and the distribution is not uniform. The vortices at the inlet are small and there are strip vortices at the rim of the guide vane edge. When the flow increases, the size and quantity of the vortices decrease. The PPS at the inlet of the guide vane is influenced by the rotation of the impeller and exhibits good periodicity. The main frequency falls around 4 times the rotation frequency (146 Hz), and the energy proportion is high, up to 97.7%. There are low-frequency signals below 100 Hz and high-frequency signals fluctuating around 146 Hz in all three flow conditions. As the flow rate increases, the influence of impeller rotation on the water flow increases, and the fluctuation amplitude of high-frequency signals increases, resulting in an average frequency increase. This is manifested as the average frequency of the IMF component with the highest proportion at 0.3Qbep being slightly lower, while the average frequency is slightly higher at 1.0Qbep and 1.2Qbep. The flow rate has a significant impact on the water at the outlet of the guide vane. The average frequency of the IMF component with the highest energy ratio at 1.2Qbep is about 145 Hz, which is close to 4 times the rotation frequency, which is 337.2% and 268.5% of that at 0.3Qbep and 1.0Qbep. At 0.3Qbep, its frequency is distributed within the range of 0–500 Hz, mainly concentrated in the area below 400 Hz. At 1.0Qbep, the pressure pulsation frequency is distributed below 250 Hz after being guided by the guide vane. At 1.2Qbep, the water flow is mainly controlled by the rotation of the impeller, and after energy recovery by the guide vanes, its main frequency is still concentrated around 150 Hz. Under the working condition of 0.3Qbep, the IMF energy corresponding to the dominant frequency at the center of the guide vane inlet is the highest, which is 95.9%. The IMF energy corresponding to the dominant frequency of the shroud side and the hub side of the guide vane is relatively low. If the flow rate rises from 0.3Qbep to 1.2Qbep, the IMF energy ratio increases by more than 42%. Under 0.3Qbep and 1.0Qbep working conditions, the main frequency of PPS at the guide vane outlet is less affected by the impeller and the corresponding energy ratio is lower. Under 1.2Qbep working conditions, the main frequency of PPS is 4 times the rotational frequency and the corresponding capacity ratio is higher than 60%.
In summary, the change of flow rate will affect the internal pressure and vortex structure of the guide vane, which is consistent with the conclusions of other scholars. In this paper, the three-dimensional Hilbert time–frequency spectrum of the inlet and outlet of the guide vane including time, frequency and amplitude, and the energy proportion of different frequency bands in the PPS are obtained by HHT method, which provides a new and effective method for exploring the influence of flow rate on the flow field of the guide vane. This provides a new and effective method for monitoring the operation state of the pump device during the operation and maintenance of the pump device in the future, finding possible faults in time, and providing some help for noise reduction and stability analysis of the pump device. In order to expand the current work, in the future, other advanced technologies will be used for experiments to reduce interference and collect water flow pressure pulsation data in the impeller guide vane coupling area and guide vane area, in order to explore more accurate mechanisms of pressure pulsation caused by complex internal flow.
Footnotes
Declaration of conflicting interests
The author(s) declared no potential conflicts of interest with respect to the research, authorship, and/or publication of this article.
Funding
The author(s) disclosed receipt of the following financial support for the research, authorship, and/or publication of this article: This work was supported by the National Natural Science Foundation of China (Grant No. 51609210), Major Projects of the Natural Science Foundation of the Jiangsu Higher Education Institutions of China (Grant No.20KJA570001), the Technology Project of the Water Resources Department of Jiangsu Province (Grant No. 2022074), the Science and Technology Plan Project of Yangzhou City (Grant No. YZ2022192), the Scientific Research Program of Jiangsu Hydraulic Research Institute (Grant No. 2021) and the Postgraduate Research & Practice Innovation Program of Jiangsu Province (Grant No. SJCX22_1757).
Author biographies
Zhikang Lin is a Master candidate of Yangzhou University, mainly engaged in scientific research of pump station engineering.
Fan Yang is a Doctor of Engineering, Professor, mainly engaged in research on pump equipment and pump station engineering.
Ping Ding is an Engineer, Master degree candidate, mainly engaged in scientific research and construction of pump station engineering.
Juan Teng is an Engineer, Master degree candidate, mainly engaged in research on hydraulic performance and structural characteristics of low lift pump station.
Yao Yuan is a Senior engineer, doctoral candidate, mainly engaged in research on internal flow and structural characteristics of pump station.
Yan Jin is an Associate professor, the research field is hydraulic optimization and stability research of low lift pump device.