
Abstract
The gap leakage between the impeller ring leads to the change of the pump cavity flow characteristics, resulting in the uneven pressure distribution of shroud, which causes the axial force of the cavity to change. In this paper, the flow in the front and the rear cavity of the multistage centrifugal pump was taken as the research object. Through the numerical method, the radial flow velocity, the leakage flow size and its direction, the core zone rotation factor of the front and the rear cavity of the multistage pump impeller at all stages and the axial force of pump cavity were studied. The results show that the leakage in the front cavity of multistage pump impeller at all stages flows inward along radial direction (i.e. it flows from the inlet of pump cavity to the front ring clearance). The rotation factor in core zone is higher than 0.5, and with the increase of rotation factor, the axial force of the front pump cavity increased. The leakage in the rear pump cavity flows outward along radial direction (i.e. it flows from the rear ring to the inlet of pump cavity). The rotation factor in core zone is less than 0.5, and with the increase of rotation factor, the axial force decreased gradually. Besides, the radial velocity and rotation factor in the front and the rear multistage pump of impellers were obviously along the axial direction at three regions, the regions are pump case boundary layer, core zone and impeller boundary layer. The flow in the core zone is dominated by circumferential circular motion, and the radial velocity in the core zone is 0. It is shown that the direction of the leakage in the pump cavity and the rotation effect of the flow micelle in the mainstream core zone are the main factors affecting the axial force of the pump cavity, and the research results can provide theoretical guidance for the calculation and suppression of axial force of multistage pumps.
Introduction
The segmented multistage pumps is compact, and the shape and size of each middle section (and guide vane) are the same for easy casting, so it is widely used in the field of engineering and technology. 1 At present, the theoretical calculation formula of the axial force in the front and the rear cavity of the centrifugal pump is regarding the rotational angular velocity of the flow in the pump cavity as half of the impeller rotational angular velocity, 2 however, this assumption is the main reason of the theoretical calculation error for the axial force.3–6 Based on the fluid around the impeller has different circumferential angular velocity, Lu et al. 7 deduced the axial force calculation formula through reducing the diameter of the impeller back shroud, and the accuracy of the theoretical formula was verified by experiments. He et al. 8 found that there is an error between the traditional theoretical formula of axial force and the experimental value of axial force during the axial force test of a single-stage model of seawater desalination multistage pump, while the trend was basically the same. Lino et al. 9 studied the influence of axial distance of impeller shroud, flow rate and seal ring clearance on the axial force of multistage pump through experiments, and the calculation procedure of axial force of multistage pump was developed. In order to further explore the generation mechanism of axial force, scholars have also done a lot of researches on the flow characteristics of centrifugal pump cavity. Wang et al. 10 studied the influence of the change of the head and the secondary impeller ring clearance of the multistage pump on the axial force by experimental and numerical methods. The results show that the leakage has a great influence on the rotational angular velocity of the pump cavity flow. Gantar et al. 11 used laser Doppler anemometer (LDA) to measure the rotation speed of the impeller side cavity of the multistage pump, and analyzed the influence of the rotation characteristics of the side cavity flow on the axial force of the pump. Bruurs et al. 12 calculated the axial force of the multistage pump by combing the analysis method with the CFD method. It was shown that there is an error between the hybrid method and the full CFD method due to the difference in the pressure distribution of the pump cavity. Through theoretical calculation, the pressure distribution in the pump cavity of chemical centrifugal pump was obtained by Zou and Zhou. 13 By adding back blade to the back shroud of the impeller, the rotational angular velocity in the cavity and the radial flow can be increased, resulting in the decrease of the flow pressure at the shaft seal of the cavity. The above studies show that the leakage flow in the cavity of the centrifugal pump will affect the rotation speed of the flow in the mainstream core zone, resulting in the axial force of the pump cavity to change. Due to the large number of impeller stages of multistage pump and the complex internal flow, clarifying the common regularity between the flow mechanism of pump cavity and the axial force distribution is the key to accurately calculate the axial force.
In this paper, the raw material pump of methyl-ethyl ketone reaction device in a petrochemical company-segmental double-case multistage pump was taken as the research object, the variation laws between the axial force and the radial flow velocity, the leakage direction and the rotation factor in the mainstream core zone of the front and the rear cavity of the multistage pump impeller at all stages were analyzed under different working conditions. The research results can provide theoretical guidance for the suppression of axial force in the cavity of multistage pumps.
Model and numerical calculation
Structural parameters of multistage pump
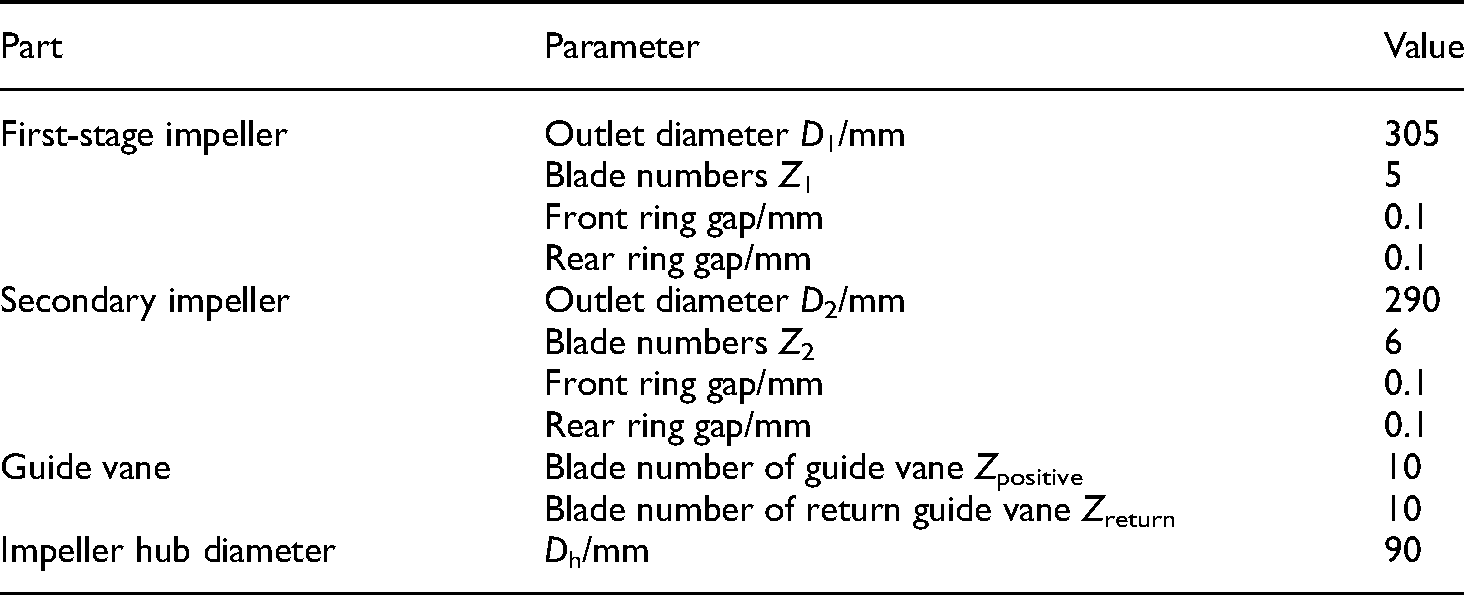
In this paper, the 11-stage double-case multistage pump was taken as the research object. The main parameters of the pump under nominal conditions are: flow rate Qd = 128 m3/h, stage = 11, single-stage head Hi = 106 m, rotating speed n = 2986 r/min. The geometric parameters of the main flow components are shown in Table 1.
Main parameters of the overflow part.
Computation domain and grid division
The full flow field of the 11-stage double-case multistage pump model includes the first stage impeller (stage 1), the secondary impeller (stage 2–11), the guide vane (stage 1–10), the last stage guide vane (stage 11), the suction chamber, the pressurized water chamber, the balance drum and the balance tube. Geometric modelling of pumps was obtained through the 3D modelling software Pro/E, and the flow domains were assembled to obtain the calculation domain of the model pump, as shown in Figure 1.

Computational domain of multistage pump.
The multistage pump calculation domain was meshed using the hexahedral structured mesh in ICEM CFD 16.0 software, and the near-wall area was meshed with an encrypted mesh, with the y+ in the near-wall area being less than 5 (y+ is dimensionless height of the first mesh layer near the wall). Figure 2 shows the grids in main flow components. The pump efficiency and the axial force were taken as criterions for grid-independent verification, and the relationship between the efficiency, the axial force of the pump and the grid at nominal flow rate is shown in Figure 3. It can be seen from the figure that when the grid increases from 48.62 million to 65 million, the absolute value of the pump efficiency is less than 0.023%, and the increase of the axial force is less than 0.35%, therefore, the 48.62 million grid is used for the numerical calculation.

Grids in main flow components.

Grid independence verification.
Numerical method
The shear stress transport (SST) turbulence model achieves a gradual transition from a k–ω model inside the boundary layer to a high Reynolds number k–ω model outside the boundary layer, it could predict flow near the wall or inverse pressure gradient well,11,14–16 so it was used in this paper. FLUENT commercial software was used to compute the internal flow field of the multistage pump. The working medium for the numerical simulation is set to be a mixture of butene and butane with a density of 570 kg/m3. For a vane pump, viscosity is the main parameter affecting the pump performance. The viscosity model based on the two-parameter Peng–Robinson equation of state (PR EOS for short) for hydrocarbon mixtures as follows
17
:
The three-dimensional numerical calculation of the flow in the pump is carried out by FLUENT software. The fluid in the pump was set to uncompressible fluid, and the inlet boundary was the velocity inlet. It was assumed that the flow direction is perpendicular to the inlet section, and the flow velocity was set. The outlet boundary was free outflows, and the flow was considered fully developed. The wall condition also needs to be set, set it to a no-slip condition and the wall roughness was 25 µm. The momentum, turbulent viscosity and turbulent kinetic energy were calculated in second order windward format with an accuracy of 10−5.
Numerical method verification
Hydraulic performance experiments
The experiments were carried out on a laboratory bench of a petrochemical company in Lanzhou, and the experimental setup is shown in Figure 4. The test pump and its pipe system composed by 11-stage double-case multistage pump, inlet pipeline, outlet pipeline, raw material tank, reactor, pressure converter, motor, voltage and current transformer, power distribution room, data acquisition instrument, various instruments and valves. The raw material tank, regulating valve and pressure sensor were installed in the inlet pipeline, they could change the flow rate of multistage pump by adjusting the opening of the inlet valve, and meets the flow rate requirements under the different working conditions. The reactor was installed in the pump outlet pipeline, and the raw material was transported into the reactor for redox reaction through the multistage pump. The AMD400L2RBABM motor (ABB, Switzerland) was used in multistage pump, which can meet the design speed of 2986 r/min for pump operation. The inlet control valve was used to adjust different flow rate conditions, the 7MF403 pressure sensor and AE215 electromagnetic flowmeter were used to measure the pressure of pump inlet and outlet and outlet flow rate, respectively, which were produced by Germany Siemens and China YoKogawa company, and the error is ±0.075% and ±0.5%, respectively. The power was measured by three-term current and voltage transformers, of which the current transformer is the CTK-38 type open current transformer produced by Lraq company, voltage transformer is the DTS634 type three-term voltage transformers produced by Zheng Tai company. The MH6150 type orifice flowmeter (0.5 stage) and the YB-150 type standard manometer (0.4 stage) were used to measure the flow rate and point position pressure of pump tube, they were produced by Shanghai Meng Hui company and Shanghai automation instrumentation NO.4 factory, respectively, and the installation position of them was in the balance pipe axially from the pump inlet 153 mm and 239 mm.

Multistage pump experimental device diagram.
During the experiment, the design flow rate (128 m3/h) was first gradually reduced to a minimum flow rate of 28 m3/h by 20 m3/h steps (considering the uniformity of the experimental values, 10 experimental points were evenly selected in this paper, and the corresponding decreasing flow rate value was 20 m3/h), and then increased to a maximum flow rate of 188 m3/h step by step, and finally adjusted back to the operating flow rate step by step as an experimental cycle. In order to ensure stable operation of the equipment, 2 minutes were reserved for the stability after adjusting each flow rate node, a total of 21 groups of data were measured, and an experimental cycle took about 2.0 hours.
The comparison between the experimental and the simulated values of the hydraulic performance curve of the multistage pump and the flow pressure curve of the balance tube is shown in Figure 5. It can be seen from Figure 5(a) that the change of the numerical prediction performance curve of the multistage pump is agree well with the experimental curve. At nominal flow rate, the numerical calculated value is in good agreement with the experimental value, while under the conditions of small flow rate and large flow rate, the error between the two is large. In addition, the experimental value is always lower than the simulation value, this is because mechanical seal and bearing friction generate an energy loss, and this energy loss is not considered in the numerical simulation. At the nominal flow rate, the errors of head and efficiency are 2.42% and 3.11%, respectively. In order to verify the reliability of calculation method in this paper, measuring the pressure inside the pump cavity and balance drum clearance leakage is important, but measuring them directly is difficult for high-pressure double-case multistage pumps, so this paper choose measuring the balance tube pressure and flow rate and comparing them with the simulation results. From Figure 5(b), it can be seen that the calculation value of the balance tube flow rate is basically consistent with the experimental value, indicating that the flow characteristics of the fluid in the balance tube can be accurately captured by the numerical calculation results. However, the experimental value is always less than the simulation value. This is mainly due to the conservation angular momentum of fluid, the average swirl velocity increases inward, reducing the average static pressure at the inlet of the balance drum clearance, thus affecting the leakage flow rate, and the maximum error of the balance tube flow rate at nominal flow rate is 4.49%. The numerical calculation curve of the pressure inside the balance tube is in good agreement with the experimental curve, and the maximum error is 2.5%. The simulated value is larger than the experimental value under the small flow rete condition, while under the large flow rate condition, the simulated value is smaller than the experimental value, which is mainly because the flow inside the balance tube is related to the leakage of the pump cavity, and the experimental process is affected by the pressure gauge probe, when the leakage increases, the flow squeezability in the small area is obvious, resulting in uneven local pressure distribution, while the numerical calculation is not consider the influence of the probe shape on the flow field, resulting in significant differences between the two at small and large flow rates, but the overall error between the experiment and simulation is within the allowable range, indicating that the calculation method chosen in this paper can provide a reliable guarantee for this study.

Numerical simulation and experimental comparison curve of multistage pump.
Rear pump cavity flow distribution verification
In order to facilitate the analysis of the relationship between the fluid velocity in side cavity of impeller rear shroud and the impeller rotation speed, the distribution of the radial velocity along the axis was analyzed using the dimensionless radial velocity, which is defined as

r is the radius of measuring point in rear pump cavity, m
References 18 , 19 respectively used hot-wire anemometer and PIV to test the average velocity distribution in the gap flow field of closed rotating disk, and obtained the test data of the velocity distribution of rotating disk. Literature20,21 predicted the axial distribution of the fluid flow in the balance cavity and the rear shroud cavity (0.6R-0.9R) by numerical simulation method, and compared with the test value, it was found that the numerical simulation could accurately predict the fluid velocity distribution in the centrifugal pump cavity. The dimensionless radial velocity at 0.4R of the rear pump cavity of last stage impeller was obtained by numerical calculation, and compared with the velocity in literature 18 at this position, the distribution curve comparison between the experimental results and the numerical calculation results is shown in Figure 6.

Radial velocity curve of rear pump cavity.
Figure 6 shows that the radial velocity of the fluid near the rear shroud of impeller is outward along the radial direction, the radial velocity of the fluid near the pump case is inward along the radial direction, due to the influence of impeller outlet high-energy liquid reflux, resulting in the speed of the fluid around the rear shroud and the test measured the speed of the closed disk movement fluid has a certain error, but the overall trend is basically the same. It shows that the calculation method used in this paper can reflect the fluid flow characteristics in the rear pump cavity of the multistage pump, so the calculation method is available.
Flow analysis of secondary impeller pump cavity
In this paper, the clearance flow in the front and the rear cavity of the multistage pump impellers at all stages was taken as the research object, firstly, the movement regularity of clearance was analyzed. As shown in Figure 7, in the front pump cavity of impeller, the flow around the impeller rotates circumferentially at the same angular velocity and its radial velocity direction is outward along the radial direction. The radial velocity direction of the fluid near the shell is inward along the radial direction. Due to the high outlet pressure of the impeller and the low pressure of the front pump cavity ring clearance, the direction of the leakage flow in the front pump cavity of the impeller is radially inward, that is, the fluid flows from the impeller outlet to the ring clearance (direction is shown in Q1). In the rear pump cavity of the impeller, the flow near the impeller is affected by the centrifugal force of impeller rotation, and its radial velocity direction is outward along the radial direction. The radial velocity of the flow near the case is inward along the radial direction. Since the clearance of the rear pump cavity is adjacent to the inlet of the guide vane, its pressure is larger than impeller inlet, resulting in the leakage flow of the rear pump cavity moving outward along the radial direction. That is, the direction of the leakage flow of the rear pump cavity moves along the radial direction to impeller outlet (direction is shown in Q2).

Flow analysis and angle distribution diagram of impeller pump cavity.
In order to verify the above views, in this paper, the multistage pump centrifugal pump impellers at all stages were taken as the research objects, under the working conditions of 0.8 Qd, Qd and 1.2 Qd, the flow distribution of the fluid in front and the rear pump cavity of the impeller and the distribution of the circumferential mean value of the radial velocity along the axial direction of the 1-1 section, 2-2 section and 3-3 section (as shown in Figure 7) were analyzed. At the same time, the influence of the leakage flow direction of the pump cavity on the axial force of the impeller was explored, which provides theoretical guidance for analysis of internal flow mechanism and axial force suppression of multistage pump.
Result analysis
Flow characteristics analysis of the front and the rear pump cavity
In order to analyze the direction of radial velocity in the front and the rear pump cavity of the impeller, Figures 8 and 9 show the regularity of distribution of radial velocity along axial direction in different sections of the front and the rear pump cavity of the multistage pump impeller.

Radial velocity distribution curves along axial direction of different cross sections in the front pump cavity of impeller.
Radial velocity distribution curves along axial direction of different cross sections in the rear pump cavity of impeller.
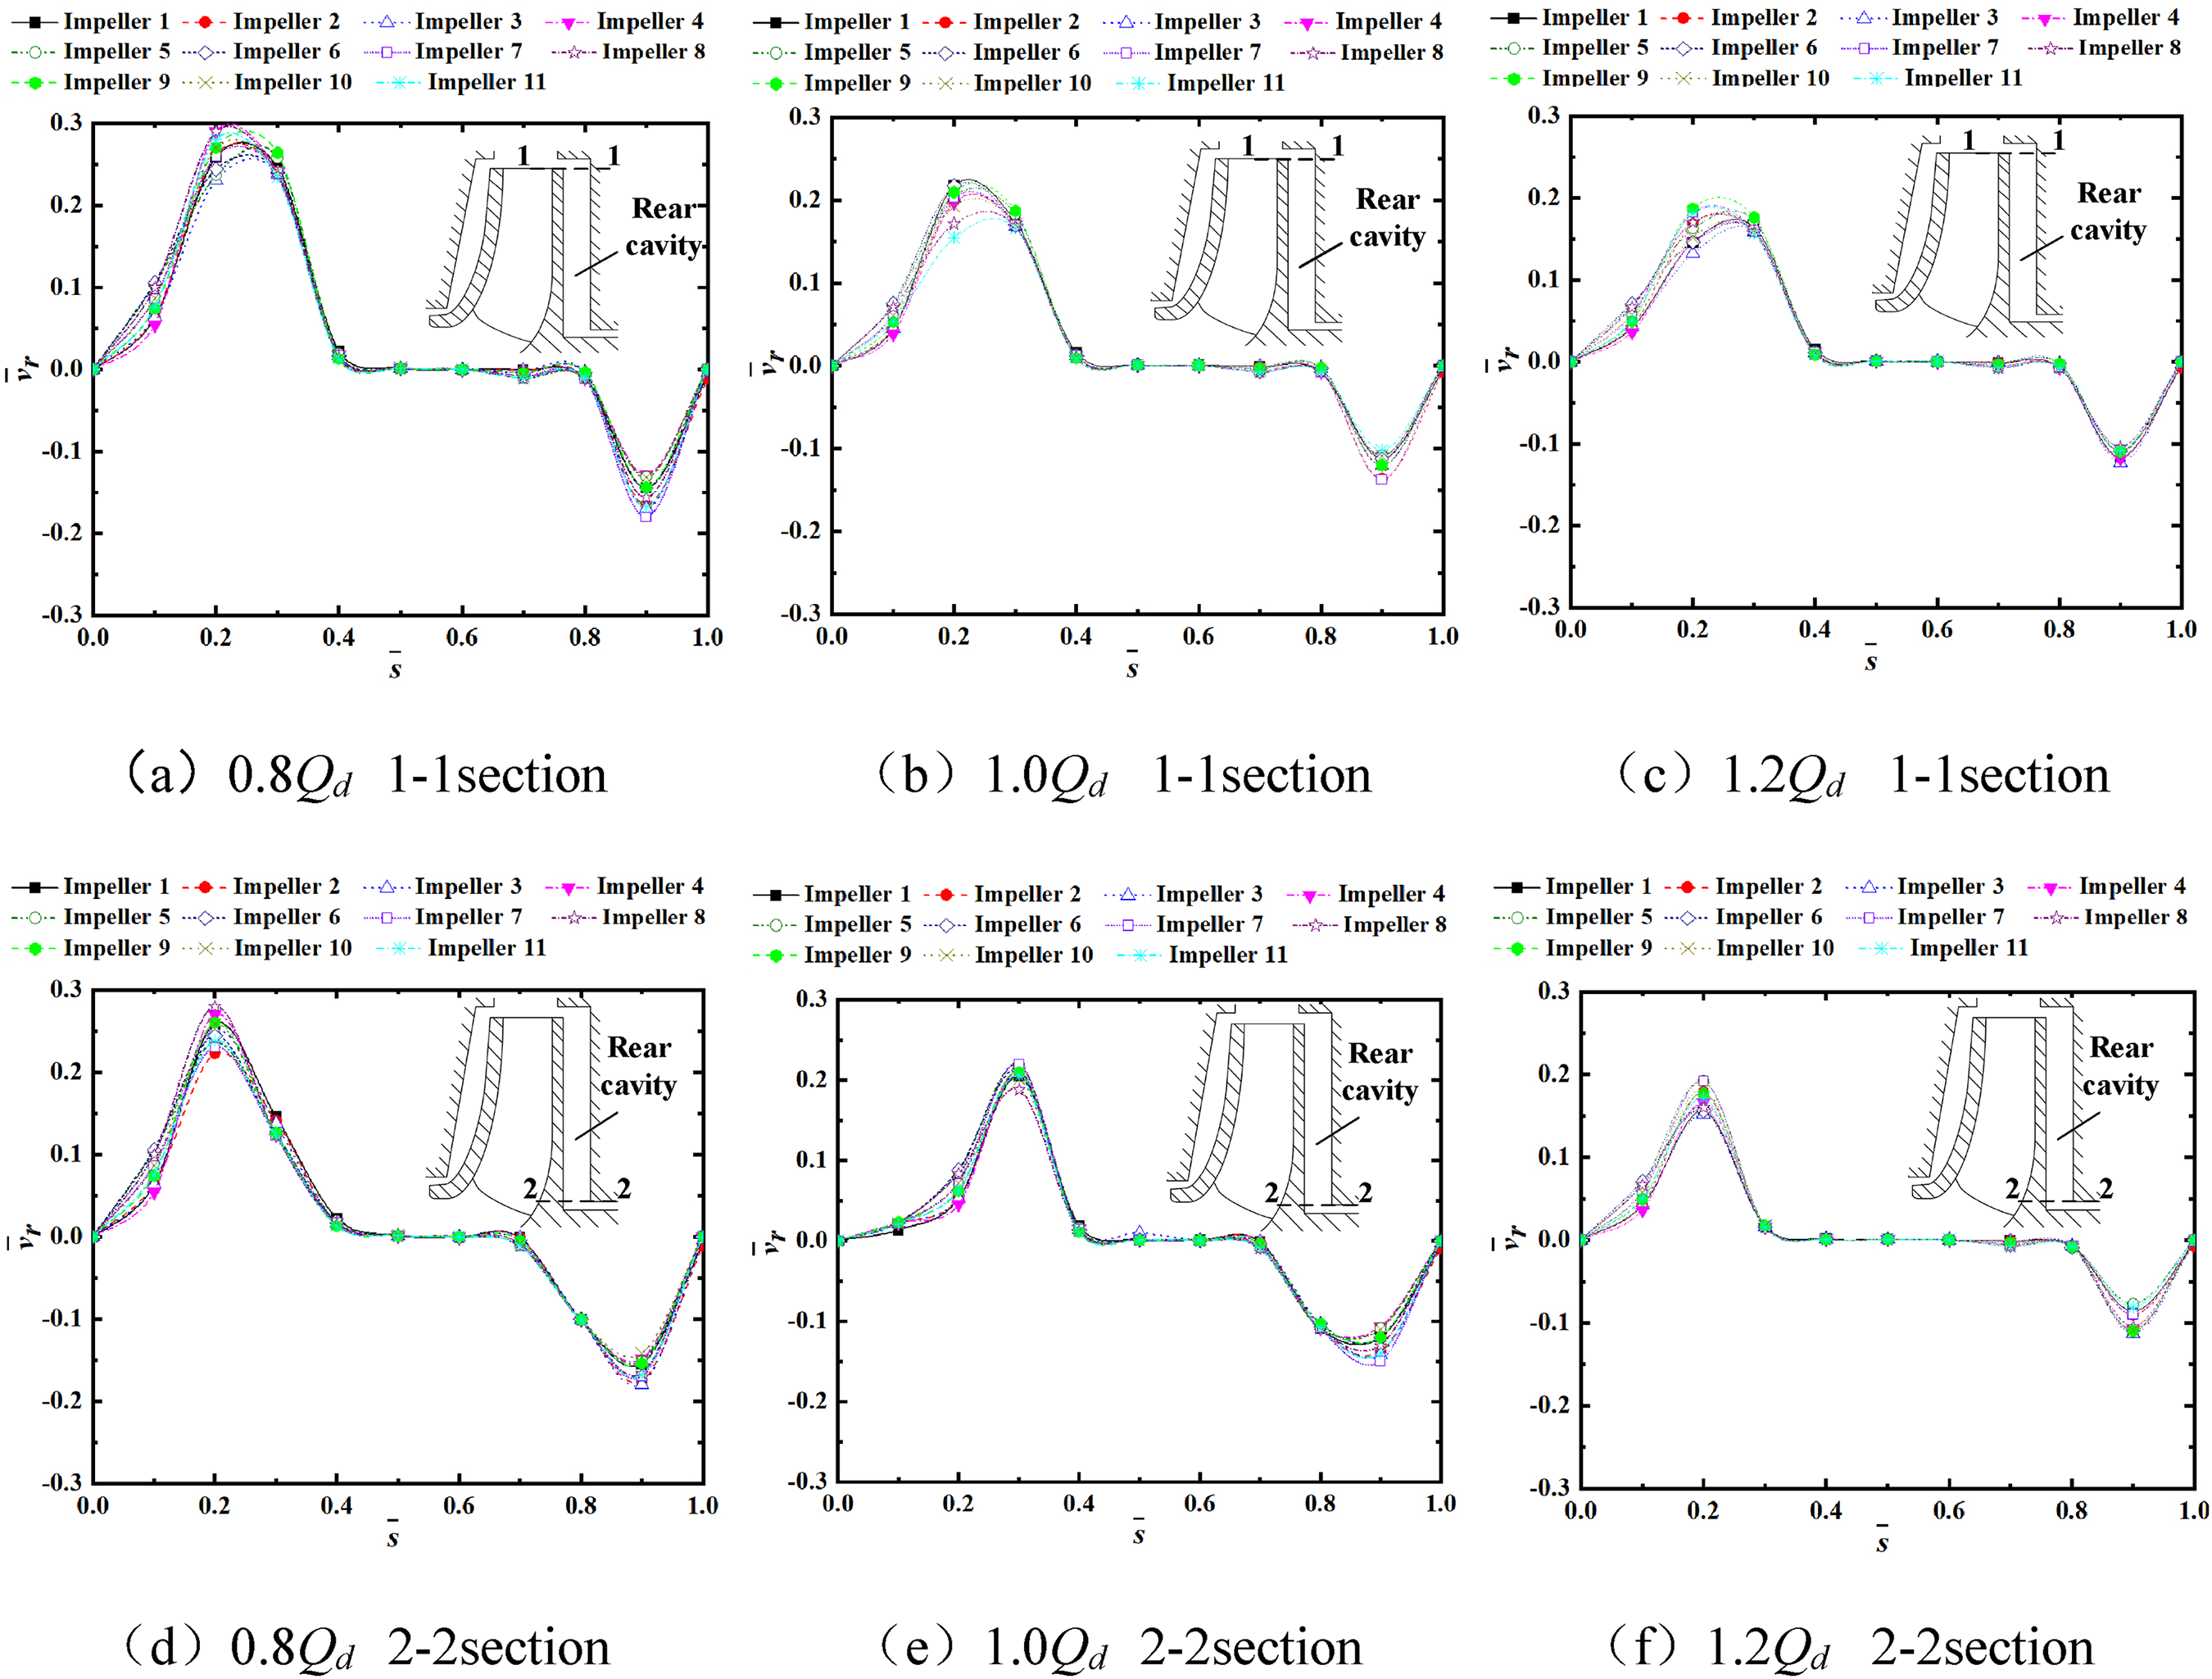
It can be seen from Figure 8 that in the front pump cavity of impeller near the case, the radial velocity direction of impellers at all stages is inward along the radial direction. In the direction near the impeller, the radial velocity direction of impellers at all stages is outward along the radial direction. Since the flow in the core zone is dominated by circumferential rotation, the radial velocity in the core zone is 0. This is because when the impeller rotates, for the flow adsorbed on the wall of the impeller front shroud the velocity is the rotational speed of the impeller. The circumferential velocity of the flow far from the front shroud decreases rapidly, forming a boundary layer, and the flow adsorbed on the case wall moves at a velocity of 0. Due to the sealing leakage, the net flow rate in the front pump cavity of the impeller is superimposed with the impeller circulation, thus the radial velocity of the flow near the case is inward along the radial direction, and the radial velocity of the flow near the front shroud of impeller is outward along the radial direction. When the flow increases, the multistage pump head decreases, the pump cavity leakage of impellers at all stages decreases, and the radial velocity decreases gradually. The radial velocity amplitude in the front pump cavity of the impeller inflow at all stages is generally greater than that of the pump cavity outflow. The radial velocity of the 1-1 section of the front cavity is generally greater than that of the 2-2 section, indicating that a part of the fluid entering the pump cavity from the impeller outlet will circulate in the pump cavity, resulting in the change of the shroud pressure. The correlation between impeller progression and radial velocity variation is low, indicating that there is no obvious regularity between the progression change and the high value point of radial velocity.
It can be seen from Figure 9 that the radial velocity of the fluid in the rear pump cavity of the impeller is outward along the radial direction near the impeller and inward along the radial direction near the case. The radial velocity of the core area is close to 0. The radial outward velocity amplitude and range of the flow in the rear pump cavity are larger than those in the radial inward direction, this is different from the front pump cavity, indicating that the direction of the leakage flow in the rear pump cavity is outward along the radial direction, the back ring is connected with the inlet of the guide vane, and the pressure is larger than that of the impeller inlet. Therefore, the direction of the leakage flow in the rear pump cavity is moving along the rear ring clearance to the impeller inlet. The amplitude and range of 2-2 section in the rear pump cavity are lower than those of 1-1 section, this is because the leakage flow is affected by the centrifugal force in the pump cavity, resulting in the generation of the circulation movement along the circumferential direction and the enhancement of the outlet radial velocity. With the increase of flow rate, the pressure difference and the radial leakage flow in the rear pump cavity decrease, thus the radial velocity amplitude decreases gradually with flow rate increase. The variation regularity of impeller stages and radial velocity is not obvious.
The above studies show that in the front and the rear pump cavity of the multistage pump impeller, the radial velocity distribution is closely related with the direction and magnitude of the clearance leakage flow. In order to further clarify the circumferential velocity distribution characteristics of the front and the rear pump cavity along the axial direction, the stable flow region at the radial center 3-3 section was taken as the research object. Figures 10 and 11 show the distribution curve of flow rotation factor along the axial direction in the front and the rear of the multistage pump impellers at all levels at 3-3 section. The definition of rotation factor is as follows
22
:

Axial distribution curve of rotation factor of 3-3 section in the front pump cavity of impeller.

Axial distribution curve of rotation factor of 3-3 section in the rear pump cavity of impeller.
In the formula, Cu is the tangential velocity of the flow, m/s. u is the rotational circumference velocity of impeller, m/s. β is the angular velocity of flow in the core zone, s−1. ω is the rotational angular velocity of impeller, s−1.
It can be seen from Figure 10 that in the front pump cavity of impeller, the rotation factor increases first and then remains unchanged and then increases along the axial direction, indicating that in the boundary layer of pump case, when the rotation factor increases from 0 to a certain value, the velocity gradient and the viscous resistance in the boundary layer increase. In the core zone of pump cavity, the rotation factor remains unchanged at a certain value, this is mainly due to the main motion of the mainstream region is circumferential rotation. In the boundary layer of shroud, the rotation factor increases gradually from a certain value to 1, that is to say the flow near the shroud rotates circumferentially with shroud. Besides, the rotation factor of mainstream core zone at the central section in the pump cavity of impellers at all stages is larger than 0.5, indicating that the spin velocity of flow is greater than the rotational velocity of the impeller in the front pump cavity. This is because the leakage of the front pump cavity flows from impeller outlet to pump cavity along the radial direction, and the rotation of the flow in the pump cavity is accelerated due to the angular momentum flow which carried by the leakage flow. When the flow rate increases, the rotational angular velocity decreases gradually. This is mainly because the pressure difference between the inlet and outlet of impeller, the leakage of the pump cavity, and the swirl flow rate are reduced.
It can be seen from Figure 11 that the rotation factor in the rear pump cavity of impeller decreases first, then remains unchanged and then decreases along the axial direction. The flow presents a variation trend of boundary layer in three regions, under the different flow rate, the rotation factors of the mainstream core zone are less than 0.5, indicating that the spin velocity of flow in the rear pump cavity is less than that of the impeller, this is because in the rear pump cavity, the direction of the leakage flow is outward along the radial direction. That is, from the ring clearance to the impeller outlet, the circumferential velocity component of the leakage flow is small, which will cause the rotation of the pump cavity flow to be slow down. Besides, with the increase of the flow rate, the rotation factor of the core zone shows a gradually increasing trend, which further indicates that the spin velocity of the pump cavity increases gradually with the decrease of the leakage.
In order to further analyze the influence of leakage flow direction on the velocity distribution in the front and the rear shroud, under the different working conditions, the leakage magnitude in the front and the rear pump cavity at the 1-1, 2-2 and 3-3 sections of impellers at all levels are given by Figure 12.

The leakage in the front and the rear pump cavity of impellers at all levels.
It can be seen from Figure 12 that the leakage values are slightly different in the front and the rear pump cavity of impellers at all stages at different sections. This is mainly because part of the fluid in the pump cavity becomes backflow, resulting in a part of flow to remain in the pump cavity, and the flow rate in the section was affected. Figure 12(a) shows that for the front pump cavity, the leakage of impellers at all stages is the largest at the 1-1 section, followed by is the 3-3 section, and the 2-2 section is the smallest. It shows that the direction of the leakage flow in the front pump cavity is moving inward along the radial direction, but there is a little difference in the leakage at each section. Under the small flow rate condition, the average values of the leakage in the front cavity of impellers at all levels of 1-1, 2-2 and 3-3 sections are 0.896 kg/s, 0.861 kg/s and 0.881 kg/s, respectively. At nominal flow rate, the average values of 1-1, 2-2 and 3-3 sections are 0.857 kg/s, 0.835 kg/s and 0.845 kg/s, respectively. Under the large flow rate condition, the average values of 1-1, 2-2 and 3-3 sections are 0.824 kg/s, 0.804 kg/s and 0.816 kg/s, respectively, it shows that with the flow rate increases, the head and the clearance leakage in the front pump cavity of impellers at all stages are decrease gradually. It can be seen from Figure 12(b) that the leakage in the rear pump cavity of impellers at all stages is ranked as follows: 2-2 section is the largest, 3-3 section is the second, and 1-1 section is the smallest. This is because the direction of the leakage flow of the rear pump cavity is outward along the radial direction, the flow is trapped in the channel due to part of flow vortex backflow, therefore, the leakage increases gradually along the radial direction. Similar to the front pump cavity, the leakage of the rear pump cavity gradually decreases with the increase of flow rate.
Analysis of flow field characteristics in the front and the rear pump cavity
In order to analyze the distribution of vortex bands in the pump cavity, Figure 13 shows the flow lines in the front and the rear pump cavity of the first stage, intermediate stages (five stages) and final stage impellers, respectively. It can be seen from the figure that near the impeller inlet of the front and the rear pump cavity, there is a vortex band in the local area, the range of the vortex band of flow in the rear pump cavity gradually increases with increase of stages, and the variation range of the vortex band in the front pump cavity is not obvious. Besides, the aggregation of streamlines can be seen near the ring clearance in the front and the rear pump cavity, this is caused by the concentrated movement of flow to the ring. The vortex distribution in the pump cavity indicates a circulation phenomenon in the region, and also reveals the reason why the clearance leakage is different slightly from the impeller inlet to the outlet.
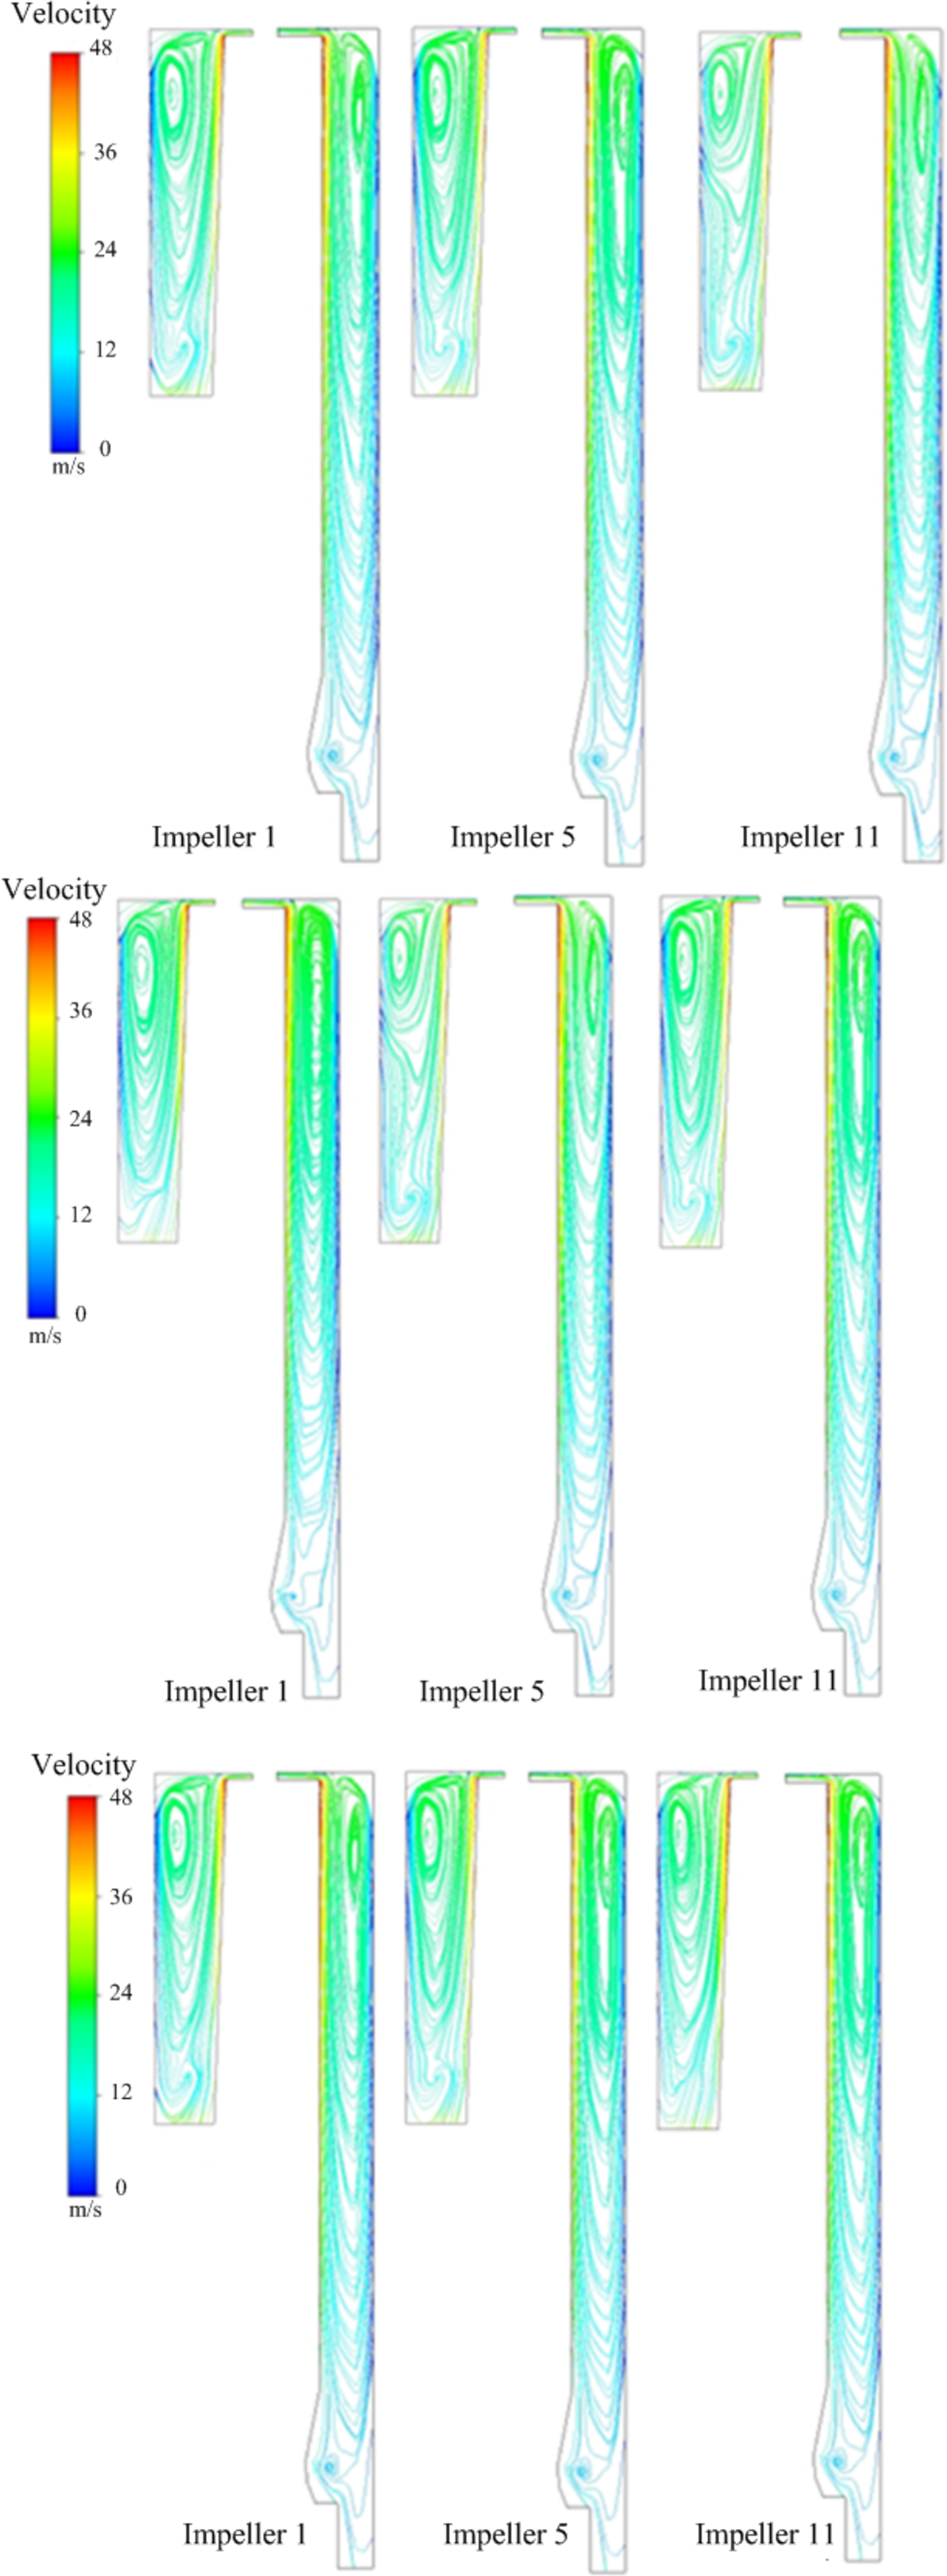
The front flow line distribution in the front and the rear pump.
Axial force distribution characteristics in the front and the rear pump cavity
Based on the analysis of the radial velocity and leakage flow in the front and the rear pump cavity of multistage pump, the relationship between the axial force in the front and the rear pump cavity of impellers at all stages and the impeller stages and the rotation factor of the core zone are discussed. Under different working conditions, the curves of the axial force in the front and the rear pump cavity and the rotation factor in the 3-3 section core zone changed with the impeller stages are given by Figure 14.
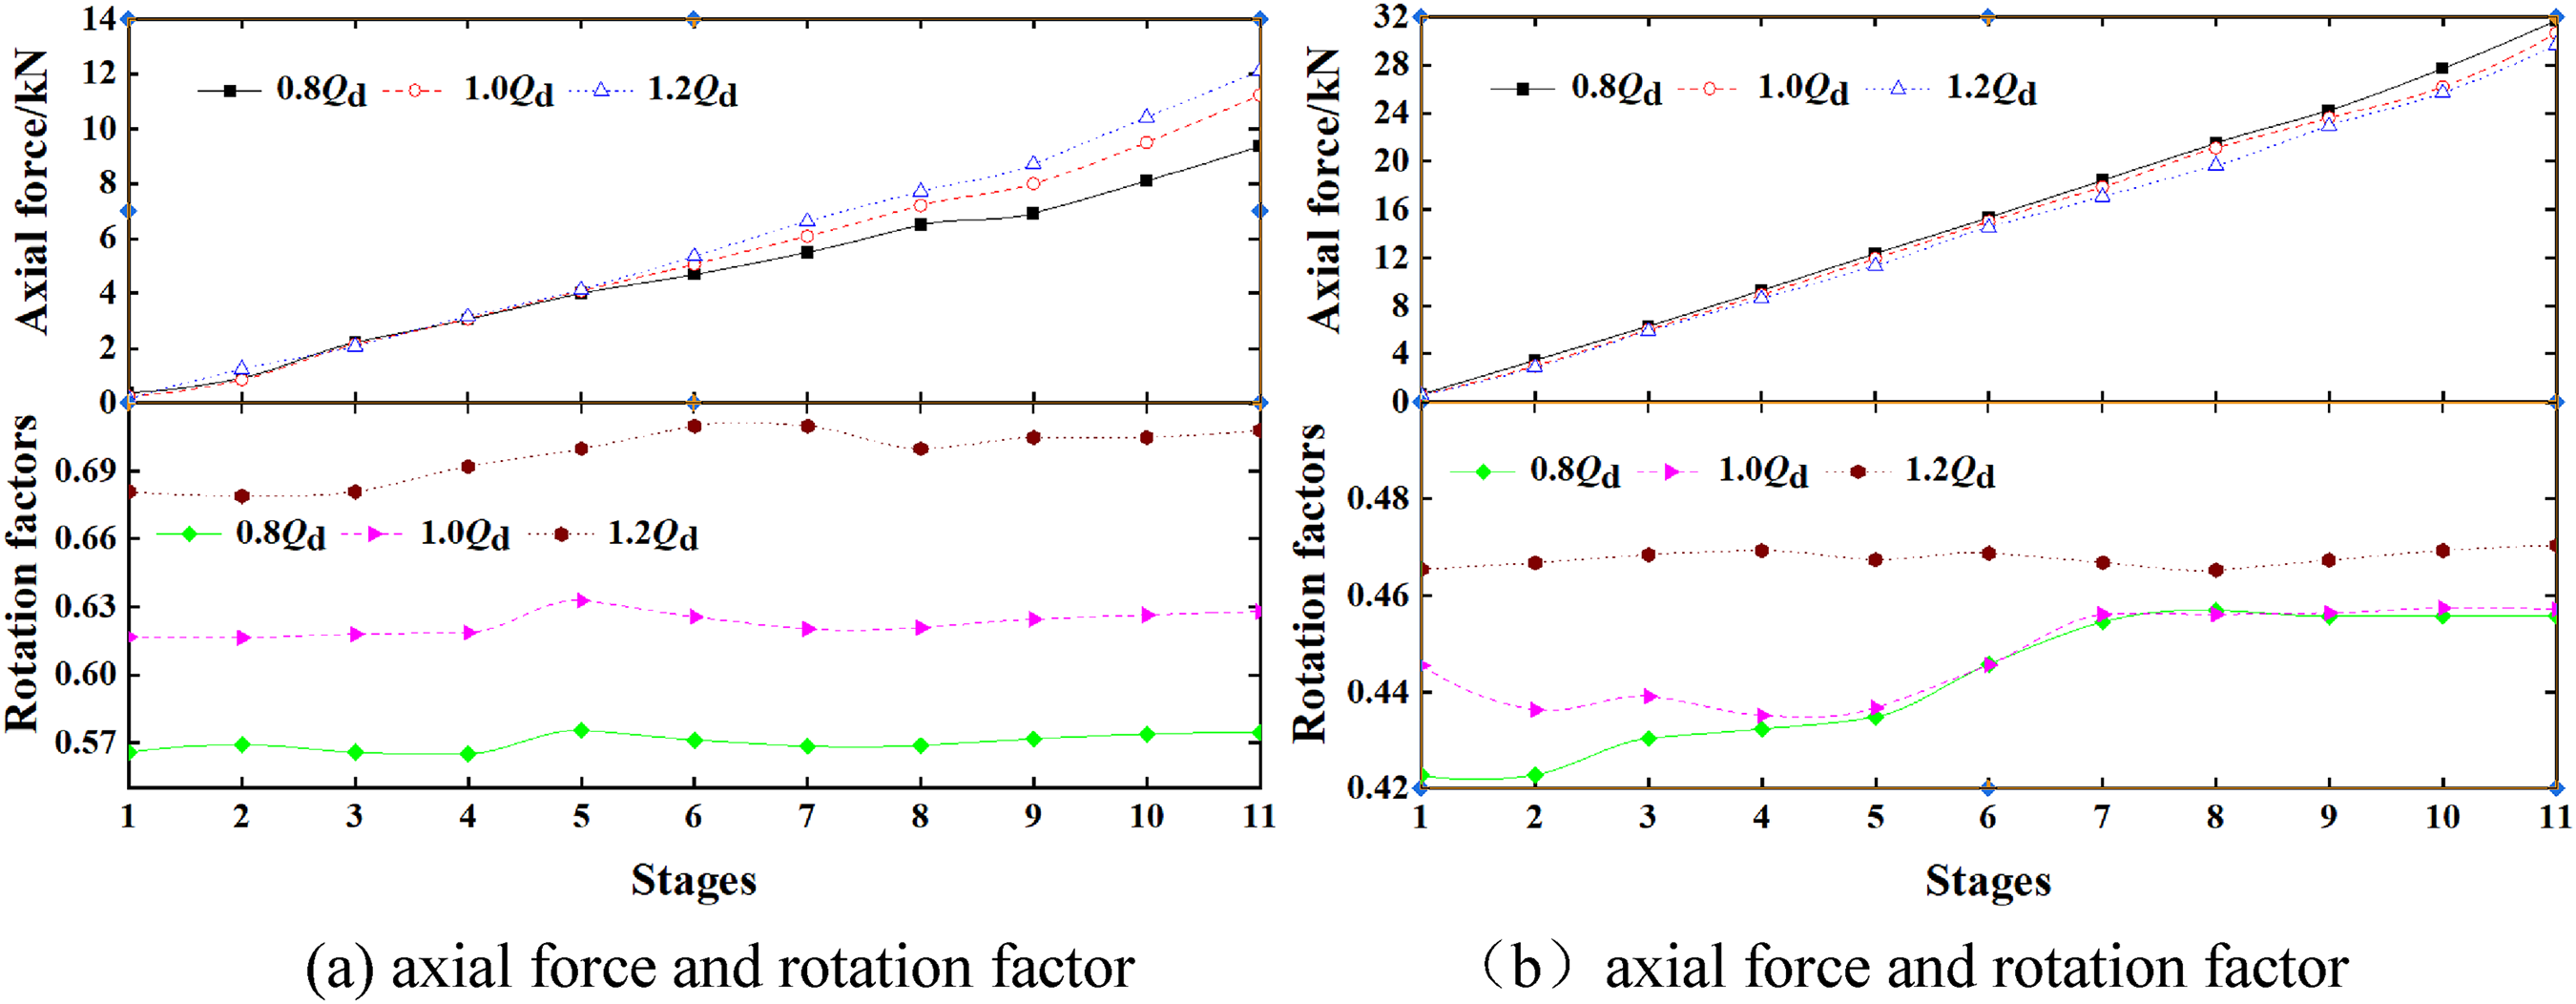
Curve of axial force in the front and the rear pump and rotation factor with stages.
It can be seen from Figure 14 that the axial force in the front and the rear pump cavity of impellers at all levels and the rotation factor in the 3-3 section core zone gradually increase with the increase of stages, that is, the correlation between the axial force of the pump cavity and the rotation factor is quite different. It can be seen from Figure 14(a) that under the same stages, the axial force in the front pump cavity and the rotation factor gradually increased with the increase of flow rate, indicating that when the rotation factor in the core zone is larger than 0.5 (i.e. the leakage flow is inward along the radial direction), the larger the rotation factor is, the larger the axial force is. Figure 14(b) shows that under the same stage, the larger the flow rate is, the smaller the axial force is and the larger the rotation factor is. The above phenomenon shows that the rotation factor is inversely proportional to the axial force when the rotation factor is less than 0.5 (i.e. the leakage flow is outward along the radial direction).
The main reason for the above phenomenon is that when the leakage flow is inward along the radial direction, the flow rotation in the pump cavity will be accelerated by the swirl flow entering into the front pump cavity from the impeller, resulting in the angular velocity of the flow in the core zone to be larger than that of the impeller, and the flow pressure difference distribution in the pump cavity to be increased. Therefore, the larger the rotation factor in the core zone of the front pump cavity is, the larger the axial force is. When the leakage flow is outward along the radial direction, the angular velocity of the flow in the core zone is reduced by the non-cyclonic flow entering into the rear pump cavity from the rear ring, which is smaller than the rotational angular velocity of impeller. At this time, the pressure difference of the pump cavity will be reduced by the swirl in the core zone, then the axial force will be reduced.
Distribution of impeller axial force
The relationship of the axial force of the impeller at each stage with the number of stages is shown in Figure 15. As can be seen from the figure, with the increase of flow rate, the each stage impeller dynamic reaction force gradually increased, there is no obvious regularity between stage variation and impeller dynamic reaction force, the first stage impeller dynamic reaction force is slightly increased than other stages, this is because the first stage impeller inlet and suction chamber is connected, its flow is smoother, the shaft surface flow velocity is more uniform, resulting in its dynamic reaction force is larger. In addition, the direction of dynamic reaction force and the direction of axial force of multistage pump is opposite, the dynamic reaction force is along the axial direction pointing to the pressurized water chamber, the greater the dynamic reaction force of the impeller, the smaller the total axial force of the multistage pump.

Curve of dynamic reaction force of impeller changing with stages.
Conclusion
Affected by the viscous force between fluid and solid wall and inter-fluid adhesion, the radial velocity in the front and the rear pump cavity of the multistage pump impellers at all stages and rotation factor are obviously distributed in three regions along the axial direction, that is, the pump case boundary layer, the core zone and the impeller boundary layer. The circumferential circular motion is mainly dominated in core zone, and the radial velocity is 0.
The radial flow direction of front and rear cavity of the impeller and rotation factor have great different effects on the axial force. The leakage flow in the front pump cavity of impellers at all stages is inward along the radial direction (i.e. it flows from the pump cavity inlet to the front ring clearance), and the rotation factor of the core zone in the pump cavity is larger than 0.5. The leakage flow in the rear pump cavity of impellers at all stages is outward along the radial direction (i.e. it flows from the rear ring to the pump cavity inlet), the rotation factors of the core zone are less than 0.5. Besides, the rotation factor of the front and the rear pump cavity gradually decreases with the increase of flow rate.
Affected by the rotating fluid at the impeller outlet, the similarities and differences between the axial force of the impeller pump cavity and the rotation factor of the core zone are obvious. That is, for the front pump cavity of impeller, the larger the rotation factor is, the larger the axial force is, while for the rear pump cavity of impeller, the larger the rotation factor is, the smaller the axial force is.
Footnotes
Acknowledgments
The study is supported by Lanzhou University of Technology Hongliu outstanding youth and Open Research Subject of Key Laboratory of Fluid Machinery and Power Machinery (Xihua University), Ministry of Education (number: LTDL 2021-010).
Authors’ contributions
The first author is Qian Chen who did the paper writing and data calculation.
The second author is Yang Li Huan who did the data calculation and experimental debugging.
The third author is Qi Zhi Peng who made a summary of paper ideas.
The fourth author is Yang Cong Xin who made the experimental measurement.
The fifth author is Niu Chen Hui who made the experimental debugging.
Declaration of conflicting interests
The author(s) declared no potential conflicts of interest with respect to the research, authorship, and/or publication of this article.
Funding
The author(s) disclosed receipt of the following financial support for the research, authorship, and/or publication of this article: Lanzhou University of Technology Hongliu outstanding youth and Open Research Subject of Key Laboratory of Fluid Machinery and Power Machinery (Xihua University), Ministry of Education (number: LTDL 2021-010)
Author biographies
Qian Chen is a lecturer at Lan Zhou University of Technology, preside over the Natural Science Foundation of Gansu Province and the Open Fund for Key Laboratories of the Ministry of Education, participated in two projects of the National Natural Science Foundation of China, published four EI papers and three SCI papers as the first author.
Yang Li Huan, is a second-year graduate student at Lan Zhou University of Technology.
Qi Zhi Peng is graduated from Xi' an Jiaotong University in 2004 a master's degree in engineering thermal physics. He is currently the general manger of Hi-tech Reaearch and Development. For many years, he has been engaged in the design and construction of solar thermal power plants, high-efficiency heat exchanger design and CO2 energy storage research. Led the design of Dunhuang 10MW tower molten salt power plant and Dunhuang Phase II 100MW tower molten salt power plant. He has completed many national projects and participated in the development of many national standards.
Yang Cong Xin is currently the director of China Energy Society, member of National Pump Standardization Technical Committee, expert and senior technical advisor of China Nuclear Pump Expert Group, expert of China Postdoctoral Fund, expert of National Small and Medium Enterprise Innovation Fund, member of Academic Committee of Gansu Wind Turbine Engineering Technology Research Center, member of Gansu Wind Power Equipment Standardization Technical Committee, senior member of China Renewable Energy Society, member of Academic Committee of Lanzhou University of Technology.
Niu Chen Hui is a third-year graduate student at Lan Zhou University of Technology.