
Abstract
Natural gas is regarded as the main transition energy under the carbon-neutral strategy and its main consumers are Organization for Economic Cooperation and Development countries, accounting for 44.5% of world consumption in 2021. In order to investigate the effects of technology, industry, and regions on natural gas consumption, 12 major Organization for Economic Cooperation and Development countries from three different country groups were selected in this paper to explore the consumption change. Firstly, the Logarithmetic Mean Divisia Index model is adopted to find out the driving factors. Then, the Tapio model is used to consider the decoupling state between natural gas consumption and economic growth. The results can be concluded as follows: (a) From 2000 to 2020, the technological progress effect has the biggest values of −148.86, followed by the industrial structure effect and the regional scale effect, with values of − 37.04 and 29.42, respectively. (b) From the perspective of industry view, these three effects have the largest impact on the secondary industry, followed by the tertiary industry and primary industry; (c) the regional scale effect has a positive effect on most countries, and the industrial structure effect and the regional scale effect have a negative effect on most countries; (d) the decoupling state vary differently in countries with different groups. Therefore, we concluded two policy recommendations for nature gas reduction: (a) Technological innovation is the most effective way for reducing natural gas consumption; (b) Industrial structure optimization can help save natural gas consumption.
Keywords
Introduction
Fossil fuels are an important material foundation for human survival, economic development, and social progress. World's fossil energy consumption was 11.66 billion tons of standard oil equivalents in 2021, with a growth rate of 5.61%, and its structure is dominated by 61.89% of oil. However, the use of fossil energy is one of the main causes of air pollution, which has attracted worldwide attention. Natural gas is proven to cost-effectively reduce the global carbon intensity more easily recently,1,2 so it is widely recognized as the main alternative clean energy. The development and utilization of natural gas has become the focus of the next development in most countries,3–8 and it accounted for 29.68% of fossil energy in 2021, with 40% in 2050, according to British Petroleum (BP) energy outlook 2022 edition. Therefore, the global demand for natural gas will increase significantly, which may bring great changes to the world's energy distribution and demand.
The world's natural gas consumption was 4.037 trillion cubic meters in 2021, and the Organization for Economic Cooperation and Development (OECD) countries consumed 1.794 trillion cubic meters, accounting for 44.46% among them, 9 of which have experienced a complete cycle of natural gas consumption. The natural gas production and consumption of OECD countries accounted for 36% and 53.3% respectively in 2015, 10 and it reached 45.72% and 44.46% in 2020 and 2021, indicating a decline in natural gas consumption. On the other side, Asian countries, especially China, have been the main countries of natural gas consumption recently. Therefore, analyzing the natural gas consumption in OECD countries is of great significance and has good guidance for natural gas decision-makers in China.
Plenty of studies have been focused on the factors affecting natural gas consumption, such as structural decomposition analysis (SDA), Granger causality test, Kaya-Theil model, Logarithmetic Mean Divisia Index (LMDI) model and so on. SDA research needed monetary input-out tables and detailed departmental data, so most of the research using SDA is at a national level, meaning the data collecting limitations on this method.11–13 Granger causality test is regarded as a typical statistical estimation method, so it has the disadvantage of causal relationship analysis.14–16 While the Kaya-Theil model reflects the relatively small change range and direction and it is often combined into the LMDI model. Therefore, the application of the LMDI model is more comprehensive in this research.17–19 LMDI model is a factorization method without residual errors, which is widely applied in environment and resource areas, including land, carbon emission, energy, and water resources.20–24 Therefore, the LMDI model is chosen in this research.
The researches on natural gas consumption factors have quantitative and qualitative researches, which mainly focused on population, economy, environment, region, and policies. While, there was an attempt to investigate three new quantitative effects on natural gas consumption change in this research,25–38 including technology progress, regional scale, and industrial structure effects.
Firstly, we obtained data on natural gas consumption, added value of various industries and GDP from 2000 to 2020 in 12 major OECD countries of three important country groups, including North America (Canada and US), EU and around countries (Germany, France, Italy, Netherlands, Spain, British, Turkey), Australia and Asia countries (Japan and South Korea). Then we chose the LMDI method to study three driving factors, including the industrial structure effect, technological progress effect and regional scale effect. Besides, the decoupling state between GDP and natural gas consumption was also discussed by Tapio decoupling model. Finally, the effective policies for saving natural gas consumption are discussed.
Data and methods
Data
Three types of data from 2000 to 2020 are used, including natural gas consumption, GDP and added value of OECD countries, all of which were from the International Energy Agency, World Bank and BP.
The OECD countries have 38 member countries. In this paper, 12 major countries (the US, Canada, Turkey, Australia, Germany, South Korea, Japan, France, the United Kingdom, Spain, Italy, and the Netherlands) with relatively large proportions of natural gas consumption were selected. From 2000 to 2020, the natural gas consumption of 12 major countries accounted for 85%-90% of all OECD countries (Figure 1).

Natural gas consumption in Organization for Economic Cooperation and Development (OECD) countries between 2000 and 2020.
The total consumption of natural gas in major OECD countries showed an overall upward trend, increasing from 1249 billion cubic meters in 2000 to 1588 billion cubic meters in 2020. Natural gas is mainly distributed in three main industries, which are primary industry, secondary industry, and tertiary industry. Natural gas consumption in the primary industry accounts for only 4%–7% of total consumption, ranging from 7 billion cubic meters to 9 billion cubic meters over the last 20 years. Natural gas consumption in the secondary industry contributes the greatest share, with 60%–70% of the total consumption. While, natural gas consumption is relatively stable in the tertiary industry, with a minimum value of 450 billion cubic meters in 2001 and a maximum value of 510 billion cubic meters in 2019 (Figure 2).

Added value and natural gas consumption of various industries in major Organization for Economic Cooperation and Development (OECD) countries.
Natural gas consumption is related to economics, so Figure 2 shows the added value of three main industries from 2000 to 2020. The added value of the primary industry keeps stable, ranging from 0.37 trillion dollars to 0.65 trillion dollars in the past 20 years. While the added value of the secondary industry and the tertiary industry keep increasing, from 6.26 and 17.71 trillion dollars in 2000 to 9.55 and 34.45 trillion dollars in 2020.
LMDI model in natural gas intensity
The LMDI model, with the advantage of complete zero decomposition,39–43 was used to analyze the driving factors of natural gas consumption in major OECD countries, and technological progress effect, regional scale effect and industrial structure effect are selected as driving factors.
Natural gas consumption indicators could be expressed by absolute quantity and relative quantity. The total consumption of natural gas, or the consumption intensity is defined as the absolute quantity, while natural gas consumption corresponding to the unit economic output is defined as the relative quantity. Previous research has proven that the industrial structure, technological progress, economic growth, policy factors and regional scale could influence the resource utilization efficiency. Through the definition of consumption intensity, we can get the formula:

After analyzing the influence of each effect on consumption intensity, formula (2) can be constructed based on LMDI framework:

Then, we can get the total effect formula of consumption intensity:

Δtot indicates the total effect, showing total consumption intensity change. Δt indicates technical progress effect, meaning utilization efficiency contribution of natural resource by technological progress; Δu is industrial structure effect, meaning industrial structure adjustment contribution; Δv refers to regional scale effect, indicating regional economic output contribution to GDP.
equations (4)–(6) represent the contribution of the three effects:


consumption intensity reduction, and vice versa.
Decoupling model for natural gas change
Although the decomposition model can be used to analyze the factors’ contributions in consumption intensity change, the decoupling state between economy and consumption intensity still can’t be directly analyzed. The Tapio decoupling model is additionally introduced as follows44–46:


Three types of Tapio models.
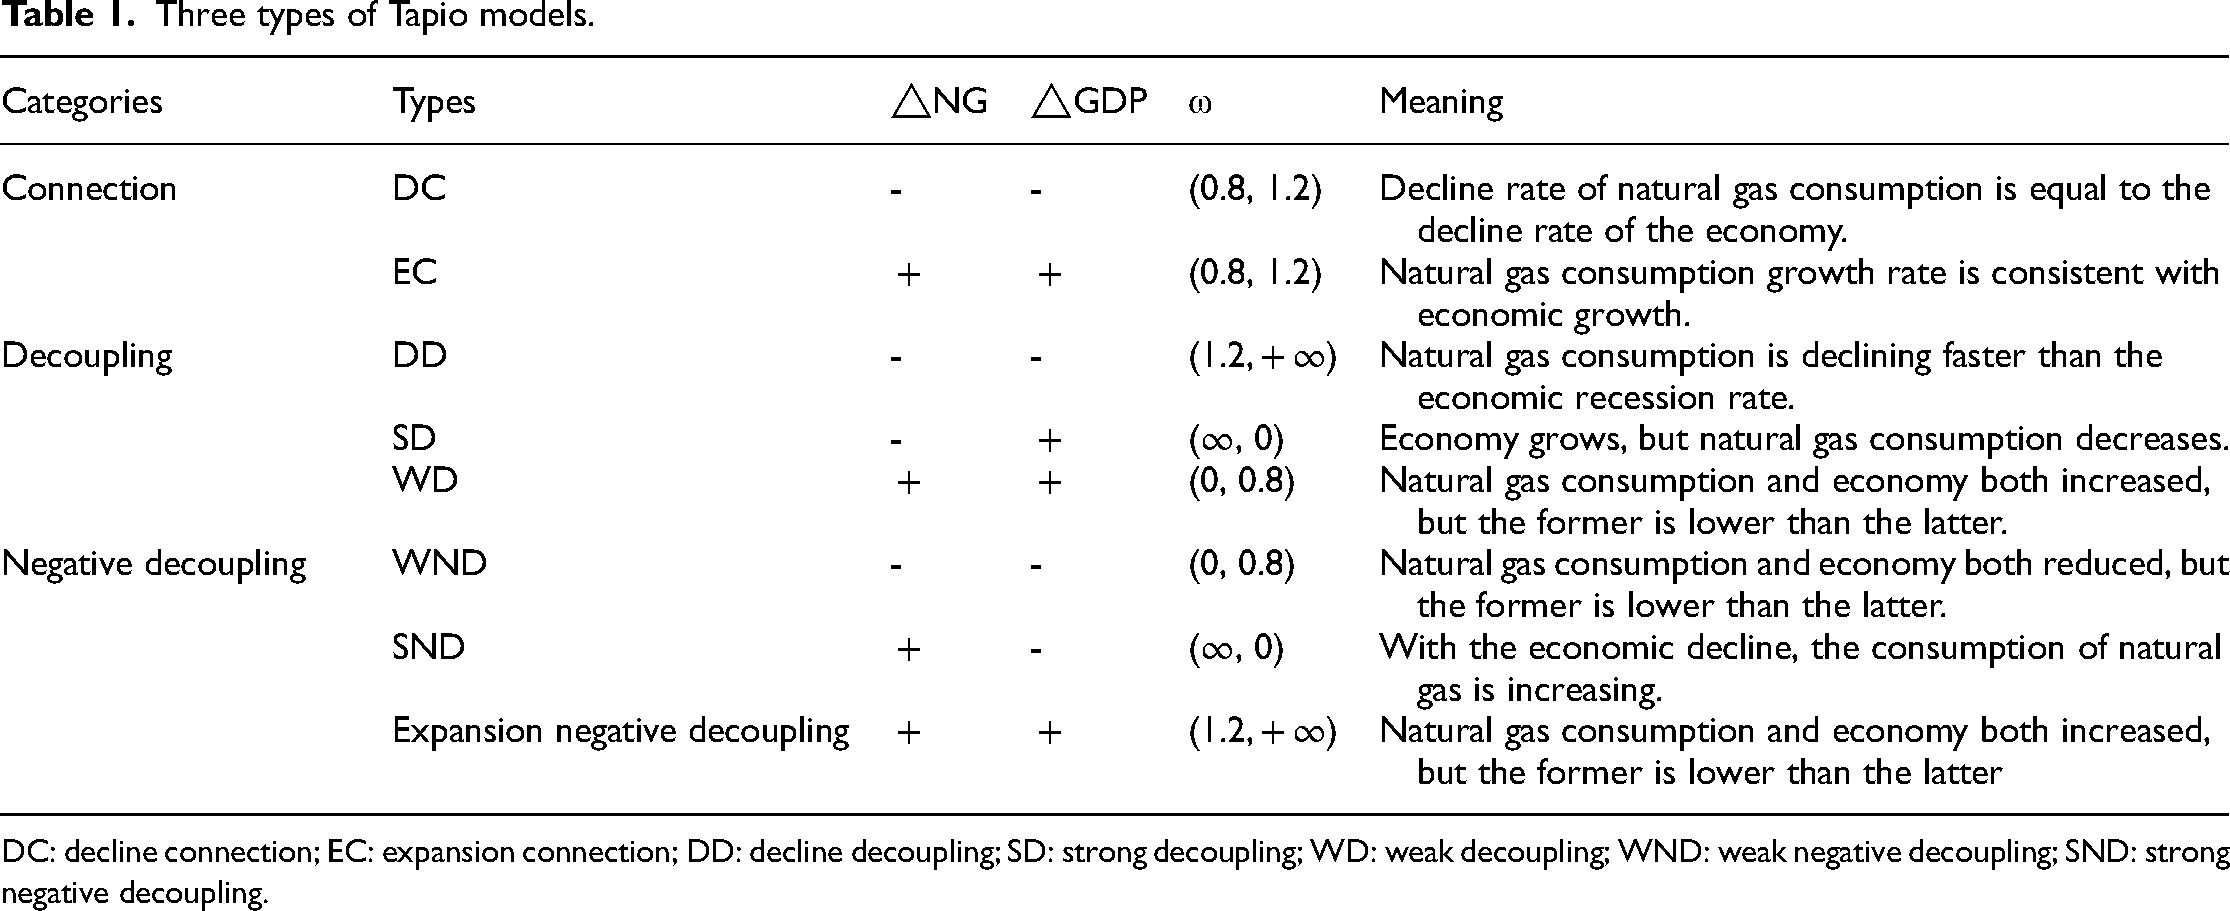
DC: decline connection; EC: expansion connection; DD: decline decoupling; SD: strong decoupling; WD: weak decoupling; WND: weak negative decoupling; SND: strong negative decoupling.
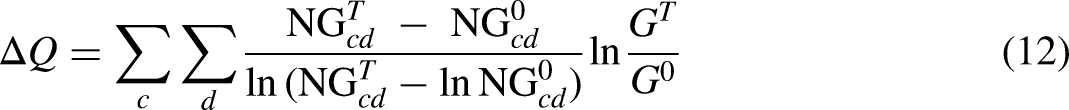
The decoupling relationship between economic growth and natural gas consumption is calculated by the decoupling elasticity index, but this index cannot be used to study specific factors affecting the decoupling state. While LMDI model has the opposite attribute, which can be applied to analyzing the influence of specific factors on natural gas consumption, without a decoupling relationship. Therefore, these two models were combined to get the decoupling effort index model:
Equation (15) is the decoupling effort index: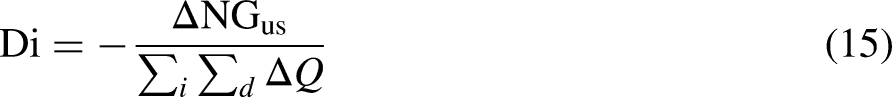
Results
Decomposition analysis of natural gas consumption intensity
Decomposition effects at time dimension
The decompostion effects were displayed in Figure 3. The technological progress effect was negative from 2001 to 2008, meaning consumption intensity was decreasing every year. The contribution rates of the technological progress effect were the largest in the recent 20 years, with the highest contribution rate of 437.27% in 2016, which was mainly responsible for the change in consumption intensity. The industrial structure effect has both positive and negative values, but it contributes most in restraining the consumption intensity growth, which has the lowest value of −13.32 in 2009. The regional scale effect is reaching a maximum value of 9.43 in 2001, but it has gradually decreased in the recent 20 years, indicating the regional scale effect is weakening.

Effects and contribution rates in major Organization for Economic Cooperation and Development (OECD) countries between 2000 and 2020.
The total effect was negative from 2001 to 2008, keeping the same trends with technological effects, indicating the total effect is mainly determined by the technological progress effect. And the biggest decrease is in 2003, with a value of −49.35. Then the total effect gets into a period of oscillatory change after 2009 with both negative and positive values. From 2018, the total effect maintains positive values, which approaches zero. Therefore, the technological innovation needed to be strengthened.
From 2001 to 2008, the negative values of the technological progress effect indicated that it inhibited consumption intensity. The contribution rate of the technological progress effect was the largest in the recent 20 years, with the highest contribution rate of 437.27% in 2016, which was mainly responsible for the change in consumption intensity.
The three effects on each industry in major OECD countries were also explored by the LMDI model (Figure 4). And it shows the impact of the three effects on the secondary industry is more conspicuous than the other two industries.

Decomposition analysis of consumption intensity of various industries in major Organization for Economic Cooperation and Development (OECD) countries from 2001 to 2020.
For the primary industry, these three effects have very little impact on it. The biggest effect on the primary industry is the technical progress effect, which has the biggest value of only 0.25 in 2009 and the smallest value of only −0.54 in 2010. For secondary industry, these three effects have the greatest impact on it. The best inhibition effect appeared in the technical progress effect of the secondary industry in 2003, with values of −35.17, and the best promotion effect appeared in the technical progress effect of the secondary industry in 2015, with values of 22.00. While for the tertiary industry, the technical progress effect achieved the greatest inhibition effect in 2004 with values of −17.81, and the biggest promotion effect in 2013 with values of 7.56.
From the industrial point of view, the three effects have the greatest influence on the secondary industry, followed by the tertiary industry and the smallest is the primary industry. It can be concluded that the technological development of secondary and tertiary industries is the most effective way to slow down the growth of natural gas consumption.
Decomposition effect at spatial dimension
In order to detect the dominant factor and total effect of three effects in each country, the three effects are derived and shown in Table 2, based on equations (3)–(6).
Three effects in major Organization for Economic Cooperation and Development (OECD) countries.
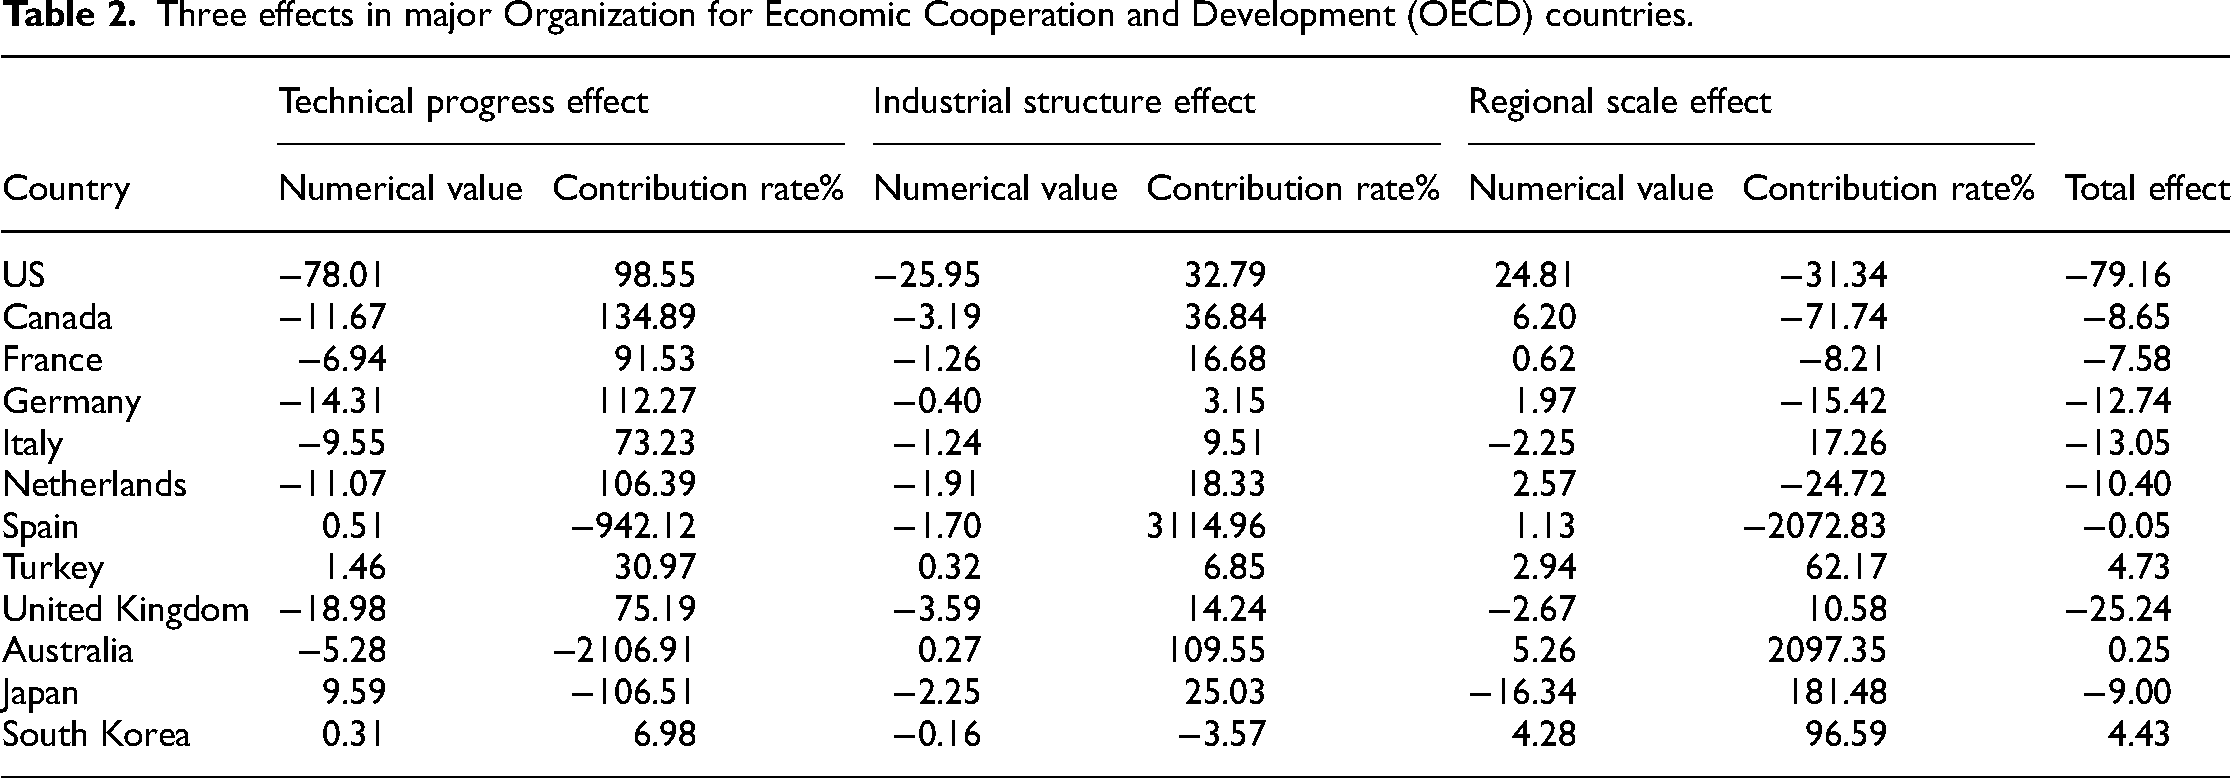
The dominant factor in each country varies among different country groups. In developed countries of Europe, America, and Australia, including the United States, Canada, France, Germany, Italy, Netherlands, and the United Kingdom, they are mainly affected by the effect of technological progress with negative values, indicating that technological progress played a restraining role in natural gas consumption intensity. The greatest effect of technical progress effect is in the US, reaching −78.01. The largest contribution rate is in Australia, although it is only −5.28. But the contribution rate reaches −2107%, which is the only negative effect of the three effects. In Asian OECD countries such as Japan and South Korea, they are mainly affected by the regional scale effect with both negative and positive values.
For the total effect, except for Japan, South Korea and Turkey, all the other OECD countries have negative total effects, indicating that the synthetic action of these three effects restrains consumption intensity. Among them, the biggest value is in the US, reaching −79.16, and the smallest value is in Spain, reaching −0.05. While, the total effect of Japan, South Korea, and Turkey have positive values, indicating a promotion action of three effects in these countries.
Besides, three effects of each industry in each country were conducted through the LMDI model in Table 3.
Effects of each industry in major Organization for Economic Cooperation and Development (OECD) countries.

From the perspective of industry, the three effects have little impact on the primary industry, due to the very minimal amount of natural gas consumption in the primary industry. The maximum value is the technical progress effect in the Netherlands, which is only −0.84.
While for the secondary and tertiary industries, these three effects have distinct trends. For secondary industry, the technical progress effect and industrial structure effect have restrained actions on natural gas consumption intensity with the majority of negative values. And the industrial structure effect on the secondary industry is mostly restrained, and the largest restraining effect is in the US, which is −29.94. However, the regional scale effect of secondary industry is positive, showing that the regional scale effect promotes natural gas consumption. For the tertiary industry, the more developed the economy, the greater the impact of technical progress effect on the tertiary industry. For example, the technical progress effect of the secondary industry in the United States is −58.13, while that in Spain is −0.14. The industrial structure effect on the tertiary industry is all positive, meaning the natural gas consumption has transformed from secondary industry to tertiary industry with increasing intensity. And the industrial structure effect on tertiary industry makes little difference with values between 0.01 and 4.04. The regional scale effect on the tertiary industry is positive in most regions, except for Italy, the United Kingdom, and Japan.
The decoupling effect of the natural gas consumption
Decoupling elasticity index
The decomposition analysis of consumption intensity in major OECD countries between 2000 and 2020 was shown in Table 4 through equations (9)–(12). The elastic indexes of decoupling analysis between economic growth and natural gas consumption in major OECD countries between 2000 and 2020 were investigated and divided into four stages, which were 2000–2005, 2005–2010, 2010–2015, and 2015–2020 in Table 4.
Decoupling the state of natural gas consumption and economic growth in each country.
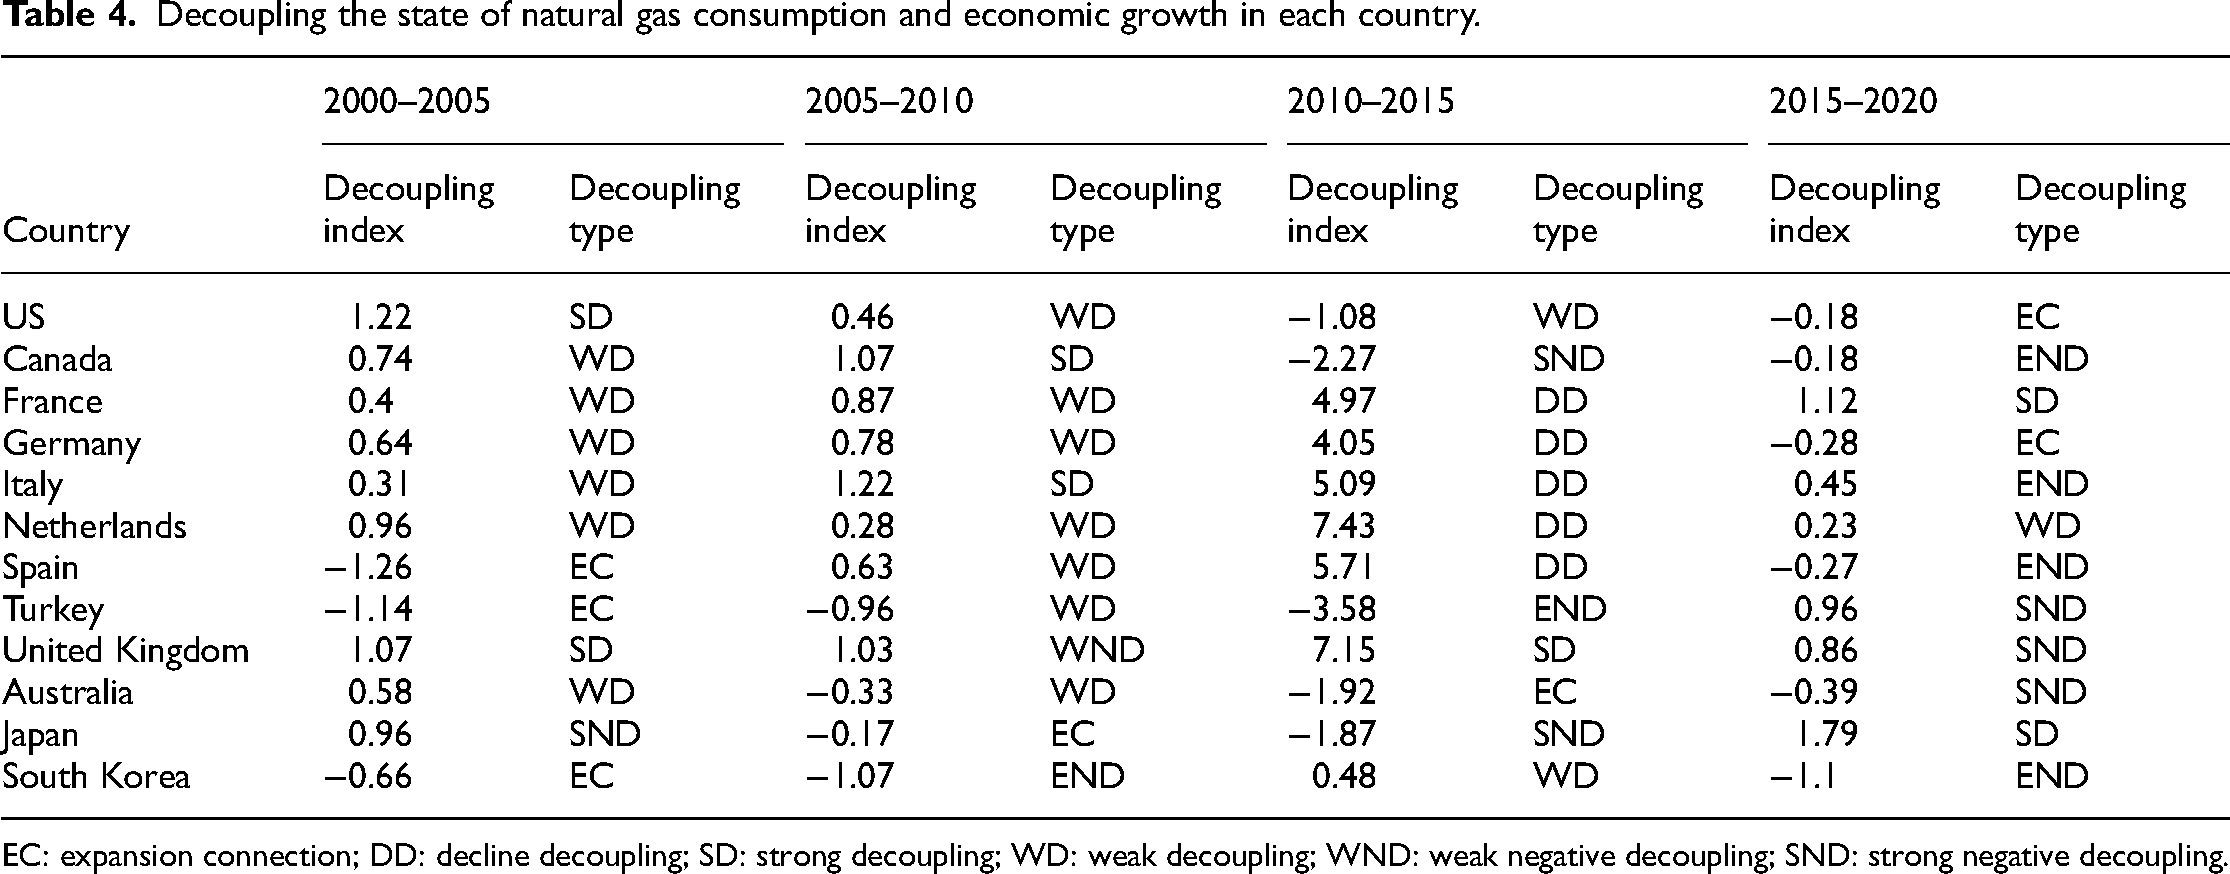
EC: expansion connection; DD: decline decoupling; SD: strong decoupling; WD: weak decoupling; WND: weak negative decoupling; SND: strong negative decoupling.
According to the change trends of decoupling type, the countries in this study can be divided into three groups from the regional point of view. And the transformation of the decoupling type is concluded to be influenced by related policies.
Canada and the United States in North America have experienced a state from decoupling to coupling. For the US from 2001 to 2005, natural gas and economic development were in a state of strong decoupling. In 2006, the shale gas revolution has already transformed the US natural gas market to a continued apace, and the shale gas production proportion increased from 1% in 2005 to more than 40% in 2015.49,50 Therefore, the natural gas consumption and economic development were in a weak decoupling state from 2005 to 2015. In 2017, the US Priority Energy Plan proposed by Trump Administration greatly increased US natural gas production, and the speed of natural gas consumption and economic growth is roughly the same. The decoupling type changed into an expansion connection.
51
The EU countries and the OECD countries around it, including Germany, France, Italy, the Netherlands, Spain, and Turkey have the same change trends of decoupling type. Taking Germany as an example, a weak decoupling state exists until 2010. After 2011, the Nord Stream 1 gradually boosted natural gas consumption with a decline in economics, so Germany was in a state of recession decoupling from 2010 to 2015 and then in a state of expansion coupling from 2015 to 2020.52,53 The OECD countries in Asia are Japan and South Korea. Since the external dependence on foreign natural gas of these two countries is relatively high, the decoupling state is greatly influenced by the natural gas policies of importing countries.
The decoupling relationship between the economy and natural gas consumption in most countries has a trend from decoupling to connection or negative decoupling, showing a pessimistic decoupling state. There are 8 decoupling countries (WD, SD) in 2000–2005, 9 in 2006 −2010, 8 in 2011–2015, and only 3 in 2016–2020. It shows that the overall change of decoupling countries from 2000 to 2015 is not big, but from 2015 to 2020, the number of countries in the decoupling state decreased, indicating the rising trend of overall natural gas consumption.
Overall, the development quality of natural gas resources in developed countries in Europe and America is relatively good, among which the Netherlands and France have obvious development advantages. Secondly, the development quality of natural gas resources in developing countries, and developed countries in non-Europe and America, need to be further improved.
Decoupling effort index
To measure the decoupling state between economic growth and natural gas consumption, we adopted the decoupling effort index (Table 5) in this research.
Decoupling effort index of natural gas consumption between 2000 and 2020.

From the three effects contributions, the greatest influence on the total decoupling effect is the technological progress effect, with an absolute value of 1262.66, but it gradually transits from a negative value to a positive value. Therefore, technical innovation is an important measure to decouple economic development from natural gas consumption, but the current technical conditions are not enough to completely decouple the relationship. Secondly, the industrial structure effect, the absolute value of which is 503.74. Therefore, based on technical innovation, accelerating the transformation of industrial structure is also an important way to decouple economic development from natural gas consumption. The absolute value of the regional scale effect is 228.08.
Conclusion and discussion
In this study, we focus on the driving factors of natural gas consumption intensity in major OECD countries from 2000 to 2020 through the LMDI model, including the technological progress effect, industrial structure effect and regional scale effect. Based on the Tapio model, the decoupling state between natural gas consumption and the economy are also determined. The results show that (a) the Technological progress effect has the largest contribution rate, followed by the industrial structure effect, and the impact of the three effects on the secondary industry is more conspicuous than the other two industries; (b) The OECD countries can be divided into three country groups according to the types of decoupling state, and the decoupling state is closely related to the implementation of policies. (c) The greatest influence on the total decoupling effect is the technological progress effect, with an absolute value of 1262.66, but it gradually transits from a negative value to a positive value.
Therefore, two related policies could be proposed. Firstly, technological progress has the largest contribution rate, so technological innovation is the most effective way for natural gas consumption reduction. However, the technological progress effect transits from a negative value to a positive value, meaning technological innovation should be enhanced to update the current technology. Secondly, the industrial structure effect also contributes largely to natural gas consumption reduction, so large-scale industrial structure optimization is also an effective way for natural gas reduction.
Besides, there are also some problems to be discussed through our further studies. In developed countries with advanced technology, such as the US, the effect of technological progress is relatively small, which can be further analyzed. Besides, the regional scale effect has no significant influence on natural gas consumption, and it needs in-depth discussions.
Footnotes
Declaration of conflicting interests
The authors declared no potential conflicts of interest with respect to the research, authorship, and/or publication of this article.
Funding
The authors received the following financial support for the research, authorship, and/or publication of this article: This research was funded by the National Natural Science Foundation of China, grant numbers: 72088101 and 71991480.
Author biographies
Boyu Du is a master's student of China University of Geosciences (Beijing), his research interest is resource and environment.
Xiaoqian Guo is a deputy researcher and master tutor of the China Academy of Geological Sciences. Her research direction are energy and mineral resources strategy research and evaluation.
Anjian Wang is a a professor and doctor tutor of the China Academy of Geological Sciences. His research interests are energy and mineral resources strategy research, energy and mineral resources prediction.
Hongmei Duan is a professor and master tutor of Chinese Academy of International Trade and Economic Cooperation. Her research direction is resources industry economics.