
Abstract
Electric power system is a major source of CO2 emission in China. Understanding the evolution of power-related CO2 emission is an important step to both emission reduction and a sustainable energy transition. Here, we assess the CO2 emission of power production in China, finding that it increased by 47% from 2008 to 2017 despite a significant decrease in CO2 emission intensity of power production. The CO2 emission intensity of power production differs greatly across provinces, with the highest provincial CO2 emission intensity 11 times the lowest. To understand the evolution of power-related CO2 emission, this study quantified the embodied CO2 emissions of power transmission, and then use decomposition analysis to explore the influencing factors of it. We found that China's embodied CO2 emissions from power transmission increased from 315 to 523 Mt between 2008 and 2017, and the increase in electricity consumption and the dependence on power transmission networks are the important reasons for the increase in embodied CO2 emissions. Nationally, power transmission reduced CO2 emission by 78 Mt. because, compared to the east, the west generally has a larger CO2 emission factor. These dynamics will become important for policymakers and energy planners to achieve carbon neutrality.
Introduction
Since China's reform and opening up, the country has enjoyed rapid economic development followed by an accelerated and continuous urbanization process. Yet this has come at a high cost: high carbon emissions. Indeed, in recent years, China's total carbon emissions have consistently been ranked first in the world. Despite the government's goal of carbon peak and carbon neutrality, China's total energy consumption and CO2 emissions are still increasing year on year. Research on this issue has shown that China is experiencing a geographical mismatch between the power demand in the economically developed east coastal areas and the power production capacity in the less developed inland regions. 1 As a tool to connect upstream power production and downstream power consumption, power transmission is particularly important for China, where the power sector is composed of multiple regional power grids. For this reason, power is frequently traded among China's regional power grids.
The surface temperature of the earth has risen by nearly a degree over the past century, 2 with numerous negative impacts on human health, 3 the ecosystem, 4 and the supply of food, water, and energy.5–7 In response, the international community reached the world's most significant agreement to address climate change (the Paris Agreement) in December 2015, calling for reducing anthropogenic greenhouse gas (GHG) emissions,8,9 particularly CO2 emissions. 10 Thus, China, the world's largest emitter of CO2, contributing 27% of the world's total emissions, 11 has promised to become carbon neutral before 2060, and to reach peak emission before 2030. 12 Currently, energy combustion accounts for 88% of total CO2 emissions in China, and the electric power sector accounts for 41% of CO2 emissions from energy combustion. 13 China's roadmap for carbon reduction heavily relies on the decarbonization of the power sector. 14 Under the warming limit of 1.5 °C, as the most widely used energy type, the power sector needs to spend a lot of costs and resources to achieve complete decarburization by 2050. 15 Understanding the CO2 emission from power production is essential to Chinese and global CO2 emission reduction.
This paper uses the logarithmic mean division index (LMDI) decomposition method to quantify the CO2 emission data for China's provincial level production from 2008 to 2017. This method is widely used in academia to explore the driving factors of embodied CO2 emissions, measure CO2 emissions from electricity transmission over consecutive years, and analyze the driving factors behind them. The findings reveal that China's power transmission still depends on many provinces with high CO2 emission intensity, resulting in an increase in CO2 emissions. However, reducing power production can significantly reduce the total amount of CO2 emissions in most provinces, which to some extent provides unique insights for the current research on CO2 emission reduction in the world. The specific theoretical framework is shown in Figure 1.

The theoretical framework of the influence factors.
Literature review
In China's energy system, interprovincial power transmission is playing an increasingly important role and has grown rapidly in the past decade (1.5 times from 2008 to 2017). 16 However, with the continuous expansion of the scale of transactions, power transmission is having several marked negative environmental impacts from power consumption provinces to power output provinces. At the same time, at the provincial level, there are also great differences in China's energy intensity and structure. Therefore, understanding the differences in provincial power production and related emissions is of great significance for policymakers and regulators to determine the implementation of relevant local and national policies. 17
The academic research on CO2 emissions from power production is quite fruitful, but most studies have focused on the embodied emissions in one or several discontinuous years rather than continuous years. Therefore it is impossible to investigate the changes in embodied CO2 emissions with a more precise time resolution. In addition, the embodied CO2 emissions are also affected by many factors, such as emission intensity, emissions, energy use, and so on.
Duan et al. used the kaya identity to decompose the overall structure of CO2 emissions and established an integrated assessment model to explore the impact of 1.5 °C temperature control requirements on China's CO2 emission reduction. The research shows that the decarbonization of the power sector is of great significance to China's CO2 emission reduction, and under the 1.5 °C temperature control requirements, the implementation cost of China's relevant policies will also increase. 15 Su et al. showed that China's CO2 emission in interprovincial power transmission was 532 Mt in 2012, increasing by 94% compared with 2007. 18 Qu et al. showed that approximately 13% of the total CO2 emission from power production was embodied in interprovincial power transmission in China in 2013. 1 Li et al. indicated that the GHG embodied in the cross-province electricity trade was 607 Mt in 2017. 19 Wang et al. showed that CO2 emission from power production in China increased from 935 to 3511 Mt during the period 1997–2017. 20 Li et al. found that the CO2 emission intensity of China's thermal power differed across provinces in 2016. 10 Magazzino et al. discussed the relationship between economic growth, CO2 emissions, and energy use in Turkey and the Caucasus from 1992 to 2013. The results showed that the increase in energy use is mostly due to the increase in renewable energy use, which does not necessarily increase CO2 emissions, and that the policies related to energy use will not have a significant impact on urban economic growth. 21 Yang et al. discussed the CO2 emission of China's power industry with the help of an LMDI model, finding that economic growth will both increase energy consumption and energy intensity. What's more, improving energy efficiency can also effectively promote CO2 emission reduction in the power sector. 22
Unlike previous studies, the present paper calculates the CO2 emissions generated by electricity in China's provinces in a continuous range. Under the background of increasingly close transmission network connection, to reveal the impact of China's provinces on CO2 emissions, this paper mainly studies the driving factors of CO2 emissions. Thus, relevant conclusions are drawn about urban emission reduction to a certain extent. At the same time, it also provides some unique insights for policymakers and energy planners to help China achieve carbon neutrality as soon as possible.
Methods and data
Methods
CO2 emission from power production
We applied the guidelines of the Intergovernmental Panel on Climate Change (IPCC) to calculate the CO2 emission from power production in year t (Ct) using the following equation
23
:

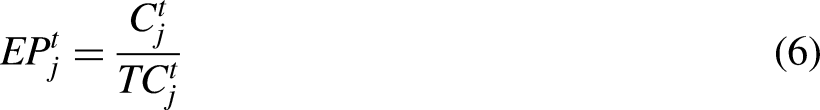
Subsequently, the provincial CO2 emission intensity of power production (EI) can be obtained by dividing the total CO2 emission by the total power production in the province:

Embodied CO2 emissions in power transmission
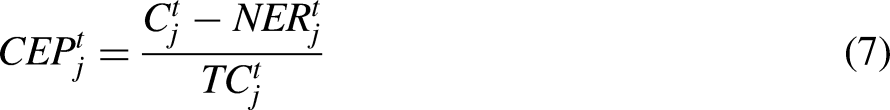
The embodied CO2 emissions across provinces can be estimated by:


Power production is a large CO2 emitter, but its role differs across provinces due to the differences in power-generating technologies. The proportion of the power-related emission (EP) to the total emission is estimated at the province level using:
The descriptive statistics for the relevant data are shown in Table 1.
Descriptive statistics.

Drivers of embodied CO2 emissions in power transmission
To quantify the embodied CO2 emissions, this paper uses LMDI decomposition analysis to explore the driving factors behind it. In 1990, Kaya first proposed the Kaya identity, used by the IPCC,
24
which can be improved using Ang's LMDI decomposition method. Thanks to its advantages of no residual error and strong practicability, decomposition analysis has been widely used to analyze the factors that lead to changes in pollution emissions.25–27 Since there is a value of 0 in the data, this paper adopts the Divisia decomposition method improved by Ang (the variables equal to 0 can be replaced with very small numbers, such as 10−10,
28
while eliminating the residuals)25,26 to decompose the EEi of China's power system to explore the driving factors of implicit CO2 emission:
Ang's
29
research proved that there are production effects, structure effects, and intensity effects in CO2 emission. Therefore, this paper puts forward reasonable assumptions:

According to the LMDI model,
30
changes in the total embodied emissions from 0 period (base period) to t period (report period) can be expressed as:
The decomposition equations for each effect are expressed as follows:


Materials
This study includes 30 provincial-level administrative regions (provinces, autonomous regions, and municipalities). For simplicity, they are referred to as provinces (names and locations are shown in Supplemental Figure 1). The provincial power production and consumption during 2008–2017 were obtained from the China Electric Power Yearbook. The fossil fuel consumption for power production was obtained from the Energy Statistic Yearbook. The related emission coefficients of each energy type were obtained from the IPCC. 23 The interprovincial power transmission during 2008–2017 was obtained from the China Electricity Council. 16 Most of them are provincial-to-provincial power transmission data and can be used directly; a small amount of data are provincial-to-local city transmission data, so we have summed up them at the provincial level. 31 The provincial total CO2 emission was obtained from Shan et al.32,33
However, the calculation method in this paper has some limitations: the inter-provincial transmission volume does not take into account the carbon dioxide emissions reflected in the transmission infrastructure and only involves the CO2 emission data of fuel combustion in the power plant, although it can be high. 34
Results
CO2 emissions and intensities of power production
From Figure 2, it can be found that the CO2 emissions of urban power production in China showed an upward trend from 2008 to 2017, but the CO2 emission intensity decreased steadily. Industrial production is the main source of CO2 emissions. However, in recent years, China has vigorously advocated technological innovation. On the one hand, production technological innovation effectively ensures that industrial enterprises maintain production efficiency. On the other hand, the Chinese government's series of energy-saving policies for the industrial system have also reduced the intensity of CO2 emissions.

Trend chart of CO2 emissions and intensities of power production in China.
Further, by comparing the CO2 emissions of power production in provincial-level cities in China in 2008 and 2017 (Figure 3), it can be found that the central and western provinces have changed dramatically in the past decade, and the CO2 emissions of power production in some provinces have even changed to several times that of 10 years ago. Since most of the power production emissions of these provinces are used to transmit power to other provinces, the increase in power demand in the eastern region has exacerbated the power production burden of central and western provinces. For example, in Inner Mongolia, Xinjiang, and other places in 2017, the total CO2 emissions from power production in the province even reached more than 50%.

CO2 emission of power production in China in 2008 and 2017.
In terms of CO2 emission intensity, this paper summarizes the CO2 emission intensity of 30 provinces in China (Figure 4). It is not difficult to see that, although China's overall CO2 emission intensity has decreased within the study range, the CO2 emission intensity of power production in each province is also quite different. For example, the emission intensity of Yunnan decreased significantly (–84%), while Guangxi was the only province where the emission intensity increased ( + 2%). In 2017, the emission intensity of power production in Yunnan Province was the lowest (83 gCO2/kWh), while that in Inner Mongolia was the highest (905 gCO2/kWh). We statistically analyzed the relative standard deviation of emission intensity for each province and found that the total relative standard deviation increased from 30% to 39% from 2008 to 2017. The CO2 emission intensity of China's power production is extremely uneven.

CO2 emission intensities of power production in China.
CO2 emission embodied in power transmission
Interprovincial power transmission increased rapidly, from 0.4 in 2008 to 1.1 (103 TWh) in 2017. Xinjiang did not export electricity in 2008 but exported large amounts (44 TWh) in 2017. In addition to the increased amount of transmission, the coverage of the transmission network also expanded. During 2008–2017, the number of large power transmission corridors (more than 1 TWh/year) increased from 46 to 66. Consequently, the CO2 emission embodied in interprovincial power transmission increased from 315 to 523 Mt. The number of large, embodied CO2 emission transmission corridors (more than 1 Mt/year) increased from 42 to 58. Nationally, the average emission intensity of power transmission decreased from 741 to 512 g/kWh. Inner Mongolia was the largest exporter of embodied CO2 emissions both in 2008 (95 Mt) and 2017 (139 Mt) (Figure 5). In contrast, Hebei was the largest importer of embodied CO2 emissions both in 2008 (46 Mt) and 2017 (61 Mt) because it imported electricity from Inner Mongolia, Shanxi, and Shaanxi, where CO2 emission intensities were relatively high (larger than 600 gCO2/kWh). The largest corridor of embodied CO2 emissions was Inner Mongolia–Henan in 2008 (33 Mt) and Inner Mongolia–Liaoning in 2017 (41 Mt). Despite their large amounts of power export, Yunnan and Sichuan provinces exported limited embodied CO2 emissions because they mainly exported hydropower. Guangdong was the largest power importer, but its imported CO2 emission was not the largest because it mainly consumed the hydropower from Yunnan province.

CO2 emissions embodied in interprovincial power transmission in 2008 and 2017.
Impact of power transmission on provincial CO2 emission
The power transmission network changes provincial CO2 emissions. We examined the impact of power transmission on CO2 emission with the value of the power-to-total ratio (PTT), which is the ratio of CO2 emission of power production to the total provincial emission. We assessed the present and counterfactual PTT in 2017. At present, in Inner Mongolia and Ningxia, approximately 60% of the provincial emission is from power production (Figure 6). Power transmission exacerbates issues when the PTT is larger at present than in the counterfactual scenario where there is no power transmission network and thus a province does not import power but satisfies the local demand by producing power itself. Our results show that CO2 emission was slightly more unequally distributed through power transmission. The relative standard deviations of provincial PTT (from 37.5% to 38%) increased due to power transmission. The impact of power transmission on CO2 emission differs across provinces. Without a transmission network, Inner Mongolia could reduce emissions by 137 Mt. In contrast, Guangdong increased emissions by 97 Mt. If Beijing and Shanghai were to satisfy their power demand themselves, they would see an increase in emissions of 28% and 26%, respectively. Because of the differences in emission intensity in the power-exporting and -importing provinces, present power transmission reduced CO2 emission by 78 Mt compared with the counterfactual scenario.

Present and counterfactual PTT in 2017.
The changing trend of CO2 emission driving factors in power transmission
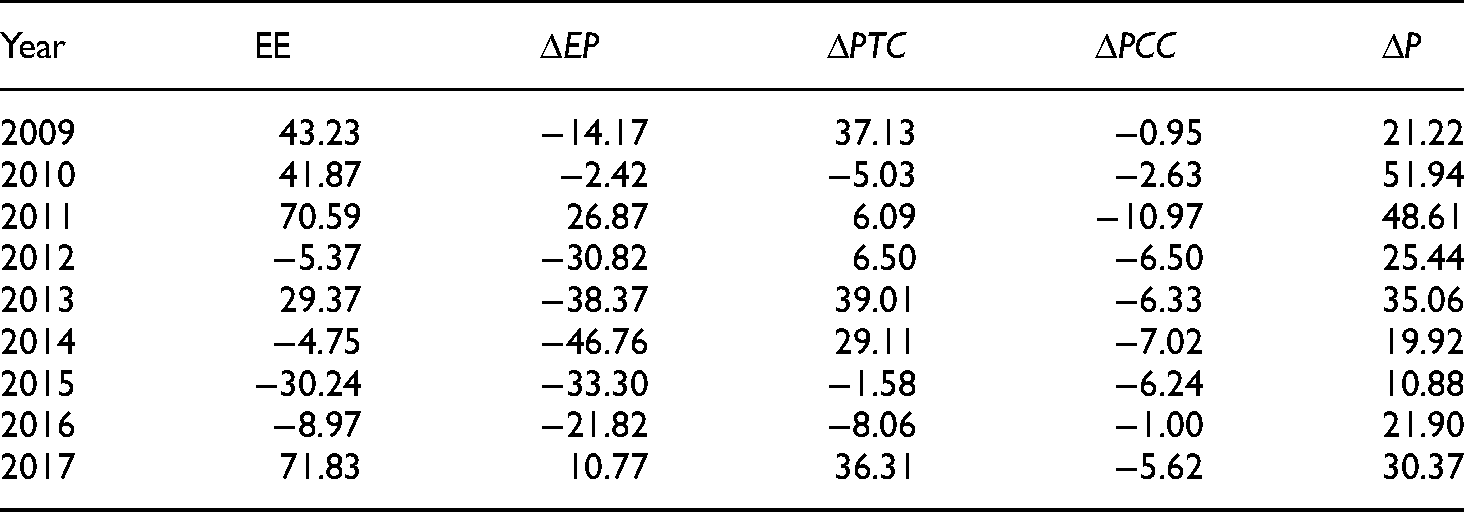
Table 2 shows the increment of various factors of specific CO2 emissions at the national level from 2008 to 2017. It can be seen from the table that during the study period, the expansion of China's power consumption was the main driving factor for the increase in actual CO2 emissions. At the same time, the dependence on the transmission network usually leads to an increase in emissions. This is due to the high dependence of eastern regions of China on power imports from the midwest regions, increasing overall CO2 emissions. It is worth noting that in 2011 and 2017, China's CO2 emission intensity factor turned positive, resulting in an increase in total carbon dioxide emissions. This is because, in July 2011 and January 2017, China carried out the first and third batches of low-carbon city pilot projects, respectively. As these two batches of pilot projects involve a wide range of urban angles and areas, energy consumption and CO2 emissions increased in the initial stage of implementation of the policy.
Summary of decomposition factor increment of the embodied CO2 emission.
To make the data more observable, this paper further draws the change decomposition diagram of embodied CO2 emissions (Figure 7). It is not difficult to see that the main factor causing the change in embodied CO2 emissions is the change in CO2 emission intensity. Due to the demands of production, consumption, infrastructure construction, and other aspects, these eastern provinces generally have a large demand for electricity. Therefore, the power demand of such provinces has a great impact on China's overall CO2 emissions and emission intensity.

Decomposition of the changes in embodied CO2 emissions during 2008–2017.
Discussion
The role of power transmission in the low-carbon energy transition
China has issued a series of policies to reduce CO2 emissions at the provincial and national levels. Fairness is an important issue that requires much attention and needs to be adequately addressed before implementing emission-reduction actions. For most provinces, power production is mainly for meeting the demand of other provinces. The western provinces convert resources (e.g. fossil fuels, hydro-energy) to electric power and export it to support development in the east, increasing emissions and the pressure for emission reduction in the west. Issues will arise if only the local power demand is considered when reducing CO2 emissions. For example, Inner Mongolia can reduce CO2 emissions by 22% by curtailing power production to only meet the local demand (Figure 7). In that case, however, the provinces (Beijing, Hebei, Liaoning, Shandong, Tianjin) that rely on the power from Inner Mongolia would face power gaps.
Power transmission promotes the development of low-carbon renewables in the west and allows this power to be transmitted to where power is needed, reducing CO2 emission on the national scale. However, the emission reduction is not significant because, currently, the main power exporters are the provinces with a high capacity in coal power. Wind and solar power are low-carbon technologies, but they have not played the main roles in China's energy system because of low efficiency and high curtailment compared to other technologies. To meet the increasing power demand in the east, power transmission is expected to increase. 35 The future impacts of power transmission on CO2 emission depend on the further development of low-carbon energy in the power-exporting provinces, for example, wind and solar in Inner Mongolia and hydropower in Yunnan province. 36
Limitations and implications
Mi et al. 37 measured the leading and lagging cities in energy emission reduction through the climate change index and found that industrial structure was the decisive factor to distinguish a city from a leading city. Therefore, there is likely to be an intrinsic relationship between emissions in power transmission and regional climate change mitigation performance. This is also the limitation of this paper.
The increasing power consumption and the dependence on power transmission indicate that reducing the emission intensity is the only way to reduce CO2 emission. Shifting fossil-fuel-fired power to renewables (e.g. wind, solar, and hydropower) is an effective approach. However, the curtailment of renewables in the west is high because of the low local demand. Further construction of power transmission corridors for renewables can facilitate the development of renewables and the reduction of CO2 emissions. Our results show that reducing power production can significantly reduce the total CO2 emission for most provinces. However, the power reduction of a certain province can affect the power supply of others via the power transmission network.
Comparison with previous research
Compared with the previous literature, the focus of this paper is different. Hu et al. pointed out that, from 1995 to 2014, the alternative energy efficiency of fossil fuel power generation in China was low, and the efficiency of imported power transmission alternative fuel power generation was much higher than alternative energy. From the perspective of alternative energy types, the supply of alternative energy in China's regional power grid has increased, which has led to a rebound of 10–50% in fossil fuel power generation consumption. Due to the strong demand for imported power transmission, China's CO2 emissions have increased to a certain extent. 38 Wang et al. mainly analyzed the difference in CO2 emissions from power production in China's provinces during 1997–2017. 20 Li et al. studied the inter-provincial difference in CO2 emission intensity of China's thermal power in 2016. 10 Our results show that the difference in emission intensity among provinces has increased from 2008 to 2017, and the relative standard deviation has increased from 30% to 39%. Unlike previous studies that have evaluated specific emissions in a year or over several years, based on state-of-the-art transmission data, our results show that specific emissions increased by 66% between 2008 and 2017. We further studied the driving factors of realizing specific CO2 emissions through power transmission and found that the current power transmission still depends on many provinces with high emission intensity, resulting in an increase in CO2 emissions.
Conclusions and policy recommendations
Since the reform and opening up, China's economy has developed rapidly and has gradually shifted from a planned economy to a market economy. However, this rapid economic development has also led to the economic gap between developed and underdeveloped regions in China widening. As the most widely used energy type in the world, electric energy can not only empower urban development but also lead to an increase in urban CO2 emissions due to its extensive production mode. The transmission network is an important means of energy allocation among provinces to meet the energy demand of provinces with weak resource endowments. At present, most of China's power output provinces are concentrated in the central and western provinces, while the input provinces are concentrated in the southeast coastal provinces. The economic strength of the central and western provinces is generally weaker than that of the southeast coastal provinces. However, to support the development of the eastern provinces, such provinces are still overproducing electricity to support the eastern provinces while meeting their power demand, which has increased their CO2 emission burden to a certain extent. Therefore, optimizing and improving China's power transmission network has great practical significance for China's urban CO2 emission reduction.
This study has evaluated the CO2 emissions of China's provincial power production from 2008 to 2017, as well as investigating CO2 emissions and driving factors embodied in cross-provincial power transmission with the help of the LMDI decomposition method.
Three key results were found. First, nationwide, although the emission intensity of power production decreased significantly during the whole period, from 2008 to 2017, the rapid growth of inter-provincial transmission led to an increase of 47% in CO2 emissions from power production, and the proportion of CO2 emissions from power production in some provinces even exceeded 50% of the total emissions.
Second, the power transmission network meets the power demand of some provinces, but at the same time intensifies the difference in CO2 emission intensity between power input and output provinces. At the same time, the CO2 emission intensity of power production in different provinces varies greatly, and the relative standard deviation increased from 30% to 39% from 2008 to 2017.
Third, increased electricity consumption and reliance on the transmission network have led to an increase in embodied CO2 emissions. Nationwide, power transmission has reduced CO2 emissions by 78 Mt, because compared with the east, the west usually has a larger CO2 emission factor, showing a general trend of power transmission from the west to the east. Although most of these provinces can significantly reduce local CO2 emissions by reducing power generation, considering the power demand of developed provinces in the east, reducing power production may affect the power supply of transmission networks in other provinces, leading to the power supply of the transmission networks not being reduced.
Based on the above research conclusions, this paper puts forward the following policy recommendations.
First, the central and western regions need to optimize and improve the high-voltage transmission network. Through research, the Federal Energy Regulatory Commission (FERC) of the United States found that thanks to its advantages in the long-distance transmission of electric energy, high-voltage transmission lines can efficiently transmit a large amount of clean energy, such as wind energy and solar energy, to areas with large power demand, and improve the utilization rate of carbon-free energy to a certain extent. In recent years, China's renewable energy has developed rapidly. However, because the development speed of new energy in some provinces is far faster than its actual demand, a large number of “wind and power abandonment” phenomena have occurred in China, especially in northwest China. The establishment of a high-voltage line transmission network would not only help these provinces to absorb excess power and to optimize and improve the power transmission platform based on new energy but would also relieve the pressure of CO2 emissions caused by traditional energy transmission.
Second, the eastern region needs to accelerate the research and development of low-carbon and zero-carbon technologies and reduce their dependence on the transmission network in the central and western regions. The central and western regions, such as Inner Mongolia, Yunnan, and other places, have great transmission pressure. Due to technical limitations, these regions still use more traditional methods to produce electric energy, which consumes more energy. If the power transmission for the eastern region continues, it will not only be difficult for the local technology to break through but will also entail more serious CO2 emissions. Therefore, in the eastern region, China should give full play to the advantages of location and resource endowment, focus on the development of renewable energy technology, and focus on promoting the power substitution industry to reduce power demand.
Supplemental Material
sj-docx-1-sci-10.1177_00368504221137466 - Supplemental material for The influence factors of interprovincial power transmission on China's CO2 emissions
Supplemental material, sj-docx-1-sci-10.1177_00368504221137466 for The influence factors of interprovincial power transmission on China's CO2 emissions by Wenchao Li, Lingyu Xu and Yi Jin in Science Progress
Footnotes
Author contribution
Wenchao Li: conceptualization, funding acquisition, project administration, supervision. Lingyu Xu: writing—original draft. Yi Jin: data curation, formal analysis.
Declaration of conflicting interests
The authors declared no potential conflicts of interest with respect to the research, authorship, and/or publication of this article.
Funding
The authors disclosed receipt of the following financial support for the research, authorship, and/or publication of this article: This work was supported by the National Natural Science Foundation of China (Grant Nos. 71704067 and 71974078).
Supplemental material
Supplemental material for this article is available online.
References
Supplementary Material
Please find the following supplemental material available below.
For Open Access articles published under a Creative Commons License, all supplemental material carries the same license as the article it is associated with.
For non-Open Access articles published, all supplemental material carries a non-exclusive license, and permission requests for re-use of supplemental material or any part of supplemental material shall be sent directly to the copyright owner as specified in the copyright notice associated with the article.