
Abstract
Given the increasing interest in keeping global warming below 1.5°C, carbon emissions reduction has become a hot topic. However, the regional disparities and the driving factors were not paid enough attention. This article established an indicator to describe the catch-up effort of different regions and proposed a temporal-spatial production-theoretical decomposition model using meta-frontier and global-frontier to capture the driving forces of the catch-up effort of different provinces to benchmarking provinces. The new model was applied to analyze China's regional carbon emissions during 2007 to 2018. The main findings from the empirical study are: (1) Overall, the regional carbon emissions and their spatial variation kept increasing during the study period. (2) Economic activity, potential carbon factor, carbon-abatement technology efficiency and regional carbon-abatement technology gap were the main drivers. (3) The improvement efforts of carbon-abatement, energy-saving technical efficiency, and potential energy intensity were the dominant factors inhibiting the growth of carbon emissions. (4) The improvement efforts of advanced technology and potential energy intensity helped to reduce the regional gaps, but their impacts varied considerably across regions in China.
Keywords
Highlight
A temporal-spatial production-theoretical decomposition model (TS-PDA) is proposed for regional carbon emissions.
The new model considers regional heterogeneity and production process.
The impact of the catch-up effect related to technology factors can be captured based on meta-frontier and global frontier.
The model was applied to study China's regional emissions during 2007 to 2018.
Introduction
Recently, given the increasing interest in keeping global warming below 1.5°C, carbon emissions reduction has become a hot topic for countries across the world. As the largest CO2 emitter, China has pledged to control its CO2 emissions as a binding development and economic target at the Paris Climate Conference in 2015, set a target to peak emissions before 2030, and become carbon neutral before 2060. However, China is still at the stage of rapid urbanization and industrialization, which has resulted in rapid CO2 emissions growth. Figure 1 indicates that the production sectors have remained the largest carbon emitters, and they had faster growth than the household sector. It is also projected that the production sectors, especially the manufacturing industry, will be the main emitter in the foreseeable future.1,2

China's CO2 emissions from different industries, 2007–2018.
Identifying the effects of the production-related factors is of great significance for China to reduce CO2 emissions and reach the peak earlier. Furthermore, it will be of great significance to select benchmarks for provinces and regions in China and detect what and how the drivers affect the gap between provinces and benchmarks, then, some effective energy-saving and carbon reduction policies can be proposed accordingly. However, due to the unbalanced distribution of resource endowment, economic scale, industrial structure, and development speed in different regions of China, there is significant regional heterogeneity in the characteristics of carbon emissions. Therefore, it is necessary to consider the regional heterogeneity in identifying the key drivers, which could help governments formulate targeted regional emission reduction measures in accordance with the characteristics of different regions.
At the same time, a great number of studies have focused on reducing carbon emissions from the provincial and regional dimensions.3,4 The decomposition analysis method was widely used to explore the influencing factors of the change in carbon emissions, because it can decompose a comprehensive factor, such as carbon emissions or total energy consumption, into several meaningful driving factors.5,6 At present, the common decomposition analysis methods mainly include structural decomposition analysis (SDA), index decomposition analysis (IDA), and production-theoretical decomposition analysis (PDA).
Specifically, SDA is the earliest proposed decomposition analysis method,7,8 and is based on theinput–output model (I/O tables).9–12 Because the SDA model requires too much data, which is difficult to collect and update, the IDA model proposed by Ang and Zhang 13 is widely used by many scholars. 14 Compared with SDA, IDA has some advantages, such as the data collection being easier, the calculation methods being more diverse, and the calculation results being more precise. However, neither IDA nor SDA considers the impact of the production process, which is inconsistent with reality, and it cannot provide production information. In this context, the PDA model was proposed by combining the advantages of IDA, data envelope analysis (DEA) and production technology, 15 and it has been widely used by many scholars in recent years.16–17 Consequently, PDA can detect the contribution of relevant factors in the production process to carbon emissions change, such as technical efficiency change and technological progress.
Traditionally, most of the previous studies calculated the distance under the assumption of a unified production technology frontier. However, due to the differences in the economic foundation, industrial structure, resource endowments, and location, the provinces in China have significant heterogeneity.18–22 In general, the provinces have different technology levels. Therefore, it may enlarge the distance between the study objects and the best practice frontier when modeling the production technology frontier applies a unified production technology frontier.
Thus, the effect of drivers decomposed by PDA may be misidentified. Recently, an increasing number of studies have focused on the issues of regional heterogeneities in efficiency assessment and driver identification (shown in Table 1). However, to the best of our knowledge, few studies have focused on the carbon emissions change and its driving factors from temporal and spatial perspectives simultaneously, and taken regional heterogeneities into consideration.
Review of studies on China's energy and carbon efficiency assessment or driver identification using meta-frontier DEA.

It is popular to detect drivers of the change in carbon emissions from the perspective of temporal decomposition analysis and spatial decomposition analysis. The former focuses on the assessment over time in a single country or more than one country. It can be divided into two categories: single-country temporal analysis and multicountry temporal analysis. Generally, the multicountry temporal analysis can consider the regional difference in carbon emissions by directly comparing the single-country temporal decomposition results. This method is becoming more popular because it can perform a comparative analysis of drivers in different regions.33–35
Spatial decomposition analysis is a comparative analysis method to compare regional differences in carbon emissions or energy consumption. Specifically, it compares each region indirectly after comparison with a benchmarking region, which can ensure the comparability between different regions.36,37 This method can accurately rank and evaluate the performance and potential for emission reduction in different regions. The embryonic form of spatial decomposition analysis was first proposed by Ang and Zhang, 38 and Ang et al., 39 further classified the spatial decomposition model into bilateral-region (B-R), radial-region (R-R) and multi-region (M-R) models. Among them, the M-R model usually selects the average of all regions as the benchmark region and has many advantages, such as being more objective and easily calculated. Therefore, it has become a more popular decomposition form in recent years.40–42 Obviously, the strategy of benchmark selection is a vital issue for the spatial decomposition method. Ang et al. put forward two basic strategies of benchmark selection, existing region, and hypothetical region. Both strategies assume that the regions to be studied and the benchmark region are homogeneous, which is not consistent with reality and may cause a biased assessment.
It is worth noting that drivers contributing to the performance gaps between different regions in a specific year are evaluated in traditional spatial decomposition analysis, while drivers contributing to performance gaps between different years in a specific region are evaluated in traditional temporal decomposition analysis. More information will be provided if the drivers contributing to both the spatial differences and temporal developments are captured simultaneously. Therefore, combining the temporal analysis and spatial analysis into one unified procedure to trace the changes in regional disparities over time, that is, a spatial-temporal analysis framework, occurred rapidly.43,44 However, the effects of production-related factors on the regional disparities of carbon emissions over time have not been studied in the literature. In fact, some production-related factors, such as the carbon emissions efficiency change, energy utility efficiency change, and technological progress, play important roles in carbon emissions change.
Despite the aforementioned progresses in the decomposition literature, some gaps exist. First, most previous studies have focused on temporal decomposition analysis, while spatial decomposition and temporal-spatial decomposition have rarely been studied. The preceding shows that spatial decomposition can directly reveal the disparities between regions, which is of use to identify the best practices in mitigating emissions at the regional level. Second, while SDA and IDA are more common in previous studies, spatial decomposition using PDA has been less explored. Compared to SDA and IDA, the key advantage of PDA lies in its capacity of capturing the effect of production-related factors. Third, most of the previous studies measured the effects of technology and efficiency with respect to a common production frontier, which nevertheless ignores the technology heterogeneity among provinces in China. Such measurement may be biased, and it is thus necessary to set different production frontiers for regions according to their technical characteristics.
This study aims to fill these gaps by detecting the drivers of carbon emissions of different regions in China and focusing on the production-related factors while considering the regional heterogeneity. In this context, we first develop a refined PDA model based on the meta-frontier and global-frontier techniques that are widely used to characterize the regional heterogeneity. The proposed model can capture the change in the carbon emissions gap between a specific entity and a benchmark entity and further decompose it into 11 determinants. A number of meaningful drivers, for example, technological progress-related factors and technology gap-related factors, can be captured. Furthermore, the catch-up effort of a specific entity and the catch-up effort of a specific group are captured simultaneously. A change in the carbon emissions gap can thus be decomposed into two levels from temporal and spatial dimensions. The results are expected to offer detailed insights into the carbon emissions disparities among China's provinces.
The remainder of this article is organized as follows. The second section presents the model, data source and variables. The third section depicts the decomposition results. The fourth section shows the main conclusion and discusses some policy implications.
Methodology
The production technology and distance function
Production technology
To explore regional heterogeneity, this article constructs production technology from a regional perspective. Specifically, we consider energy consumption (E), capital (K). and labor (L) as inputs and gross national products (Y) and CO2 emissions (C) as desirable and undesirable outputs. Suppose that j provinces will be evaluated. Moreover, due to the heterogeneity of provinces in different regions, we further divide the j provinces into m groups according to regional differences. Then, the production technology of the jth province in the mth group can be defined as formula (1): The desirable output (Y) and undesirable output (C) are weakly disposable, that is, if Desirable and undesirable outputs are null-joint, that is, if 
With these characteristics, according to previous studies,47,48 the production possibility set can be modeled as formula (2) based on DEA with assumption of constant returns to scale (CRS):
However, it is difficult to control the overall technical efficiency changes in the production frontier of a single province, especially when the phenomenon of technological retrogression occurs. Therefore, according to the definition of global Malmquist index by Pastor and Lovell,
49
this article constructs a production possibility set based on the meta-frontier and global-frontier as formulas (3a) and (3b):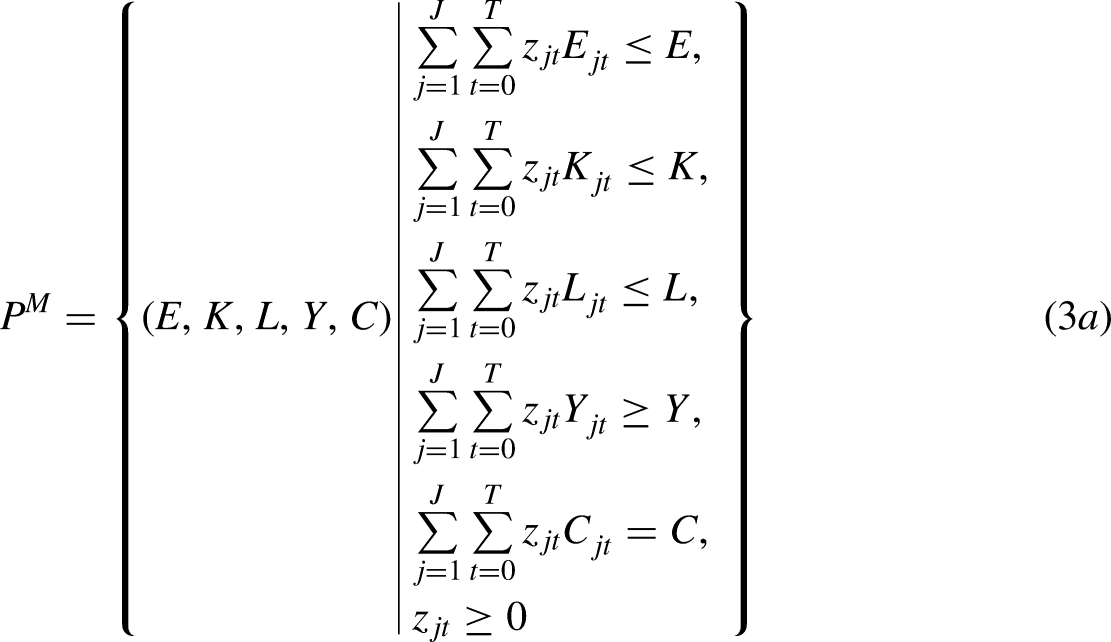

Among them, the PM represents the production performance of the provinces in all study periods in a group. PG represents the production technology performance of all provinces in all regions in all study periods.
The distance function and the estimation models
According to Meng et al.,
50
distance function models have become more and more popular because of their relatively strong discriminating power and capability to expand desirable outputs and reduce undesirable outputs simultaneously. The distance between the production frontier and the particular entity can be evaluated by the Shephard distance functions. The distance functions of energy consumption (E) and emission (C) can be described as formulas (4a) and (4b):


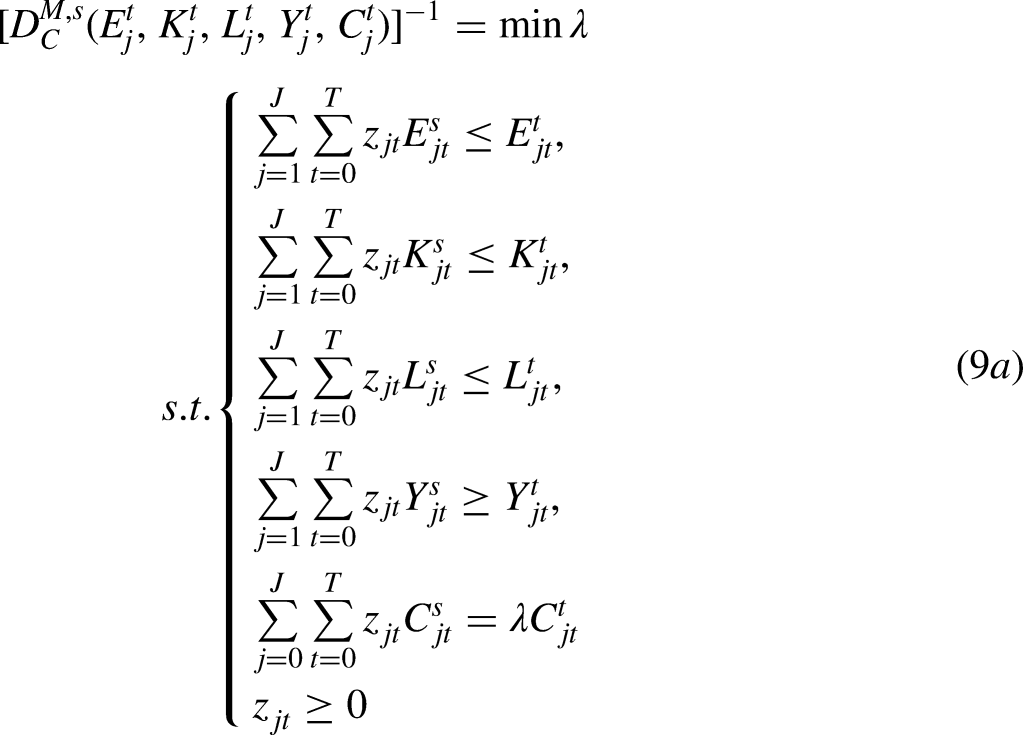
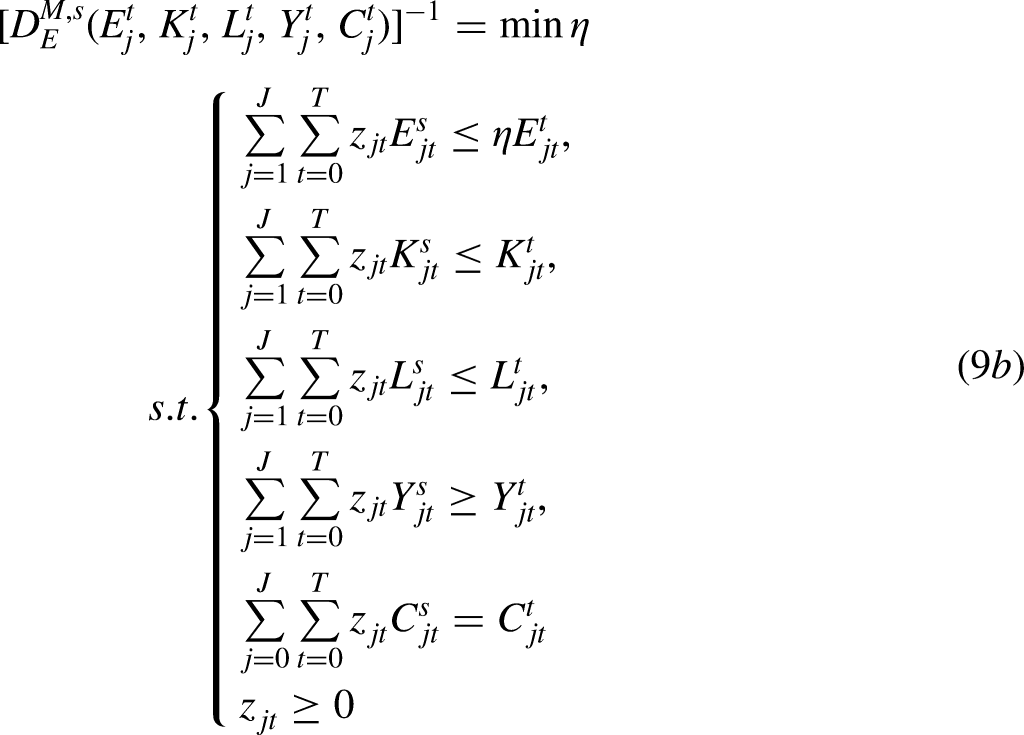
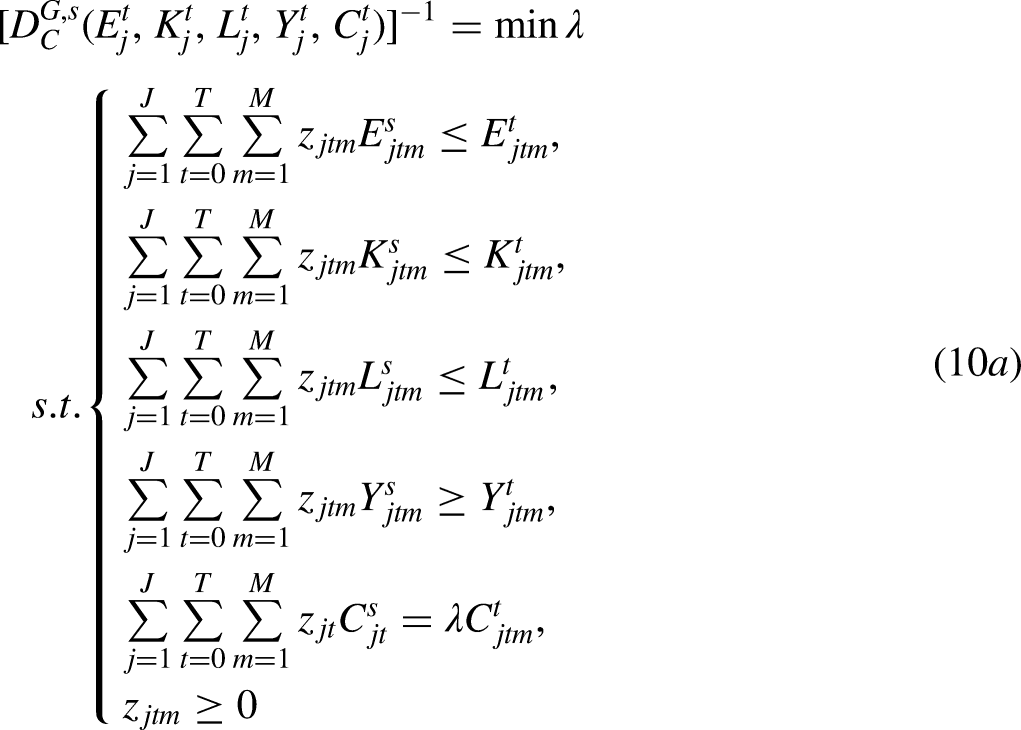
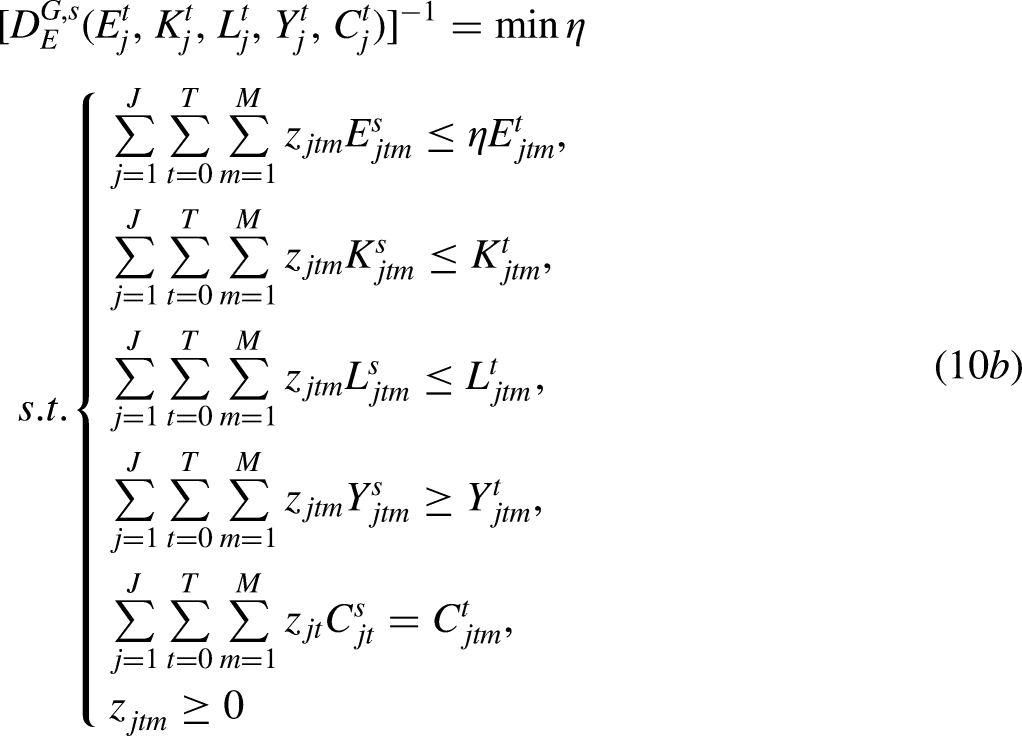
Determinants of carbon emissions are affected by the heterogeneity among production entities in the patterns of energy use and carbon emissions because of the significant differences in regional resource endowment, production technology levels, and industrial structure. To control regional heterogeneity, this article introduces the meta-frontier and global-frontier concepts to measure the distance of each entity from the frontier. The distance functions under the meta-frontier and global-frontier are expressed as formulas (7a–7b) and (8a–8b):


The decomposition model
This article explores the driving forces of changes in carbon emissions. Based on the Kaya identity, the total carbon emissions can be decomposed as in formula (11):
Based on the PDA basic model proposed by Zhou and Ang, this article further introduces a regional carbon emissions decomposition model considering the meta-frontier and global-frontier. Specifically, the different provinces j(i = 1,2…. J) in different regions can be divided into groups m (m = 1,2…. M), which takes into account regional heterogeneity. And the decomposition results are of more practical significance. The change of carbon emissions of province j in region m can be decomposed into formula (12):
According to the spatial decomposition analysis method proposed by Su and Ang, the carbon emissions gap between province j and benchmark can be expressed as formula (13).

Data sources
We collected data for 30 provinces in China (excluding Hong Kong, Macau, Taiwan, and Tibet because of a lack of data) from 2007 to 2018 from the China Energy Statistics Yearbook and the National Bureau of Statistics of China. According to previous literature, we selected energy consumption (E, in 104 t of standard coal), capital stock (K, in 108 RMB), labor (L, in 104 persons) as input, carbon emissions (C, in 104 t) as undesirable output and GDP (Y) as desirable output. The specific methods of collection and calculation are as follows:
Input variable: This article selects seven types (including coal, coke, crude oil, gasoline, kerosene, diesel oil, and fuel oil) of energy consumption (E) in different sectors of China from the energy balance tables in the China Energy Statistics Yearbook. Labor (L) is measured by the number of people employed at the average of the beginning and end years. Capital should be calculated by formula (15) following Wang and Feng
51
and Li et al.: Output variable: The GDP data come from National Bureau of Statistics of China. To eliminate the influence of price volatility, we use the producer price index to convert the real GDP into the benchmark year. In addition, according to the estimation method proposed by IPCC, we calculated carbon emissions as formula (16).

Results and discussion
Temporal decomposition results
Temporal decomposition results at the regional level
To explore the direct impact of various factors on carbon emissions, this article analyzes the average temporal decomposition results of 2007 to 2018. Figure 2 compares and analyzes the temporal decomposition results of China overall and the three major regions of eastern, central, and western China during 2007 to 2018. As presented in Figure 2(e), the values of CRjt,0 of eastern, central and western China were >1 during 2007 to 2018, which indicates that the carbon emissions in China were still increasing continuously from 2007 to 2018, and the western region has the fastest growth rate of 10.68%.

Cumulative temporal decomposition results for China, 2007–2018.
The cumulative effect of most factors on carbon emissions growth in the three regions of eastern, central, and western China is similar, but the changing trend of its effect is different. Figure 2 shows the cumulative temporal decomposition results from 2007 to 2018 in China. As shown in Figure 2(a), the cumulative effect of economic activities (EA), carbon-abatement technology efficiency (CEEF), regional carbon-abatement technology gap (RCTG), and technological progress of energy-saving (ETCH)was >0, indicating that they will promote the growth of carbon emissions in China. In contrast, the cumulative time decomposition effect of potential energy intensity (PEI), and carbon-abatement technical efficiency improvement effort (CTIE)from 2007 to 2018 was <1, which is the main factor inhibiting the growth of carbon emissions.
In addition, the effects of driving factors on carbon emissions in different regions are also different. Figure 2(b)–(e) shows the difference in the cumulative impact of carbon emissions in the eastern, central, and western regions from 2007 to 2018. Figure 3 further shows the differences in the change trends of different factors over time in three major regions. As shown in Figures 2 and 3, economic activities (EA) had the largest positive effect on carbon emissions growth in all regions during the entire observation period. This conclusion is similar to some previous studies.2,6,43 Specifically, the cumulative effect of increasing carbon emissions was 9.90% for China during 2007 to 2018. However, the contributory effect on carbon emissions growth by economic activities (EA) decreased after 2011. Specifically, the contributory effect of economic activities (EA) constantly decreased in eastern and western regions, while keeping stable after 2014 in central regions. Meanwhile, potential carbon factor (PCFC) and carbon-abatement technology efficiency (CEEF) had contributory effects on increasing carbon emissions in most years, and the cumulative effects were 1.0576 and 1.0453, respectively. In addition, the values of ETCHRjt,0 in the central, eastern, and western regions were larger than 1 during the entire observation period. This means that the technological progress of energy-saving technology still should be improved in all regions of China, which is still the main factor leading to the growth of carbon emissions. Furthermore, the influence of technological progress of carbon-abatement (CTCH) on carbon emissions fluctuates greatly. In some years, it can promote the growth of carbon emissions, and in recent years (2015–2018), it can inhibit the growth of carbon emissions. It also should be focused on in the future.

Temporal decomposition results over time for regions in China, 2007–2018.
We should pay attention to the fact that the innovative factor of the regional carbon-abatement technology gap (RCTG) proposed in this article had a larger contributory effect on the growth of carbon emissions. The cumulative effect of the regional carbon-abatement technology gap (RCTG) was 1.0938 and 1.0386 in the central and western regions, respectively. Moreover, its promotion effect in the western and central regions increased first then decreased, reaching a peak in 2009 to 2011. Specifically, the regional carbon-abatement technology gap (RCTG) in 2009 to 2010 led to a 53.36% increase in carbon emissions in the central and western regions, but this factor can reduce carbon emissions in the eastern regions. However, the effect of the regional energy-saving technology gap (RETG) on carbon emissions in all regions is not obvious.
Conversely, similar to previous literature,20,23,27 the potential energy intensity (PEI) is an important contributor to reducing carbon emissions. In particular, as a new variable proposed in this article, the carbon-abatement technical efficiency improvement effort (CTIE) has the most obvious inhibitory effect on the growth of carbon emissions. The cumulative decomposition results of 2007 to 2018 in the eastern, central, and western regions were 0.9095, 0.9646, and 0.9268, respectively. Specifically, this factor led to a reduction in carbon emissions in the eastern regions during 2007 to 2018. However, it is unstable in the central and western regions. For the central region, the carbon-abatement technical efficiency improvement effort (CTIE) promoted the growth of carbon emissions in 2008 to 2010. For the western region, this factor has also become a contributing factor to the growth of carbon emissions in the past 3 years. Furthermore, the energy-saving technical efficiency improvement effort (ETIC) contributed to carbon emissions growth except in 07–08, with less impact in other years.
Temporal decomposition results at the provincial level
Figure 4 shows the cumulative effect of carbon emissions and drivers from 2007 to 2018. Similarly, from the provincial perspective, the carbon emissions and the most driving factors of carbon emissions in 30 provinces of China have the same impact. Specifically, the carbon emissions in 30 provinces increased during the observation period except in Beijing. As presented in Figure 4, the values of EARjt,0 were >1 in all provinces, which means that the economic activities (EA) had increased carbon emissions in all provinces, especially in Shandong, Tianjin, Chongqing, and Jiangxi. Similarly, technological progress of energy-saving (ETCH) can increase carbon emissions in all provinces, especially in Hainan (22.47%). In addition, the potential carbon factor (PCFC) promoted the growth of carbon emissions in 29 provinces except for Shannxi. In addition, the values of CEEFRjt,0 were >1 except in Tianjin, which means that only Tianjin had better carbon-abatement technology efficiency during 2007 to 2018. In contrast, Xinjiang had the worst carbon-abatement technology efficiency, and the carbon-abatement technology efficiency (CEEF) led to a 33.0% increase in carbon emissions in Qinghai during 2007 to 2018. In addition, the cumulative decomposition values of RCTGRjt,0 were equal to 1 in all provinces in the eastern region during 2007 to 2018, and the cumulative values were >1 in all provinces in the central and western regions except Guangxi. This means that the regional carbon-abatement technology gap (RCTG) had a promoting effect on the growth of carbon emissions in most provinces. However, the effects of the regional energy-saving technology gap (RETG) and energy-saving technology efficiency (EUEF) on increasing carbon emissions in different provinces are inconsistent. For technological progress of carbon-abatement (CTCH), the cumulative decomposition value of 24 provinces is >1 except for Beijing, Zhejiang, Liaoning, Shanxi, Shaanxi, and Xinjiang provinces. This may be because these six provinces have continuously updated and improved the efficiency of carbon emissions reduction technologies in the past 10 years. The good performance of technological progress has helped them to have lower growth of carbon emissions.

Cumulative temporal decomposition results for provinces in China, 2007–2018.
Similarly, for some factors that inhibit the growth of carbon emissions, the different provinces have similar effects. For the potential energy intensity (PEI), the cumulative decomposition results of the 28 provinces from 2007 to 2018 are all >1 except for Ningxia and Xinjiang provinces. Among them, Yunnan, Tianjin, Hunan, and Guizhou had the best emission reduction effects, which can reduce carbon emissions by 7.75%, 6.32%, 6.31%, and 6.17%, respectively. The energy-saving technical efficiency improvement effort (ETIE) can help reduce carbon emissions in 29 provinces except for Shaanxi. This indicates that most provinces of China have the consciousness of promoting energy-saving technology. Similarly, the average value of CTIERjt,0 in 27 provinces of China during 2007 to 2018 was >1 except for Shannxi, Shanxi, and Hunan. This means that most provinces of China have an awareness of efforts to improve carbon-abatement technology, which is of great help to reduce carbon emissions.
Cumulative temporal-spatial decomposition results
Analysis of the cumulative temporal-spatial decomposition results of carbon emissions
Figure 5 shows the average temporal-spatial decomposition results of carbon emissions in 30 provinces from 2007 to 2018. The decomposition results represent the difference between the carbon emissions of each province and the average carbon emissions of the region where the province is located. If the value of TS_CRjt,0 was >1, it means that the province will lead to an increase in average carbon emissions in the region at the 0-t period, or to say, the province has poor carbon emissions reduction performance relative to the benchmark. Similarly, if the values of TS_CRjt,0 were all <1, the province would lead to a decrease in the average carbon emissions in the region during the observation period.

Average temporal-spatial decomposition results for China, 2007–2018.
As shown in Figure 5, for the eastern region, the high growth of carbon emissions in Hainan is the main reason for the higher level of carbon emissions, which led to a 21.74% increase of carbon emissions. Meanwhile, Shandong and Liaoning also increased the average carbon emissions of the eastern region by 3.01% and 2.85%, respectively. In addition, Beijing, Shanghai, and Zhejiang have relatively good carbon emissions reduction performance, far better than the average level in the eastern region (−7.84%, −4.23%, −4.05%). For the central region, the average value of TS_CRjt,0 in Hunan during 2007 to 2018 was 1.2174, which indicates that Hunan led to an increase of 21.74% in average carbon emissions in the central region. In the future, this province is the primary carbon emissions reduction target. For the western region, the higher carbon emissions of Shaanxi, Qinghai, and Xinjiang are the main reasons leading to the average higher carbon emissions. The average values of TS_CRjt,0 during 2007 to 2018 in Shaanxi, Qinghai, and Xinjiang were 1.1190, 1.0646, and 1.0524, respectively.
Analysis of the cumulative temporal-spatial decomposition results of drivers
Figures 6 and 7 further show the average temporal-spatial decomposition results of the main driving factors on carbon emissions in 30 provinces of the three regions from 2007 to 2018. As shown in Figure 6, the main reason for the large difference in carbon emissions in the eastern region is that technological progress of energy-saving (ETCH), carbon-abatement technical efficiency improvement effort (CTIE), carbon-abatement technology efficiency (CEEF), potential carbon factor (PCFC) affects the large spatial difference. And the effect of carbon-abatement technical efficiency improvement effort (CTIE), the regional carbon-abatement technology gap (RCTG) in the central region is very different. The influence of most factors varies greatly except economic activities (EA), regional carbon-abatement technology gap (RCTG) and energy-saving technology efficiency (EUEF) for the western region.

Average temporal-spatial decomposition results for drivers in different provinces of China, 2007–2018.
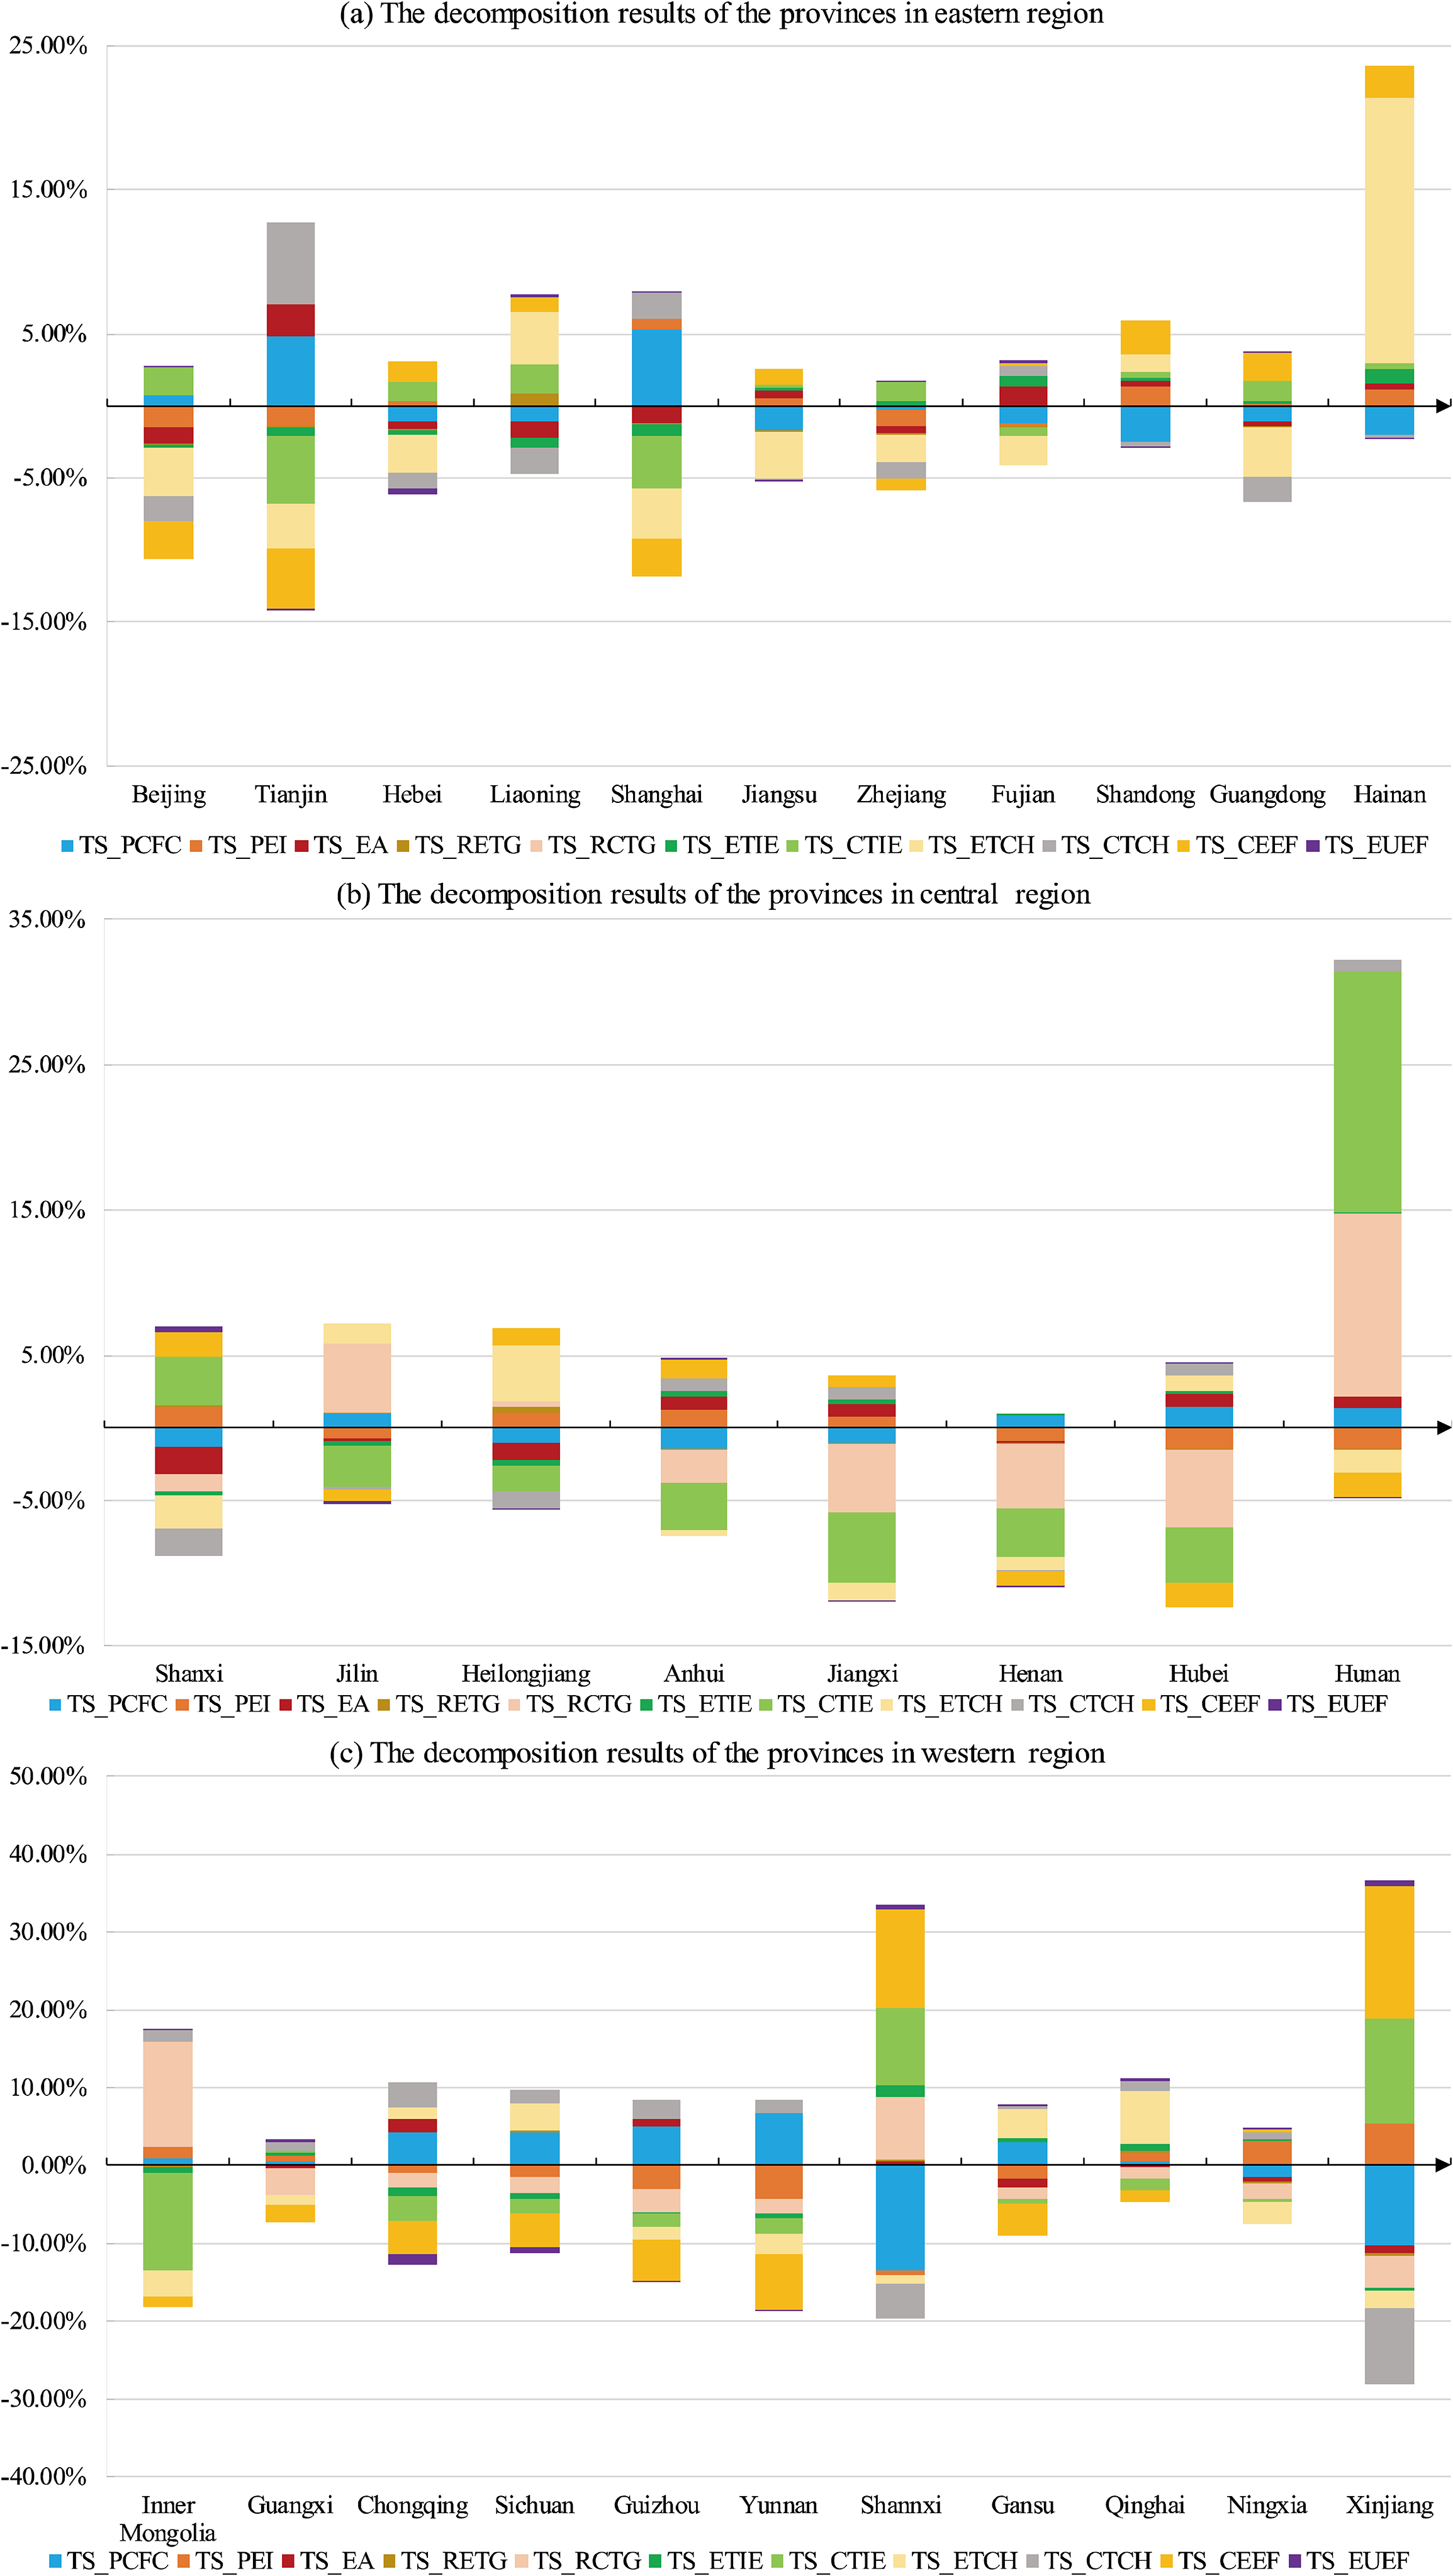
Average temporal-spatial decomposition results for provinces within China's regions, 2007–2018.
For the eastern region, we should focus on the causes of high carbon emissions in the Hainan, Shandong, and Tianjin provinces. Additionally, the excellent carbon emissions reduction performance of Beijing, Shanghai, and Zhejiang provinces should be an example to learn from. Specifically, the average temporal-spatial decomposition results of the technological progress of energy-saving (ETCH), carbon-abatement technology efficiency (CEEF), the potential energy intensity (PEI), energy-saving technical efficiency improvement effort(ETIE), regional carbon-abatement technology gap (RCTG), and carbon-abatement technical efficiency improvement effort (CTIE) in Hainan province were all >1, which means that these factors were all less effective in reducing carbon emissions in Hainan province during 2007 to 2018, which will lead to an increase in the average carbon emissions in the eastern region. And the poor performance of the technological progress of energy-saving (ETCH) is the main reason for Hainan's higher carbon emissions than the eastern average, which will lead to an 18.41% increase in average carbon emissions in the eastern regions. This may be due to the province's lack of attention to the improvement of technical efficiency. In addition, the regional carbon emissions reduction effects of Tianjin, Shanghai, Shandong, and Liaoning provinces in the eastern region are not satisfactory. Specifically, the average values of TS_PCFPRjt,0, TS_EARjt,0, and TS_CTCHRjt,0 in Tianjin were >0, and the decomposition results of technical efficiency-related factors such as carbon-abatement technology efficiency (CEEF), carbon-abatement technical efficiency improvement effort (CTIE), and technological progress of energy-saving (ETCH)in Tianjin were <0, showing good carbon emissions reduction performance. For Shandong and Liaoning, the average temporal-spatial decomposition results of carbon-abatement technology efficiency (CEEF), the potential energy intensity (PEI), technological progress of energy-saving (ETCH), and carbon-abatement technical efficiency improvement effort (CTIE) were >1, which requires further improvement.
For the central region, we should focus on the causes of high carbon emissions in Hunan and Shaanxi provinces. Additionally, the excellent carbon emissions reduction performance of Jiangxi, Hubei, Henan, and Anhui provinces should be an example to learn from. For Hunan, the values of TS_RCTG and TS_CTIE were far >1, which caused the province to increase by 16.89% and 19.92% more than the average carbon emissions in the central region. Conversely, the situation in Jilin and Hunan is the opposite. Except for the regional carbon-abatement technology gap (RCTG), carbon-abatement technical efficiency improvement effort (CTIE), and technological progress of energy-saving (ETCH), other factors have not performed well in reducing carbon emissions in Jilin. For Shanxi, the temporal-spatial decomposition values of carbon-abatement technical efficiency improvement effort (CTIE), carbon-abatement technology efficiency (CEEF), regional carbon-abatement technology gap (RCTG), and the potential energy intensity (PEI) were all >1, which is the main reason that promotes the growth of regional carbon emissions. On the other hand, in some provinces with good regional carbon emissions reduction performance, such as Henan, Hubei, Jiangxi, and Anhui provinces, the values of TS_ETCH and TS_CTIE were all <0, which indicates that these factors had a positive effect on reducing the carbon emissions.
For the western region, we should focus on the causes of high carbon emissions in Shaanxi, Xinjiang, and Qinghai. Additionally, the excellent carbon emissions reduction performance of Yunnan, Guizhou, and Guangxi should be a good example to learn from. For Xinjiang, the temporal-spatial decomposition values of carbon-abatement technology efficiency (CEEF), carbon-abatement technical efficiency improvement effort (CTIE) and the potential energy intensity (PEI) were far >1, which caused an increase in average carbon emissions in the western region by 20.79%, 15.66%, and 6.52%, respectively. Similarly, carbon-abatement technology efficiency (CEEF) and carbon-abatement technical efficiency improvement effort (CTIE) in Shaanxi also had poor carbon emissions reduction performance. In addition, the regional carbon-abatement technology gap (RCTG) and energy-saving technical efficiency improvement effort (ETIE) of Shannxi will also lead to the growth of the average carbon emissions in the western region. For Qinghai, the temporal-spatial decomposition values of carbon-abatement technical efficiency improvement effort (CTIE), carbon-abatement technology efficiency (CEEF), regional carbon-abatement technology gap (RCTG) and the potential energy intensity (PEI) were all >1, which is the main reason that promotes the growth of regional average carbon emissions. On the other hand, some provinces have good regional carbon emissions reduction performance, such as Yunnan, Guizhou, and Guangxi provinces. These provinces have a common feature, that is, the carbon-abatement technology efficiency (CEEF), carbon-abatement technical efficiency improvement effort (CTIE), technological progress of energy-saving (ETCH), and the potential energy intensity (PEI) factors have better performance. However, the values of TS_PCFC and TS_CTCH were >0 and should also be considered.
Conclusions and policy recommendations
To explore the regional heterogeneity of drivers on carbon emissions of China, this article constructs a refined PDA model based on the meta-frontier and global-frontier. This model divides 30 provinces of China into three regions with different benchmarks and different frontiers, and it can explore the drivers and regional differences of carbon emissions change in China. The decomposed factors include the factors that are related to technology, such as the carbon-abatement technology efficiency, the energy-saving technology efficiency, the potential carbon emissions factor, the potential energy intensity, the carbon-abatement technology efficiency, and so on. Based on the data of China from 2007 to 2018, the change in carbon emissions can be decomposed into 11 drivers, which include some new meaningful drivers, such as the catch-up effect of technology-related factors, the technological gap-related factors, the improvement efforts of technology-related factors, the technological progress-related factors, and so on. The main conclusions are as follows:
The carbon emissions kept increasing in China and each region during the observation period. The western region had the fastest growth rate of carbon emissions, increasing by 10.68% from 2007 to 2018. From the perspective of provinces, the carbon emissions of all the provinces of China are increasing except Beijing. Among them, Xinjiang and Hainan have the fastest growth in carbon emissions. The temporal decomposition results show that economic activity (EA), potential carbon factor (PCFC), carbon-abatement technology efficiency (CEEF), and regional carbon-abatement technology gap (RCTG) are the main contributors to increasing carbon emissions for the whole country. However, the effect of the regional carbon-abatement technology gap (RCTG) on increasing carbon emissions was fluctuant in recent years, reaching a peak in 2010–2011. In recent years, the regional carbon-abatement technology gap (RCTG) can even reduce carbon emissions. In addition, the technological progress of carbon-abatement (CTCH) and energy-saving technology (ETCH,) will also promote the growth of carbon emissions, but its effect fluctuates greatly. Therefore, its cumulative effect during the observation period is not obvious. Conversely, the improvement efforts of carbon-abatement and energy-saving technical efficiency (CTIE and ETIE) and potential energy intensity (PEI) are the dominant factors inhibiting the growth of carbon emissions. From the regional perspective, the dominant drivers of different regions are significantly different. The factors that dominate the growth of carbon emissions in the eastern region are potential carbon factor (PCFC), economic activity (EA), technological progress of energy-saving (ETCH), and technological progress of carbon-abatement (CTCH), and the driving factors that dominate its carbon emissions reduction are carbon-abatement technical efficiency improvement effort (CTIE) and energy-saving technical efficiency improvement effort (ETIE). For the central region, the poor carbon emissions reduction performance of the regional carbon-abatement technology gap (RCTG) and the potential carbon factor (PCFC) are the main cause of the high carbon emissions of the region. The carbon-abatement technology efficiency (CEEF) is the main cause of poor carbon emissions in the western region. The regional temporal-spatial decomposition results show that provinces in different regions have different contributions to the regional average carbon emissions changes and regional disparities. The high carbon emissions in Hainan province are the main reason for the growth of average carbon emissions in the eastern region. And Hainan province has led to an increase in average carbon emissions in the eastern region of 23.3%. Specifically, the technological progress of energy-saving (ETCH) and carbon-abatement technology efficiency (CEEF) are the main contributing factors promoting carbon emissions growth and regional differences in Hainan province. In addition, we also should pay attention to the economic activity (EA), technological progress of carbon-abatement (CTCH) and potential carbon factor (PCFC) of Tianjin on the growth of carbon emissions. Conversely, some economically developed regions such as Beijing, Shanghai, and Zhejiang had great carbon emissions reduction performance, especially in technological progress of energy-saving (ETCH), carbon-abatement technology efficiency (CEEF) and EA factors. For the central region, Hunan and Shanxi have poor carbon emissions reduction performance. Specifically, the regional carbon-abatement technology gap (RCTG), carbon-abatement technology efficiency (CEEF), and other carbon emission technology efficiency factors are the main drivers promoting the carbon emissions growth and regional differences in Hunan province. Conversely, Hubei, Anhui, and Jiangxi have a positive effect on reducing the average carbon emissions and regional differences in the central region. For the western region, the high carbon emissions of Xinjiang and Shannxi lead to the high average carbon emissions and regional differences of the western region. Specifically, carbon-abatement technical efficiency improvement effort (CTIE) and carbon-abatement technology efficiency (CEEF) are the main reasons to promote the spatial difference in carbon emissions growth in Xinjiang and Shannxi Provinces. In the eastern region, the main factors affecting the growth and regional differences of carbon emissions are potential carbon factor (PCFC), economic activity (EA) and technological progress of carbon-abatement (CTCH), and carbon-abatement technical efficiency improvement effort (CTIE)is the main factor that reduces carbon emissions. Therefore, for the eastern region, which has high carbon emissions and high economic output, it is necessary to coordinate the relationship between economic development and the growth of carbon emissions by optimizing the economic structure. Meanwhile, it is necessary to continue strengthening the awareness of efforts to improve the efficiency of carbon emissions reduction technology, and further ensure the continuous progress of carbon-abatement technology. Specifically, it could develop high-value-added manufacturing and modern service industries to improve the economic structure and increase the investment of scientific research to develop advanced technologies and improve efficiency. In addition, we should raise carbon emissions reduction awareness and strive to improve carbon-abatement technology. Specifically, the region can further spread the applications of new energy, such as electric vehicles, photovoltaic power generation and solar energy systems, and further guide residents to form green habits to reduce carbon emissions. In the central region, the regional carbon-abatement technology gap (RCTG) has the largest contributory effect to increasing the growth and the regional differences of carbon emissions, and carbon-abatement technical efficiency improvement effort (CTIE)and the potential energy intensity (PEI) have the main effects to reduce carbon emissions. Therefore, for the central region which is dominated by heavy industry and manufacturing provinces (such as Shanxi and Hunan), it is necessary to optimize the energy structure, and further strengthen the catch-up degree of the regional optimal technology efficiency in carbon-abatement. Specifically, we can reduce the dependence on coal products and increase the consumption of renewable energy gradually. In the western region, the carbon-abatement technology efficiency (CEEF), regional carbon-abatement technology gap (RCTG) and technological progress of energy-saving (ETCH)have the contributory effects to increasing the growth and regional differences on carbon emissions, and carbon-abatement technical efficiency improvement effort (CTIE), energy-saving technical efficiency improvement effort (ETIE)have the great role on reducing carbon emissions. It can be seen that the western region is trying to raise its awareness of improving the efficiency of carbon-abatement and energy-saving technology, and it has also made efforts for it. However, these efforts cannot improve the efficiency of advanced technology. The effect of carbon-abatement technology efficiency (CEEF), regional carbon-abatement technology gap (RCTG) the technological progress of energy-saving (ETCH) on reducing carbon emissions is not obvious. Therefore, for the western region, we should pay more attention to the ways and methods of improving the efficiency of advanced technology, and further ensure that all efforts to upgrade technology are effective. Specifically, the government should provide financial and other support policies to attract large enterprises to stay in western regions, and the western region should apply the eastern region's advanced technology on a large scale to improve carbon emissions reduction performance. On the one hand, developed regions with scientific research capabilities should focus on developing more energy-efficient and renewable utilization technologies. On the other hand, underdeveloped regions can promote economic development and further enhance the scale and profits of high-tech enterprises.
According to the above conclusions, we propose the following suggestions:
Footnotes
Acknowledgements
This article was supported by National Natural Science Foundation of China (No. 71804189) and Shandong Provincial Natural Science Foundation of China (NO. ZR2021MG029), and Social Science Planning Fund Program for Qingdao (QDSKL2101050).
Declaration of conflicting interests
The author(s) declared no potential conflicts of interest with respect to the research, authorship, and/or publication of this article.
Funding
The author(s) disclosed receipt of the following financial support for the research, authorship, and/or publication of this article: This work was supported by the Social Science Planning Fund Program for Qingdao, Natural Science Foundation of Shandong Province, National Natural Science Foundation of China (grant number QDSKL2101050, ZR2021MG029, 71804189) and Shandong Social Science Planning Fund Program (22CSDJ75).
Notes
Author biographies
Bingquan Liu is a professor at School of Economics and Management, China University of Petroleum, East China. Lin is interested in carbon decomposition method.
Lingqi Meng is Master at School of Economics and Management, China University of Petroleum, East China. Meng is interested in Low-carbon development.
Boyang Nie is Master at School of Economics and Management, China University of Petroleum, East China. Nie is interested in low-carbon development.
Junxue Shi is a lecturer at Liupanshui Normal University. Shi is interested in low-carbon development.
Yongqing Li is a Doctor at Huazhong University of Science and Technology. Li is interested in low-carbon development.
Appendix A. Full name of abbreviations
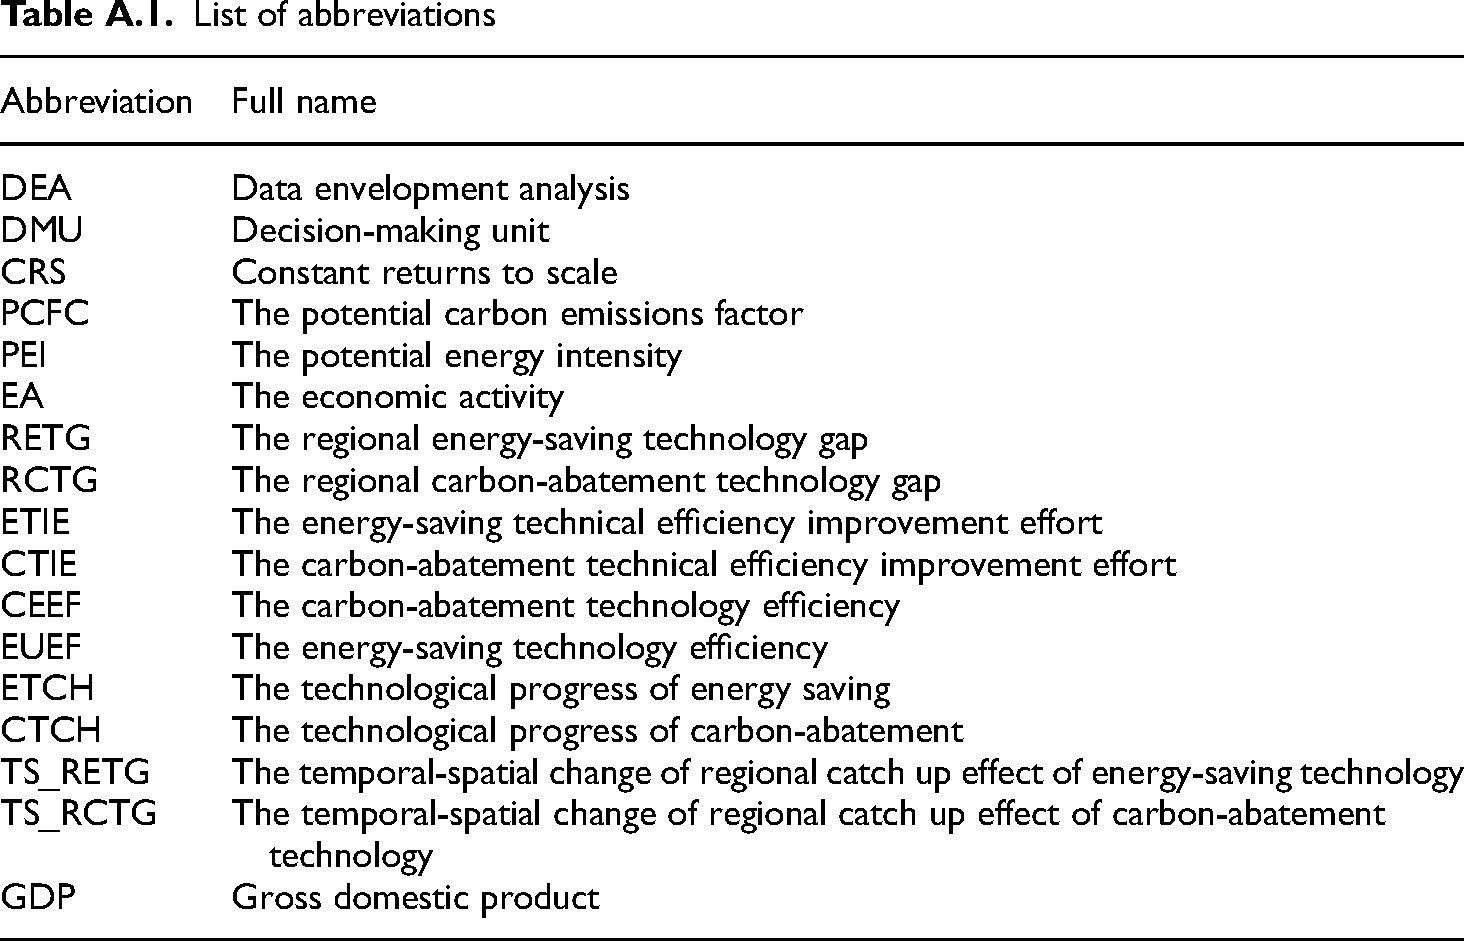
List of abbreviations
| Abbreviation | Full name |
|---|---|
| DEA | Data envelopment analysis |
| DMU | Decision-making unit |
| CRS | Constant returns to scale |
| PCFC | The potential carbon emissions factor |
| PEI | The potential energy intensity |
| EA | The economic activity |
| RETG | The regional energy-saving technology gap |
| RCTG | The regional carbon-abatement technology gap |
| ETIE | The energy-saving technical efficiency improvement effort |
| CTIE | The carbon-abatement technical efficiency improvement effort |
| CEEF | The carbon-abatement technology efficiency |
| EUEF | The energy-saving technology efficiency |
| ETCH | The technological progress of energy saving |
| CTCH | The technological progress of carbon-abatement |
| TS_RETG | The temporal-spatial change of regional catch up effect of energy-saving technology |
| TS_RCTG | The temporal-spatial change of regional catch up effect of carbon-abatement technology |
| GDP | Gross domestic product |