
Abstract
This paper revisits the causal links between financial development, coal consumption, and CO2 emissions in P.R. China over the 1977–2017 period to validate the development of its natural gas industry. It uses a Bootstrap ARDL bound test with structural breaks to establish stationarity, short- and long-run dynamics, and causality of the series. The results show there are no long-run relationships among these three variables, but a Granger causality test does indicate the presence of both a two-way Granger causality between coal consumption and CO2 emissions, and a one-way Granger causality running from financial development to both coal consumption and CO2 emissions. These results have important policy implications for the Chinese government's efforts to meet its commitment at the 75th UN General Assembly to achieve carbon neutrality. In that context, the promotion of its natural gas industry, including carbon pricing mechanisms and taxation schemes while enacting environmentally friendly energy abatement policies become a must.
Introduction
Current world events have exacerbated the global energy crisis. Developed and developing countries have been forced to rethink their energy policies and to decarbonize and comply with carbon dioxide (CO2) emission-reduction targets. Nowadays they reluctantly accept that implementing energy-efficiency measures will require the co-existence of coal power with natural gas before they phase them out and transition to renewable sources of energy. Rising CO2 emissions are a major cause of global warming and climate change has become a serious problem worldwide. 1 The carbon footprint has increased by an average of 1.81 parts per million (ppm) per year over the past 40 years, and the growth of CO2 emissions has accelerated from an average of 1.6 ppm per year in the 1980s to 1.8 ppm per year in the 1990s, and to 2.2 ppm per year during this decade. a The main human activity that produces CO2 is the combustion of fossil fuels such as coal and oil, meaning that rising energy consumption is without doubt one of the most important reasons for increased CO2 emissions.
Coal is a dominant component in the global energy mix, accounting for 27% of all energy used worldwide and for 38% of electricity generation. It also plays a crucial role in the iron and steel industries. However, concerns about air pollution and greenhouse gas emissions cloud its future. 2 Global coal consumption has risen by 25 million tons oil equivalent (mtoe) since 2013, driven largely by India, at 18 mtoe, followed by P.R. China at 4 mtoe. b
P.R. China remains the largest consumer of coal worldwide to meet its rapidly growing industrialization and urbanization processes. In 2014, it used approximately 4 billion tons of coal, a figure that represents more usage than the entire rest of the world combined. 3 P.R. China has relied heavily on coal to meet its demand for energy, with coal comprising 59% of the energy mix in 2018. 4 Burning of coal causes approximately 70% of soot dust emissions as well as CO2 emissions and is considered the main producer of smog due to the high emission coefficient of its pollutants.
Over the years, P.R. China has been labeled as one of the largest CO2 emission countries in the world to the extent that various Chinese cities have been forced to launch coal-reduction measures such as “replace coal by low-carbon natural gas” and “replace coal with electricity” to mitigate their severe contamination issues. 5 Reinforcing these alternatives, it has been suggested that an intensive usage of natural gas by firms can reduce CO2 as well as SO2 emissions at the city level. 6 However, P.R. China has abundant coal resources mainly concentrated in central and western areas, and making a transition away from its current energy infrastructure will be challenging in the short term. 7 Unsurprisingly, an energy transformation strategy for replacing natural gas with coal framed under a long-term perspective of external dependence and national security is still echoed by several government and non-government entities. 8
Coal does indeed dominate P.R. China's energy structure and recognizes that its substitution must be the first step to achieve carbon neutrality. 9 In their view, the combination of a resource tax would reduce coal consumption in the short term, while renewable energy substitution investments would substitute coal production in the long term. Conversely, a more pessimistic angle is presented after using a dynamic stochastic general equilibrium model to examine the macroeconomic impact of intended carbon neutrality on the Chinese economy. 10 Their plan of energy transition policies would begin with the gradual retirement of fossil fuels leading to an inevitable distortion of prices and a deceleration in the replacement of its inefficient production capacity.
P.R. China has witnessed a steady increase in its energy usage for which it is paying a heavy environmental price. Maintaining rapid economic growth while simultaneously mitigating climate change has been a daunting task. For instance, trade liberalization policies undertaken by P.R. China to join the World Trade Organization dramatically accelerated CO2 emissions. 8 Under this scenario they suggested export diversification policies and clean energy production infrastructures to achieve carbon neutrality. Nevertheless, as the largest developing economy, P.R. China still faces great challenges in controlling its energy consumption and CO2 emissions on the premise of ensuring sustainable economic development. 11 In fact, it is currently confronted with a serious tradeoff—addressing climate change to the scrutiny of the international community and enacting environmental protection policies, at the same time as reenacting its booming pre-COVID economy.
This rapid economic growth has been accompanied by unavoidable socio-economic forces and transportation development, both of which have led to increased energy use and worsening air pollution. 12 Interestingly, Figure 1 shows that while P.R. China's coal consumption has grown continually since 1965, coal's share of total energy consumption has declined, signaling that P.R. China may be adjusting its energy consumption pattern in some way. The Chinese government and industry are indeed embracing less polluting and more efficient sources of energy in the decades to come. Chiefly within this transition is the high efficiency presented by natural gas to meet a domestic demand that annually grows in the 8%–10% range to reach about 6500 × 108 m3 by 2035 and whose CO2 emissions are almost half than those of coal under equal calorific value.7,13 The rationale for a comprehensive shift in sources of energy is compounded by the fact that the relationship between natural gas consumption and aggregate income has been well established. While the latter was found to drive economic growth for P.R. China a bidirectional causality has been corroborated in Germany and Japan.14,15

Coal consumption and proportion of energy consumption accounted for by coal. Data source: National Bureau of Statistics of China. China Statistical Yearbook-2019. http://www.stats.gov.cn/tjsj/ndsj/2019/indexch.htm.
However, lukewarm progress was realized among Chinese governmental agencies as the 13th Five-Year Plan (2016–2020) unfolded. c Accordingly, theoretical and practical approaches were applied in P.R. China to measure the benefits and costs of pursuing carbon neutrality capability. 16 Despite convincing results, they recommended quantitative studies to better evaluate the correlation of its realization path between and within industries. In turn, more flexible renewable and non-renewable sources of energy and longer-term infrastructure strategies must be implemented to secure a clean energy mix transformation aimed at its goal to attain peak CO2 emissions by 2030 and achieve carbon neutrality by 2060.
Given the current pressure to reduce CO2 emissions and the trend toward cleaner sources of energy, P.R. China is making strides to improve environmental quality across regions and provinces. 17 Carbon emissions are not only influenced by energy consumption, but other sources have also an effect on emission intensity during periods of economic growth. Recent literature on the emissions-energy-growth nexus has found financial development to be a key determinant in driving the demand for energy in developing economies. 18 Nowadays, the Chinese financial sector, which is comprised of public and private banks, insurance companies, and other financial institutions, has begun to factor climate change and global warming into their analytical frameworks. This is accomplished as part of the financial sector's role in regulating the economy, by exerting tighter control on loans to high-polluting and high-energy-consuming enterprises.
In September 2015, the P.R. China's State Council issued the “Overall Plan for the Reform of the Ecological Civilization System” which proposed a strategy for building a green financial apparatus. “Green finance” was then identified as the explicit integration of benefits, costs, and risks related to environmental conditions into daily banking operations. It factored in the potential environmental consequences of investment decisions and focused on the ecological aspects of financial activities and environmental pollution control to meet CO2 reduction targets. In other words, it dealt with financial resources flowing into sustainable development projects and initiatives, environmental products, and policies that encourage the investment in climate mitigation technologies consistent with a more sustainable economy. b Subsequently, the 13th Five-Year Plan, d stated the need to establish a green financial system, develop green credit and green bonds, and promote a successful green development fund to transition to a lower-carbon Chinese economy.
Understanding the causal relationship between financial development, coal consumption, and CO2 emissions is important to Chinese policymakers to enable them to make appropriate decisions regarding sources of energy that address carbon neutrality. This topic is novel despite the fact there is literature on the emissions-energy-growth nexus in developing countries with a focus on the influence of CO2 emissions. However, there are few empirical studies on the impact of financial development on CO2 emissions and coal consumption in P.R. China. The purpose of this paper is to investigate the cointegration and causality relationships among financial development, coal consumption, and CO2 emissions in P.R. China for the 1977–2017 period using the newly developed Bootstrap bound test with structural breaks.
The study adds new empirical evidence to the ongoing debate in many aspects. Unlike traditional Auto Regressive Distributed Lag (ARDL) bounds tests, the Bootstrap ARDL method is primarily used to test the validity of the cointegration status of the variables. Subsequently, a Granger causality test can be applied to find out the directionality of their long-term cointegration relationship. The Bootstrap ARDL method does not need to distinguish independent variables from dependent variables, so it can be used for two-way verification, such as x → y or y → x. In addition, the Bootstrap ARDL method generates critical values to test degradation in the ARDL model. There were two degenerate cases without cointegration relationships suggested in which only one degenerate case was tested by its critical value. 19 Their method not only solved the endogenous problem, but also allowed the identification of degradation cases, therefore eliminating the possibility of uncertain inference.
This study is organized as follows: Section 2 reviews the literature. Section 3 describes the data used, presents the traditional ARDL model and introduces the new Bootstrap ARDL bound test. Section 4 discusses the empirical results, which are followed by the conclusions and policy implications in Section 5.
Literature review
Research undertaken in both developed and developing countries has debated whether the relationship between economic growth and the environment matches the Environmental Kuznets Curve (EKC) hypothesis, which states that although economic growth initially causes environmental degradation, environmental problems improve once a certain level of development is reached.20,21 Recent studies of the relationship between economic growth and environmental degradation using more advanced econometric methods have yielded widely different conclusions.22,23 A case in point is the application of the D2C algorithm used in Machine Learning to verify the predictive causal linkages among solar and wind energy production, coal consumption, and economic growth by keeping CO2 emissions at a desired target. 24 Alternative methodologies based on panel unit root tests with both sharp and smooth breaks have also been used to examine the stationarity of natural gas consumption for the G7 countries. The intent has been to identify the presence of structural breaks and discriminate between the various temporal shocks to the demand for energy to formulate better environmental policies. 25 Other variables, including financial ones, that could potentially impact the demand for energy have been suggested. 26 More recently, other scholars adapted the EKC model to include variables such as financial development, innovation, foreign direct investment, and urbanization to reach more powerful explanations.27–30
Research on the relationship between financial development and CO2 emissions suggests that financial development may lead to environmental degradation. 31 It has also been proposed that financial development leads to economic growth, creating an increased demand for energy, which in turn results in more industrial pollution and environmental disasters. 32 In addition, financial development makes loans available, triggering greater household consumption and hence elevating CO2 emissions. 33 For example, higher financial ratios such as stock market capitalization to GDP, stock market value traded to GDP, and stock market turnover increase the demand for energy in emerging economies. 34 Greenhouse gas emission targets may also be more difficult to meet if they are formulated without considering the impact of financial development on the demand for energy. The influence of financial development on CO2 emissions in P.R. China underscored that financial development acted as an important driver for increasing CO2 emissions, a factor that should be considered when CO2 emissions are projected. 35 A study of the Indian economy revealed that financial development promoted greater CO2 emissions over the long term, implying that financial development accelerated environmental degradation. 36
However, other scholars have shown that financial development may drive technological progress and bank credit and policymaking for reducing CO2 emissions and environmental pollutants.37–39 Case in point is that countries with highly developed financial systems are less likely to pollute due to their more innovative environmental programs for carbon trading. 40 Financial development helps to reduce environmental degradation through more energy-efficient production processes. 38 Policies aimed at increasing financial openness and liberalization attract higher levels of R&D-related foreign direct investment, which could moderate environmental degradation. 41
Along those lines, the banking system could itself encourage investment in energy-efficient technologies by offering low-interest rates and including carbon-related conditions in their financial products, such as electric business vehicles and real estate loans. 36 The determinants of environmental degradation for 26 African countries from 1985 to 2011, after political regimes were accounted for, indicated that financial development was a significant determinant of environmental degradation. 31 Alternatively, the link between CO2 emissions, financial development, energy consumption, and economic growth suggested that an efficient financial sector exerts a dynamic role in reducing CO2 emissions. 42
In light of P.R. China's ongoing financial development, coupled with dual pressures from domestic environmental deterioration and international climate treaties, scholars have studied its relationship between financial development and the environment. 31 Investigating the impact of financial development on environmental pollution in P.R. China from 1953 to 2006, it was claimed that financial development has decreased environmental pollution. 39 Using regional panel data from 1997 to 2011, the relationship between financial development and CO2 emissions showed that financial development reduced CO2 emissions in the most developed Chinese provinces but increased CO2 emissions in less developed ones. 43
Over time, various econometric methods have been applied to examine the finance-energy-CO2 emissions nexus. For instance, the relationship between financial development and energy consumption in the European Union after applying the system GMM method suggested that income growth increases energy consumption. 44 Furthermore, a spatial econometric model has been used to re-examine the effect of financial development on CO2 emissions based on panel data from 97 countries over the period 2000–2014. 45
An alternative econometric method is the ARDL bound testing approach of cointegration. Its early applications paid particular attention to the small sample properties and simultaneity bias embedded in the relationship between economic growth, CO2 emissions, and energy use for Armenia, Azerbaijan, Georgia, and Turkey. 46 Subsequently, the applied macro-econometric literature also suggested that time-series calculations may contain potential structural breaks which, if not identified, may result in large estimation errors. 30 Therefore, they utilized a structural break unit root test prior to an ARDL model to test the long-run equilibrium relationship between financial development, innovation, energy demand, and CO2 emissions between 1980 and 2014 in Brazil. The effect of GDP growth, coal consumption, financial advancement, and trade openness on CO2 discharges were evaluated in India between 1971 and 2017. 47 The results show that coal consumption raised CO2 emissions substantially while the financial development boosted the environmental quality.
The ARDL method has the advantage of solving endogeneity problems and eliminating the possibility of inconclusive inference. 19 Meanwhile, linear equation models are more robust in time series analyses than non-linear relationship techniques such as STIRPAT which have been used recently. 28 An increasing number of studies began using the Bootstrap technique and causality based on the ARDL model.47,48 This study, therefore, uses the newly developed Bootstrap ARDL method with structural breaks to revisit co-integration and causality among financial development, coal consumption, and CO2 emissions in P.R. China in order to provide sound empirical evidence for policymakers. After confirming that all of the underlying series are stationary and adjusted with structural breakpoints, the results of the ARDL bound test approach with the Bootstrap technique confirm the long-run cointegration and short-run Granger test between the variables.
Data and methodology
Data
This study examines the causal links among financial development, coal consumption and CO2 emissions in P.R. China using a newly developed Bootstrap ARDL model over the 1977–2017 period. According to previous studies, broad money, domestic credit provided by the banking sector, domestic credit to the private sector (all measured in % of GDP), stock traded at market value, and stock market turnover are typical financial development indicators.34,49,50 Unlike developed countries where the capital market prevails, the stock market in P.R. China does not accurately reveal the development of its financial system. We selected “domestic credit to the private sector” because it is the most commonly banking-related variable used as a proxy for financial development. 36 Domestic credit to the private sector refers to resources provided by financial corporations, via loans, purchases of non-equity securities, trade credits, and other accounts receivable that establish a claim for repayment. It accurately represents the role of financial intermediaries in channeling funds to private stakeholders. Data on CO2 emissions and coal consumption were retrieved from the BP Statistical Review of World Energy (2020). 3 Table 1 shows the descriptive statistics of the variables used. The skewness coefficients for FDM, LCO2, and LCOC were all positive and their values small, indicating that these three variables were slightly but not significantly long-tailed from right to left. As far as kurtosis, all three variables showed peaks well below 3. The low P-values of the Jarque–Bera test suggested that the data were not normally distributed.
Descriptive statistics.

FDM: Financial development (domestic credit to the private sector % of GDP); LCO2: logarithm of CO2 emissions; LCOC: logarithm of coal consumption.
Methodology
The ARDL bound test has undergone several improvements since first developed it. 51 Recently, other applied Bootstrap techniques to the ARDL have added a few advantages. 19 The first is that there is evidence that the endogeneity problem has only minor effects on the size and power properties of the ARDL bound testing framework using the asymptotic critical values from Monte Carlo simulations. If the resampling procedure is applied appropriately, the Bootstrap test performs better than the asymptotic test in the ARDL bound test based on size and power properties. Second, the Bootstrap ARDL procedure has the additional advantage of eliminating the possibility of inconclusive inferences. Finally, the ARDL testing framework was extended for alternative degenerate cases using critical values offered by the Bootstrap procedure. 19 Consequently, the proposed Bootstrap ARDL bound test provides a better insight into the cointegration status of a time series.
The relationship between foreign direct investment, renewable energy consumption, and economic growth has been examined for seven Middle Eastern and North African countries between 1980–2017. 52 Using the ARDL test developed by McNown et al. he uncovered a cointegration relationship between economic growth, FDI inflows, and renewable energy consumption in all countries except Turkey and Iran when real GDP was used as the dependent variable. Similar results were observed across countries when FDI inflows were considered as the dependent variable. Incidentally, ARDL cointegration tests were also used to analyze the dynamic causal relationship between foreign direct investment, gross domestic product, and trade openness for five South Asian countries between 1975 and 2016. 53 They found that trade openness was significantly associated with economic growth in India, Bangladesh, and Sri Lanka, and that trade openness expansion was critical for the economic expansion in these countries. The results showed that for all countries but Bangladesh, there was a long-term cointegration when FDI was held as the dependent variable.
Selection of unit root test
The Bootstrap ARDL bound test uses the principle of self-regression and multiple loop calibrations to approximate the time-series data to the results that need to be verified. Before applying the Bootstrap ARDL bound test, it is necessary to know whether the data are stationary. The Bootstrap ARDL bound test does not require the restrictive assumption that all series are integrated in the same order, thus allowing for the inclusion of both I (0) and I (1) time series in a long-run relationship. However, the presence of I (2) variables results in an invalid FPSS statistic. 51 Therefore, the next steps were to run conventional unit root tests, such as the Phillips and Perron (PP), and the Augmented Dickey-Fuller (ADF), which offers a better stationary, in addition to the Kwiatkowski-Phillips-Schmidt-Shin (KPSS) which is also widely used in confirming stationary among variables.
ARDL bounds test
The ARDL bound test has a time series of mixed integration sequences that can be defined as:
In the case of an exogenous weak regression, in the long run, these regression factors are not affected by the independent variables. The model neither precludes the existence of cointegration between regressions nor assumes that there is no dependent variable to the regression.
Bootstrap ARDL bound test
The time series Bootstrap ARDL bound test method applies three variables:

It has been proposed to add the original ARDL model to a lag period for independent variables where the null hypothesis is γ = 0.
19
Doing so creates more complete conditions for testing the cointegration relationship.
51
The Bootstrap ARDL bound tests the cointegration relationship by relying on the following assumptions:
A cointegration among yt, xt, and zt leads to rejection of all following three null hypotheses:
F-test (denoted as F1) for all error correction terms: H0:γ = θ = φ = 0 for H1: Any γ, θ, φ ≠ 0; t test for the lag dependent variable (denoted as t): H0:γ = 0 for H1:γ ≠ 0; F test for the lag independent variable (denoted as F2): H0:θ = φ = 0 for H1:θ or φ = 0.
Degenerate case 1 occurs when F1 and t for the lag-dependent variable are significant, but F2 is not significant. In this case, the joint importance of the error correction term is due only to the lag of the dependent variable.
Conversely, degenerate case 2 occurs when the F1 and F2 tests for the lag-dependent variable are significant, but the t-test for the lag-dependent variable is not significant. This produces the same situation as case 1: the joint importance of the error correction term is due only to the lag of the dependent variable.
The Bootstrap ARDL bound test allows us to better understand the cointegration state of the series in the model, and we used the Monte Carlo simulation for the size and power characteristics of the endogenous problem frame. The asymptotic threshold of the simulation has only a small effect; if the resampling process is applied properly, the pilot-to-test ratio is determined, and the asymptotic check in the ARDL check based on the size and power characteristics performs better. The possibility of inference is uncertain. It can also describe the extension of the validation framework in the case of alternative degradation, as well as the threshold generated by the Bootstrap ARDL bound test. Since the Bootstrap ARDL bound test is based on the Granger causality test, the direction of the short-term causal relationship will be determined by the standard Granger causality test. If y is due to a variable, no agreement is found between y and x. The Granger causality test of x → y should thus only include the hysteresis difference of x. That is, using Equation (3) above, we test whether ω > 0; if there is a cointegration relationship between the variables, then this means the relevant variables and independent variables form a fixed linear combination. The hysteresis term can be considered as I (0), and the Granger causality test of x → y should include the hysteresis difference of x and the hysteresis level of x, that is, whether θ > 0 and ω = 0.
Results and discussion
The Bootstrap ARDL bound test performs better than alternative multivariate cointegration procedures when small samples are involved. 54 It does not require the restrictive assumption that all series are integrated in the same order, allowing for the inclusion of both I (0) and I (1), but not I (2), time series in a long-run relationship. In addition, it provides flexibility and avoids potential “pretest bias” when specifying a long-run model based on I (1) variables only. 51
Results from the unit root test
As mentioned earlier, we ran conventional unit root tests, whose results appear in Tables 2 and 3. According to the ADF, PP, and KPSS unit root tests are shown in Table 2, the financial development in domestic credit to the private sector percentage of GDP (FDM), logarithm of CO2 emissions (LCO2) and logarithm of coal consumption (LCOC) are all I (1) or less. To improve the deficiency of the univariate unit root test and for robustness check, we made use of the ZA unit root test with one structural break. 55 Table 3 shows the results of ZA unit root tests. A break at a point in the intercept and/or the slope of the trend function is permitted. Stationarity of variables employed in level and first differences are both already reported in Table 3. According to these results, all the variables are I (1) or less, which is consistent with the premise of the Bootstrap ARDL bound test.
Univariate unite root tests.
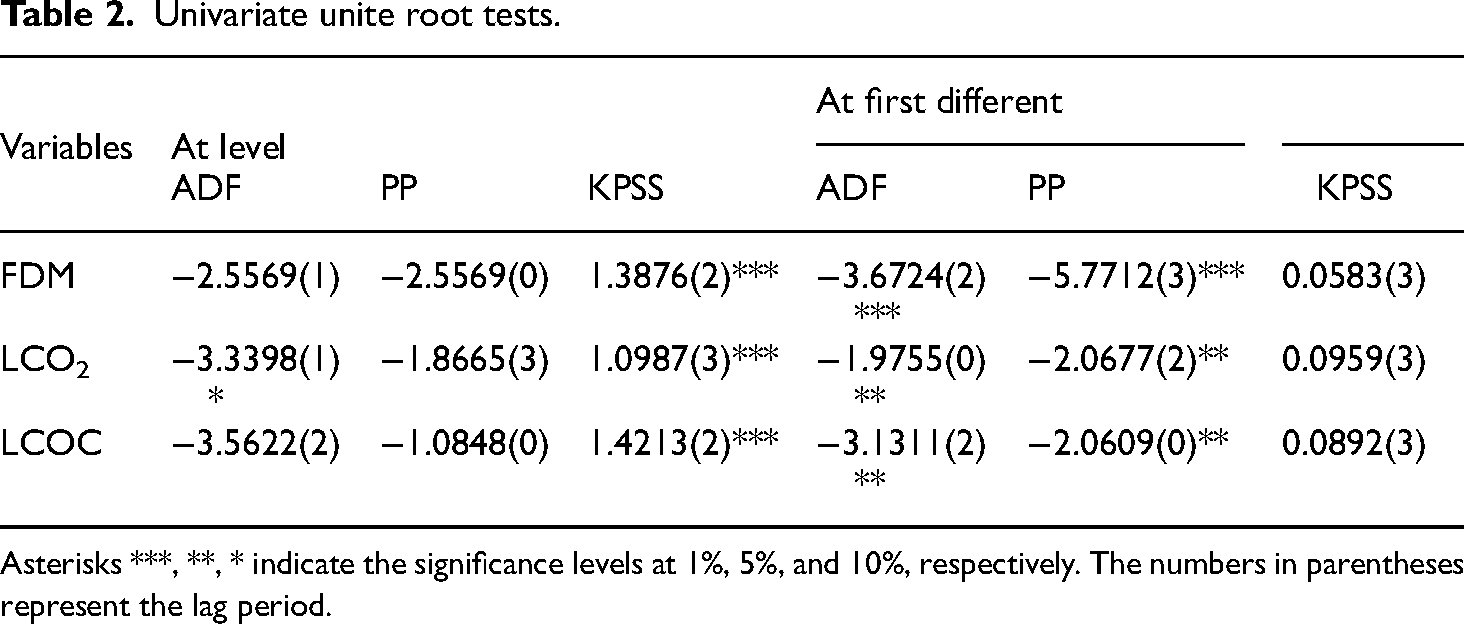
Asterisks ***, **, * indicate the significance levels at 1%, 5%, and 10%, respectively. The numbers in parentheses represent the lag period.
Zivot and andrew unit root tests.

Asterisks ***, **, * indicate the significance levels at 1%, 5%, and 10%, respectively. The numbers in parentheses represent the optimal lag length for Z-A test.
Results from bootstrap ARDL bound test–cointegration test
Since both financial development and coal consumption are integrated as I (1) and CO2 emissions is I (0), we continued using the Bootstrap ARDL bound test approach to cointegrate the relationships among financial development, coal consumption, and CO2 emissions. If the dependent variable is static, the new Bootstrap ARDL bound test for degenerate case 1 prevents an incorrect inference and, therefore, does not cointegrate with the other two series. Table 4 displays the estimation and testing of Equation (3) using the Bootstrap ARDL bound test. Each ARDL equation passes all diagnostic tests for autocorrelation, non-normality, and heteroscedasticity. These lag lengths were determined using the AIC, F1*, F2*, and t* refers to a critical value of 0.10 significance level. Table 4 reports the F statistics obtained from applying the Bootstrap ARDL approach with structural breaks. They provide an insufficient amount of evidence in favor of a cointegrating relationship between financial development, coal consumption, and CO2 emissions. However, causality patterns are identified in the short run.
Results for Bootstrap ARDL cointegration test.

F1 is the F statistic for the coefficients of y(−1), x1(−1), and x2(−1); F2 is the F statistic for the coefficients of x1(−1) and x2(−1); t denotes the t statistic for the coefficient of y(−1). D## refers to the dummy of that year. Asterisk (*) indicates a significance level at 10%.
Results for Granger causality test
Based on the results from the ARDL cointegration test, we further tested the Granger causality among financial development, coal consumption, and CO2 emissions. Table 5 presents the Granger causality test results based on the Bootstrap ARDL bound test. There is a bidirectional causality between coal consumption and CO2 emissions as well as a positive unidirectional causality running from financial development to coal consumption, and a negative unidirectional causality running from financial development to CO2 emissions. Coal consumption and CO2 emissions have a mutually reinforcing effect, which is consistent with coal consumption being an important explanatory factor for increased CO2 emissions. In the short run, the study finds evidence to support a one-way Granger causality from financial development to CO2 emissions. As an economy develops, so will its financial system and the whole demand for coal will not decrease, industrial upgrades and technological innovation will contribute to reduced CO2 emissions.
Results for granger causality test based on Bootstrap ARDL bound test.
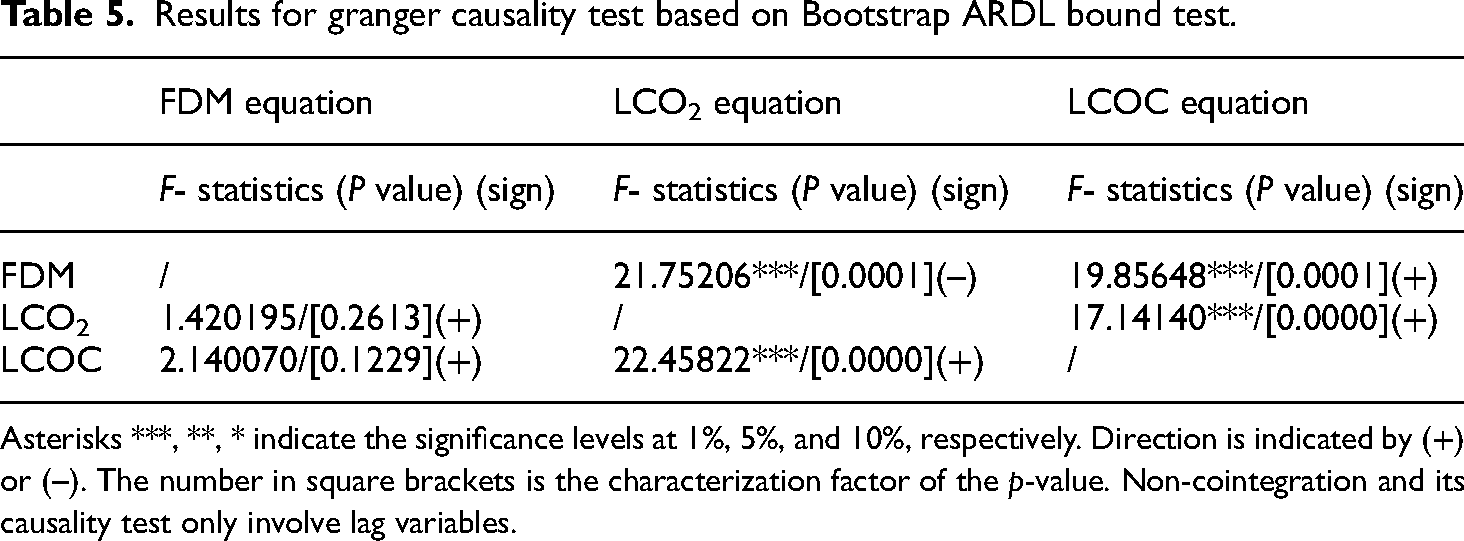
Asterisks ***, **, * indicate the significance levels at 1%, 5%, and 10%, respectively. Direction is indicated by (+) or (–). The number in square brackets is the characterization factor of the p-value. Non-cointegration and its causality test only involve lag variables.
Conclusion and policy implications
We re-examined the causality relationships among financial development, coal consumption, and CO2 emissions in P.R. China by applying the newly developed Bootstrap ARDL bound test to data from 1977 to 2017. Empirical results do not indicate a long-run relationship among these three variables. Instead, the Granger causality test shows a two-way Granger causality between coal consumption and CO2 emissions and a one-way Granger causality running from financial development to both coal consumption and CO2 emissions. The positive and negative values for the coefficient of causality suggest that a reduction in CO2 emissions can be achieved even while coal consumption remains high as long as P.R. China's economy continues to bloom. The financial system has indeed an opportunity to drive lower CO2 emissions through bank loans targeting green credit and industrial upgrades. More importantly, however, is the breakthrough offered by the natural gas industry to become the most reliable low-carbon and non-carbon energy source to reduce CO2 emissions.
This paper suggests important policy implications for pushing the natural gas industry to champion P.R. China's agenda for reaching carbon neutrality. First, the Chinese government should improve financial development and make rational use of the financial markets under carbon neutrality. When formulating environmental policies, the Chinese government must recognize that financial development and reduction in CO2 emissions are not mutually exclusive. In fact, greater financing of innovative green lending products and lower financial development costs can play an active role in helping businesses seeking to decarbonize key production activities and processes to improve the effectiveness of investments in climate-friendly power plants and reduce P.R. China's dependence on coal. Secondly, the innovation of financial products should be promoted to upgrade products and services for the natural gas industry. Carbon pricing should be actively supported and domestic carbon trading markets should be gradually developed. Banks must also increase the financing of research and development of innovative technological approaches along with supporting its enabling infrastructure and capacity building to reduce energy-associated costs. Finally, P.R. China should continue to strictly control the “two high and one left” industries, vigorously promote solar, wind and nuclear energies and accelerate the development of the natural gas market under stringent carbon neutrality conditions.
This study contributes to the growing literature that aims to discourage the production and consumption of coal and promote the development of clean sources of energy to achieve carbon neutrality in P.R. China. First, it provides empirical evidence of the role played by financial development in relation to coal consumption and CO2 emissions. It explores their co-integration and causality through the newly developed Bootstrap ARDL bound test with structural breaks. Unlike prior studies that overlooked these interactions, this study establishes the stationarity of financial development, coal consumption, and CO2 emissions to provide insights into their short- and long-run dynamics. Second, it enriches the growing discussion of an optimal energy mix by offering a rationale for Chinese government officials to strengthen their assortment of financial policy instruments. Lastly, it advances the literature on the driving factors of CO2 emissions in the context of the natural gas industry.
Finally, our research does carry some limitations. One of them is the need to underscore the underlying causes of financial development and coal consumption on CO2 emissions as well as financial development and CO2 emissions on coal consumption. Having a better grasp of their moderating impacts will certainly provide more insights at the time of formulating and implementing sound environmental policies. These unsolved issues need further scrutiny in future research.
Footnotes
Acknowledgements
The authors are grateful to the editor and anonymous referees for their helpful comments and suggestions.
Authors’ contributions
As the primary authors J.O. conceptualized and supervised the research. T.T. performed the analysis and produced the first draft while H.W. provided advice throughout and contributed to the econometric aspects of the data.
Declaration of conflicting interests
The author(s) declared no potential conflicts of interest with respect to the research, authorship, and/or publication of this article.
Funding
The author(s) disclosed receipt of the following financial support for the research, authorship, and/or publication of this article: This study was supported by the Scientific Research Program of Hubei Provincial Department (No Q20222207) and the Research Center of Hubei Financial Development and Financial Security.
Notes
Author biographies
Teng Tong is an associate professor at the School of Finance, Hubei University of Economics in Wuhan, P. R. China. She holds degrees in International Business, Finance, and Industrial Economics, all from Wuhan University of Technology. Her research fields evolve around green financial policies, carbon finance development, financial risk prevention, and the intersection between technological and financial innovation. Her research projects have been funded by the Science and Technology Department of Hubei Province, Ministry of Education Humanities and Social Sciences, and the National Social Science Foundation of P.R. China.
Jaime Ortiz is a professor of Global Economies and Markets at the Robert C. Vackar College of Business and Entrepreneurship and Vice President of Global Affairs at The University of Texas Rio Grande Valley, USA. He holds degrees from Chile, The Netherlands, and the United States. He has held tenured faculty, senior administrative, and visiting professorship appointments in American, Chinese, and Welsh universities. He has previously worked for international organizations, private corporations, and non-government entities in economic and business matters in more than thirty-six countries.
Haibo Wang is the Radcliff Killam Distinguished professor of Decision Sciences and Operations Research at Texas A&M International University, USA. He earned his degrees from P.R. China and the United States. He has publications in outlets such as IEEE Transactions journals, OMEGA, EJOR, and other major OR journals. He is the author of over 60 refereed journal papers, the majority of which focus on business analytics, infrastructure management, manufacturing scheduling, and optimization modeling. He was the finalist of the BMW Crowded Innovation 2021 Competition-Quantum Computing Challenge.
Appendix-The diagnostic tests for the ARDL
We used diagnostic statistics to confirm the credibility and correctness of the ARDL model. There were four different verification methods, including the ARCH test, Jarque–Bera test, Ramsey RESET test, and Breusch–Godfrey serial correlation LM test. The results of the ARCH and Breusch–Godfrey LM test results showed that there is no evidence of heteroscedasticity and serial correlation. The Jarque and Bera test showed that the ARDL model is normally distributed. The Ramsey RESET test showed that the representation of the ARDL model in its current form is appropriate. In addition, the probability values for all these tests were higher than 0.05. Therefore, all test results are accepted. Figure A1 shows the lines for CUSUM falling within the 5% significance boundary level. We used dummy variables to test the CUSUM square test and the result was found to be stable at the 5% significance level (see Figure A2). These diagnostic results confirmed the ARDL model was both reliable and stable.