
Abstract
The purpose of this meta-analysis was to strengthen the credibility of primary research results by combining open-source scientific material, namely a comparison of craniofacial features (Cfc) between Crouzon's syndrome (CS) patients and non-CS populations. All articles published up to October 7, 2021, were included in the search of PubMed, Google Scholar, Scopus, Medline, and Web of Science. The PRISMA guidelines were followed to conduct this study. PECO framework was applied in the following ways: Those who have CS are denoted by the letter P, those who have been diagnosed with CS via clinical or genetic means by the letter E, those who do not have CS by the letter C, and those who have a Cfc of CS by the letter O. Independent reviewers collected the data and ranked the publications based on their adherence to the Newcastle-Ottawa Quality Assessment Scale. A total of six case-control studies were reviewed for this meta-analysis. Due to the large variation in cephalometric measures, only those published in at least two previous studies were included. This analysis found that CS patients had a smaller skull and mandible volumes than those without CS.in terms of SNA° (MD = −2.33, p = <0.001, I2 = 83.6%) and ANB°(MD = −1.89, p = <0.005, I2 = 93.1%)), as well as ANS (MD = −1.87, p = 0.001, I2 = 96.5%)) and SN/PP (MD = −1.99, p = 0.036, I2 = 77.3%)). In comparison to the general population, people with CS tend to have shorter and flatter cranial bases, smaller orbital volumes, and cleft palates. They differ from the general population in having a shorter skull base and more V-shaped maxillary arches.
Keywords
Introduction
Octave Crouzon, a neurosurgeon from France, first identified Crouzon's syndrome (CS) in 1912. This condition has complete penetrance and variable expressivity and is inherited dominantly; it can also manifest as a mutation. 1 Cystic fibrosis is caused by FGFR2 gene mutations. 2 There are four members of the FGFR gene family, of which FGFR2 is one. The cranial sutures serve as a signaling hub between FGFR1 and FGFR3. The limb development in the embryo depends on this. 3 CS affects about one in every 25,000 newborns. In the United States, it affects 1 in every 60,000.4,5 Craniosynostosis with CS accounts for about 4.8% of all cases.5,6 However, there is no indication of bias toward any particular racial or gender group. 7 Cephalometric and metacarpophalangeal analysis are two common methods used to evaluate craniofacial and kinetic diversity. Cephalometric parameters are the gold standard for comparing patients with and without CS.1,6,7 Symptoms of the disease include the premature fusion of the coronal and sagittal sutures, which develop within the first year of life. Once the sutures are closed, further development is stunted. Midfacial hypoplasia, shallow orbit, and maxillary hypoplasia are all common side effects of premature skull base fusion brought on by multiple sutural synostoses. Upper airway obstruction can also occur in these cases.5,7 Intraoral manifestations include, but are not limited to: mandibular prognathism; oligodontia; overcrowding of the upper teeth; macrodontia; cleft lip and palate; peg teeth; widely spaced teeth; and a V-shaped maxillary dental arch.4,7
While there have been numerous reports on CS patients’ CFC, no comprehensive review of the literature has been conducted as of yet. To strengthen the credibility of the primary study findings, researchers of this study used meta-analysis to compare CS patients with non-CS populations on CFC. The aim of this study was to test the null hypothesis that Cfc from lateral cephalography or computed tomography (CT) scans of the head do not differ between those with CS and the general, non-CS population.
Materials and methods
Protocol for this systematic review was registered in PROSPERO (International Prospective Register of Systematic Reviews) per regulations, and it was performed in accordance with “Preferred Reporting Items for Systematic Reviews and Meta-Analyses” (PRISMA)
8
guidelines (Reg. No.
Search strategy
Relevant articles were sought out by searching several electronic databases (including PubMed, Google Scholar, Scopus, Medline, and the Web of Science) up until and including October 7th, 2021. The terms “craniofacial development,” “morphology,” “growth,” “characteristics,” “cephalometric,” and “clinical features” are used together (combined with “AND”) (Figure 1). All English-language, peer-reviewed journal articles on Crouzon diseases are included in the search.

Keywords used in databases searches.
Study selection criteria
PECO (population, exposure, comparator, and outcome) framework was used to formulate and answer the research question of this study, “Are the CFCs of people with CS different from those of the general population?” For this study PECO framework was used in the following ways: People with CS are referred to as P; those with a clinical or genetic diagnosis of CS are referred to as E; those without CS are referred to as C; and those with a CFC of CS are referred to as O. Patients are evaluated with either lateral cephalometric measurements or a CT scan. Studies that compared people with CS to those without CS were considered for inclusion. Research designs such as case-control, cross-sectional, and cohort studies were all included. A diagram of the cephalometric landmark used in this research is shown in Figure 2. Research involving animals, case reports from clinics, pilot studies, literature reviews, systematic reviews, and book chapters were excluded.
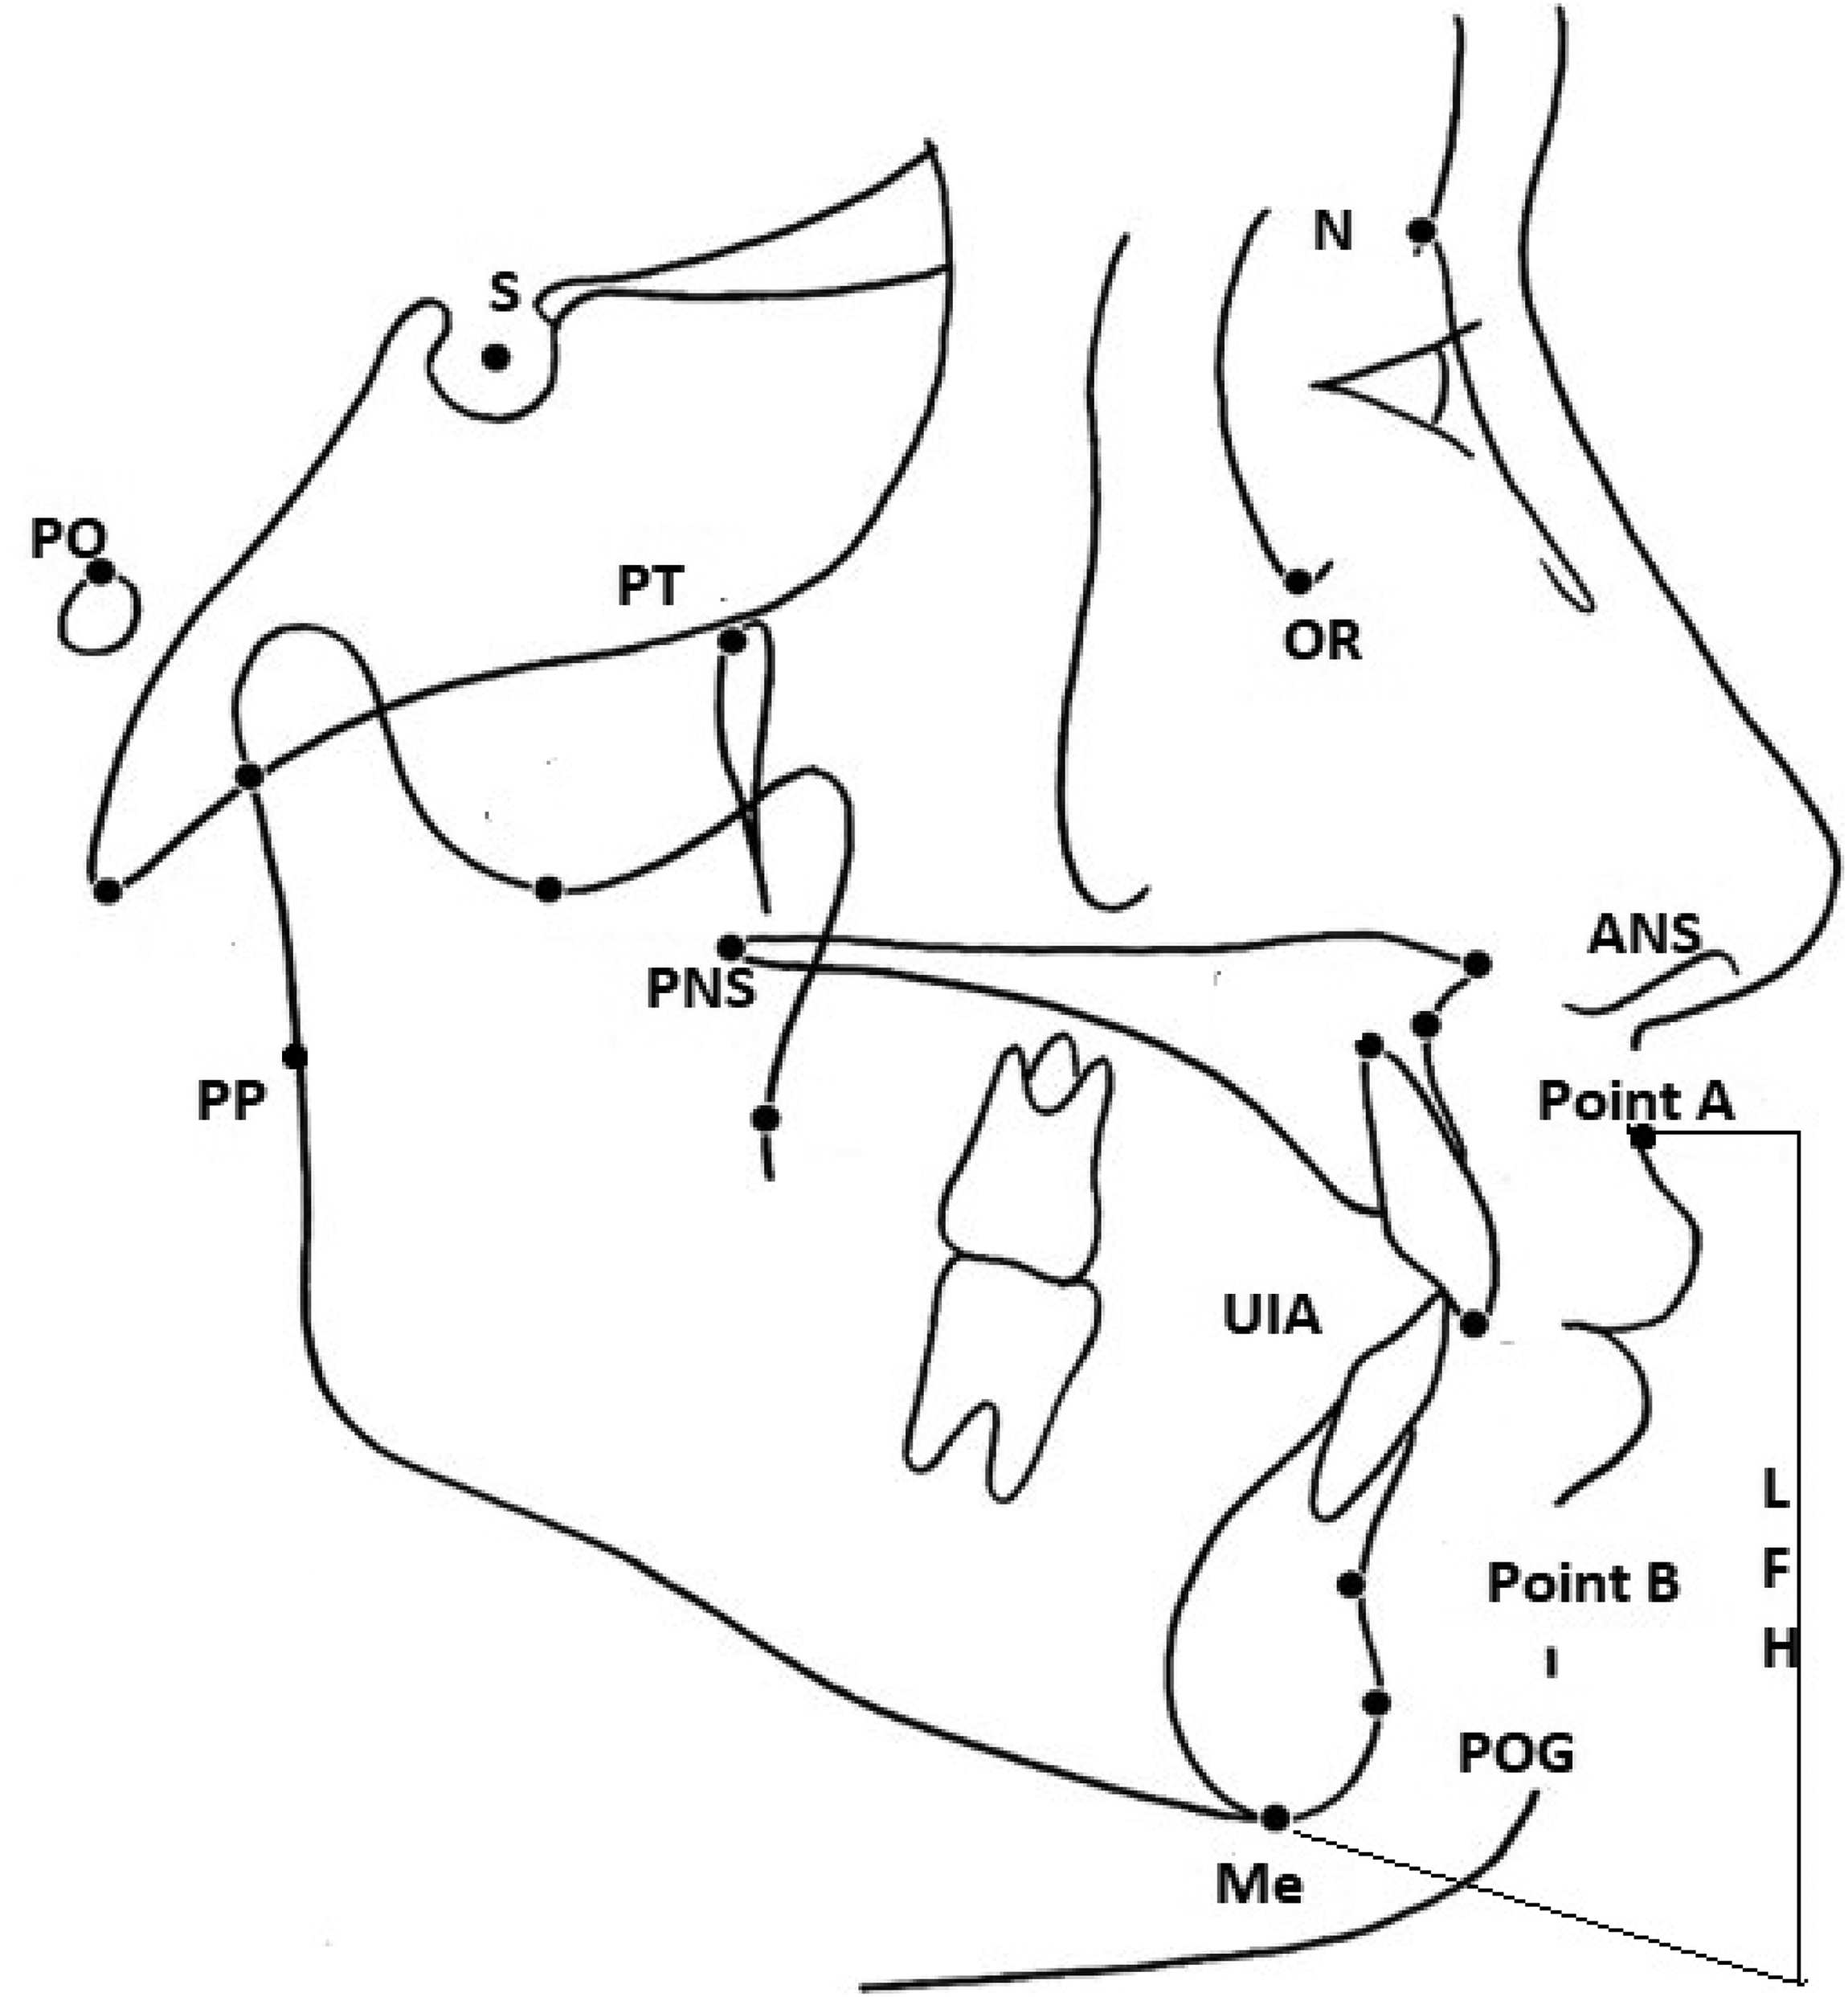
Cephalometric landmarks.
Article selection
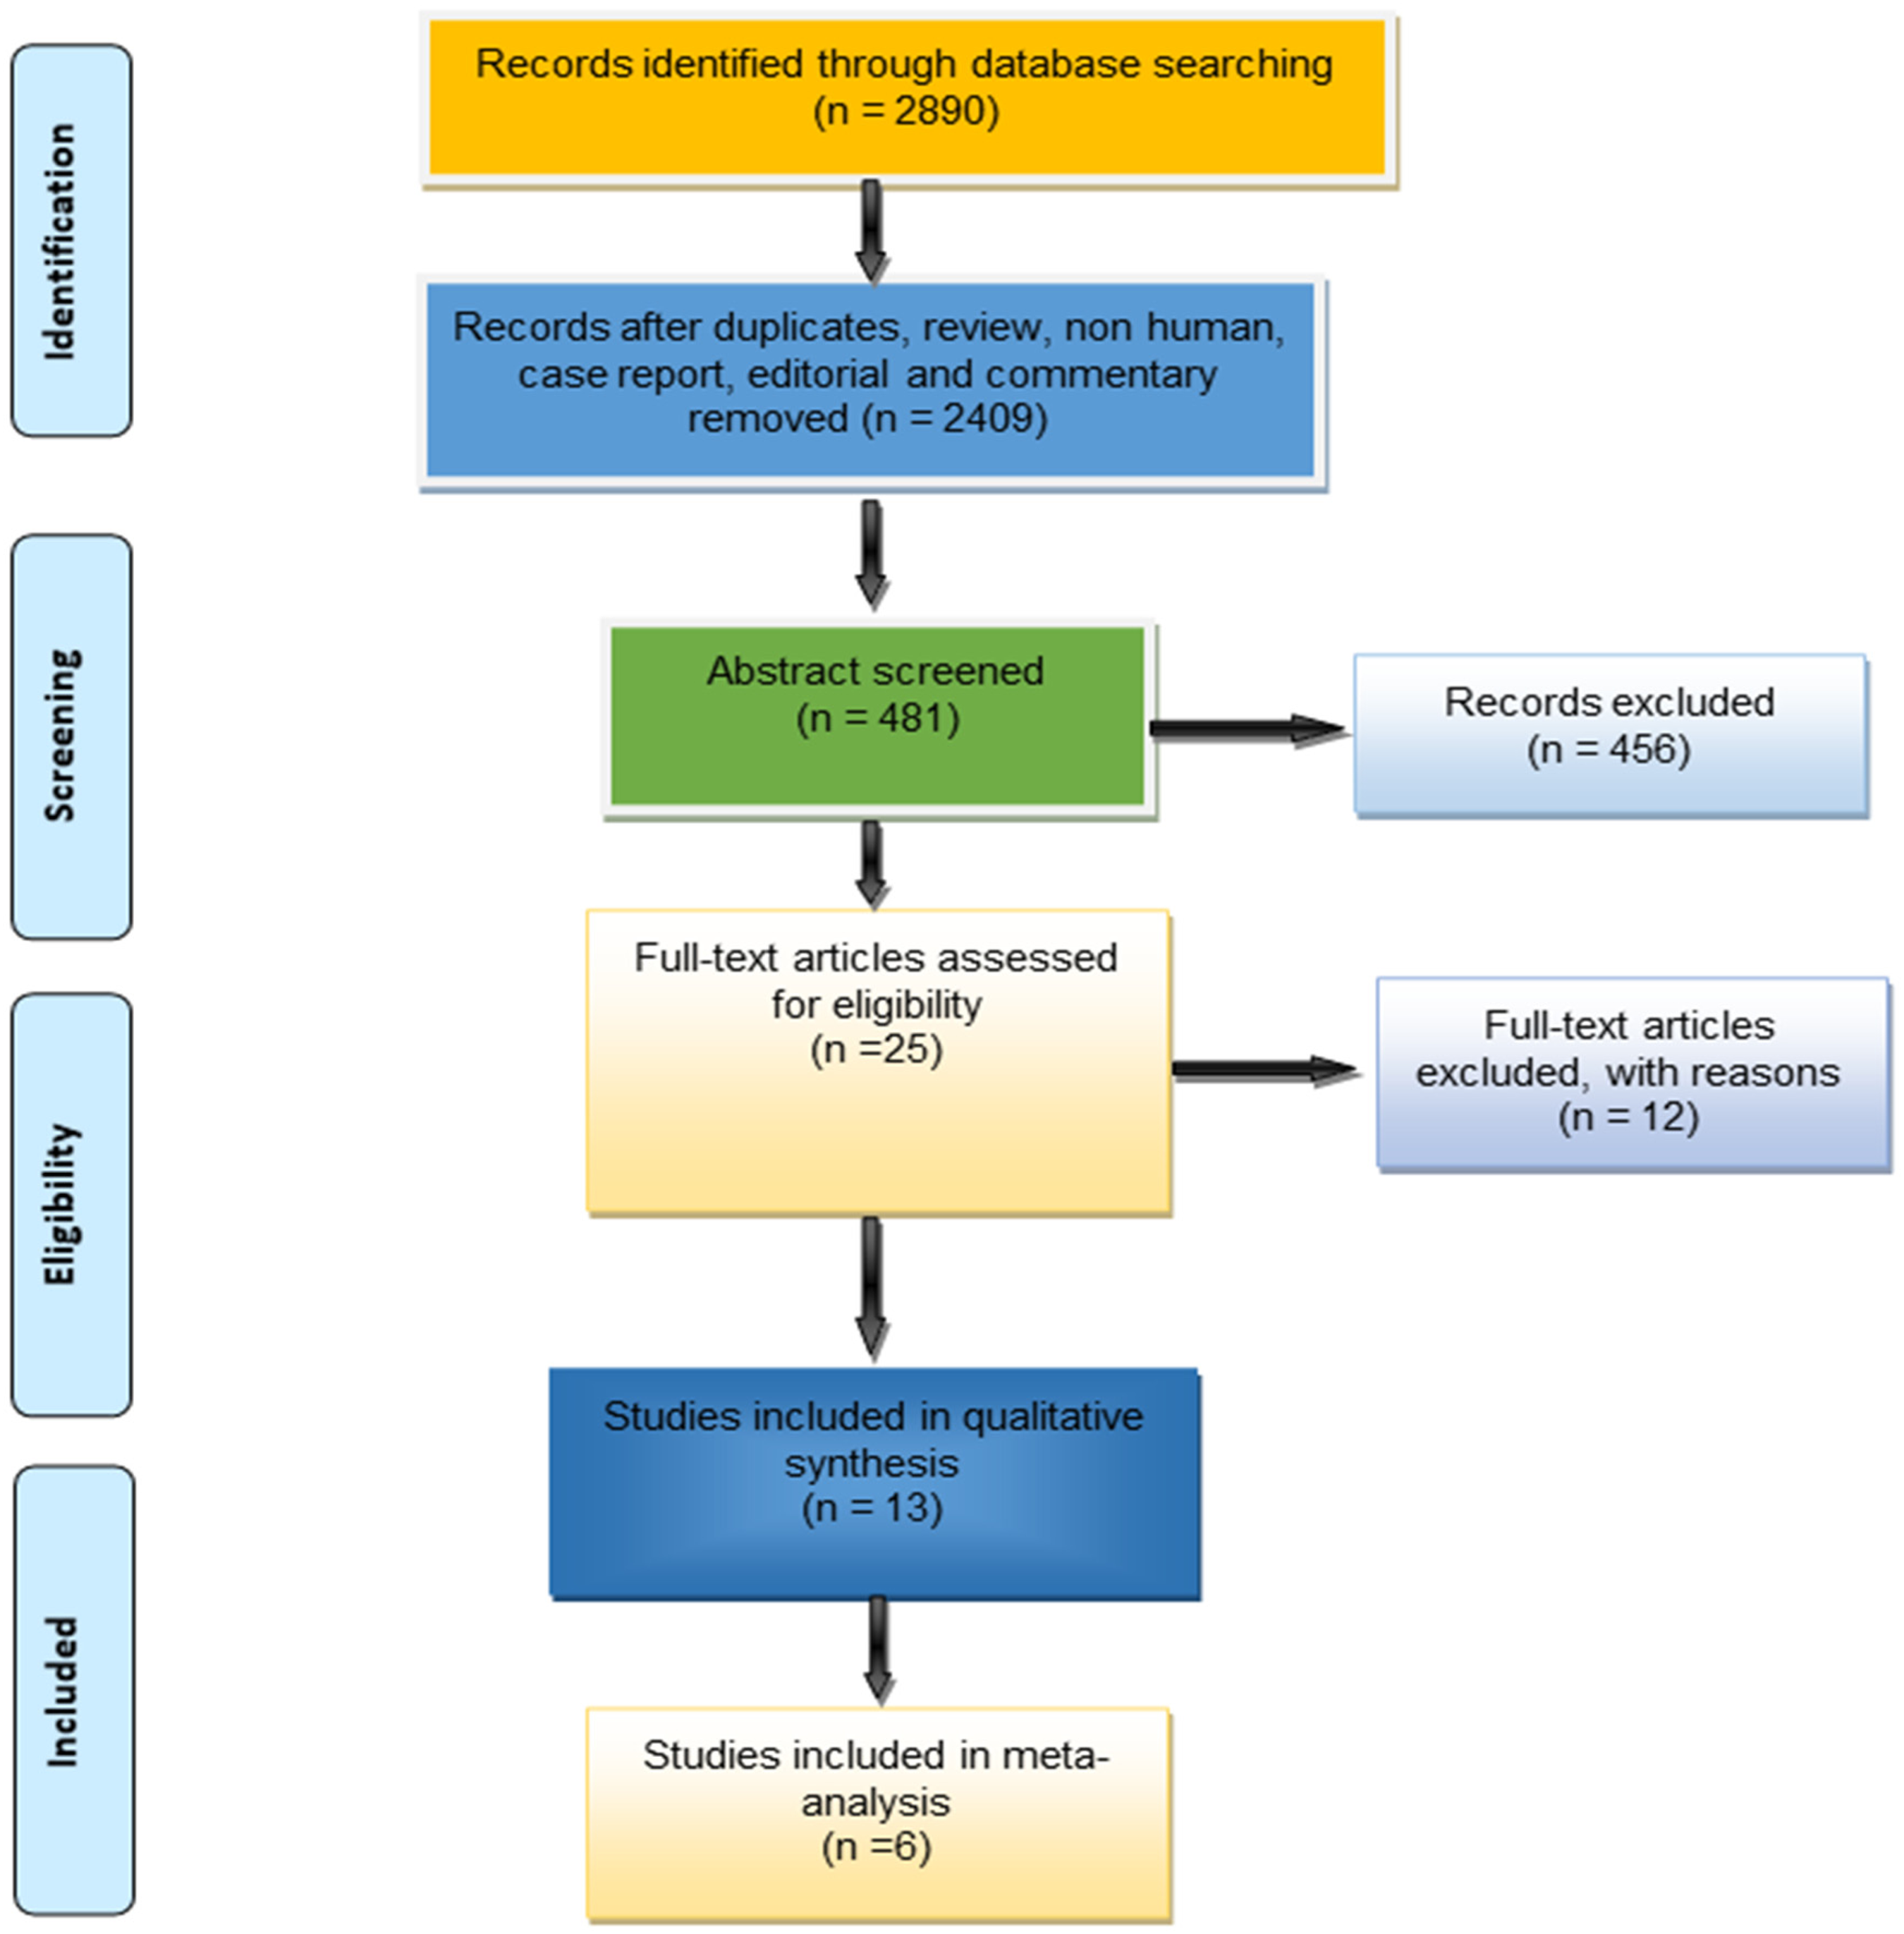
Articles were selected using a four-stage process, as shown in Figure 3. Two researchers (MKA and KKG) made the selections separately, and disagreements were resolved through consensus. Two initial reviewers disagreed on a verdict, so a third reviewer was brought in to settle the dispute (SMM). In addition to the initial search, a manual search was conducted of the papers’ cited sources. To measure the level of consensus among reviewers, we calculated Cohen's kappa coefficients (κ).
Prisma flowchart of the search strategy.
Quality of evidence assessment
The articles were evaluated using the Newcastle–Ottawa Quality Assessment scale (NOS) 9 by two reviewers working in tandem (MKA and KKG) and a third reviewer working independently (SMM). Articles receiving a seven or higher on the NOS's nine-point scale are regarded as excellent. The three components of an assessment are sampling strategy, comparability, and exposure. Cases, controls, and comparisons were all defined and selected according to these criteria. The comparability sections specify the criteria for comparing cases and controls. There are three sub-sections under exposure (exposure = evaluation of observations, exposure = method equality for cases and controls, and exposure = dropout rate). The maximum score for any given item is one, with the exception of “comparability,” which can receive a score of two.
Data extraction
Two reviewers (MKA and KKG) read each paper and culled the following information: authors, year published, country, sample size, gender, and conclusion. Due to the wide range of cephalometric measurements reported in the literature, it was decided to only include measurements that were reported in at least two different articles in the meta-analysis: sagittal position of the subspinal relative to the cranial base (SNA°), The angle formed by the sagittal plane of the supramental in relation to the cranial base (SNB°), the sagittal plane of the maxilla and mandible in relation to each other (ANB°), the distance between the coronoid processes of the two condyles (COR-COL), the sagittal plane of the chin in relation to the anterior cranial base (S-N-Pog), the anterior tip of the sharp bony process of the sagittal/palatal angle (SN/PP angle) describes the orientation of the palatal plane with respect to the anterior cranial base. Measurements of the maxilla, mandible, and lower anterior facial height (LFH ratio) are taken (Figure 2; Table 1). Each metric's mean value and standard deviation were documented.
Cephalometric landmark with their definitions.

Statistical analysis
Independent meta-analyses were performed on all of the results. Since different publications use different cephalometric measurements, a meta-analysis can only be conducted if a mean datum is presented in at least two articles. Since it was anticipated that the individual studies would differ in some way, a random-effects model was used. The mean difference (pooled effect) and 95% confidence intervals were determined for all outcomes. Heterogeneity in effect sizes was analyzed using the Q statistic and the I2 index. The Q statistic (p = 0.05) showed that the population was not normally distributed. Another interesting discovery was that there appeared to be varying degrees of heterogeneity in the data, as indicated by I2 indices ranging from 25% (low) to 75% (high). All statistical analyses were performed using RevMan 11 and R Studio (metafor package).
Results
Selection of studies
The primary search yielded a total of 2890 papers from sources like PubMed, Web of Science, Google Scholar, Scopus, and ScienceDirect. After the initial detection phase, 2409 papers were eliminated, and the remaining 481 were subjected to a second round of screening (reviews, summary documents, non-human, editorials, case reports, commentaries, letters, and duplicate studies). Out of a total of 25, only 12 papers were deemed unsuitable because of unusable data formats. Thirteen studies were found to be eligible for inclusion in the study (Figure 3), and their full texts were all obtained for review. Six papers were all that was included in the meta-analysis.
Study characteristics
Table 2 summarizes the studies that were evaluated. The studies used here were all published in high-quality academic publications. Only 13 of the studies were done in the US,10–12 two in France,13,14 Brazil,15,16 Italy,17,18 Netherlands,19,20 and one in Japan 21 and one jointly 22 in the United States, Brazil, and China. While conducting this study, Cephalometric measurement was found to be the gold standard for scientific inquiry. Totaling 352 cases and 1645 controls, the data came from several different studies. The smallest number of cases were reported by Reitsma et al. (2013), with 6, and the largest number of cases (80) were reported by Lu et al. (2021). In contrast to what Kobayashi et al. (2020) found for Japanese CS patients, who have longer maxillary anteroposterior length, the most common change in CS patients was a decrease in maxillary and mandibular volume (anteroposterior length). Angles SNA, SN/PP, and ANB were all significantly smaller in CS patients compared to those without CS, with the exception of the SNB angle. Although Carinci et al. (1994) found that CS patients have a larger orbital cavity volume, Lu et al. (2021) found the inverse to be true.
Characteristics of the study included in the systematic review.

N/A – Not available.
*- Group overlapping between control sample.
Summary of evidence and meta-analysis
Table 3 displays the results from six separate studies. With the exception of SNB, PNS, and LFH, the mean outcomes for CS subjects were lower than those for non-CS subjects across the table. When compared to the control group, the CS group had significantly smaller mean values for the outcomes of SNA, ANB, ANS, SN/PP, CoR-CoL, S-N-Pog, and maxillary and mandibular volume. There was a statistically significant difference in SNB between patients with and without CS.
Pooled mean differences and heterogenicity of each outcome.
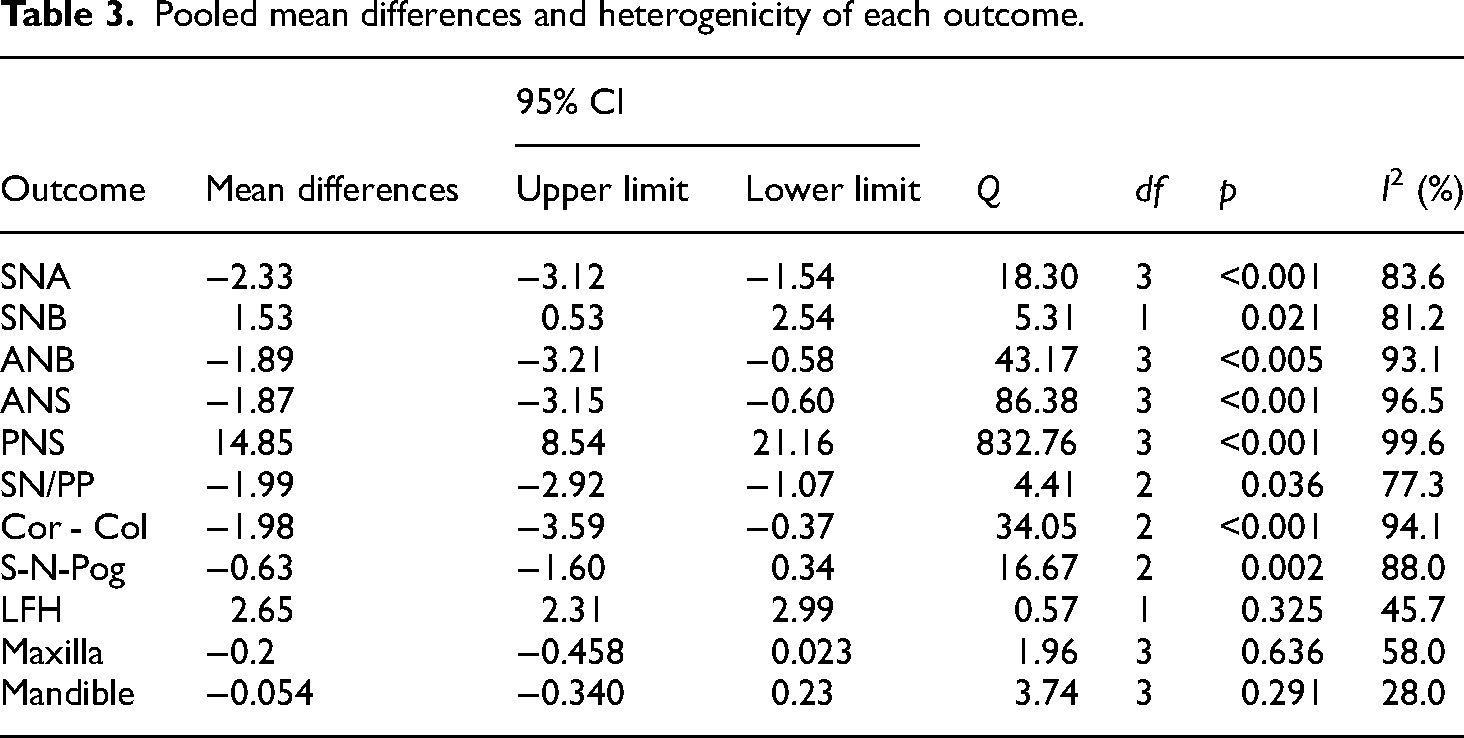
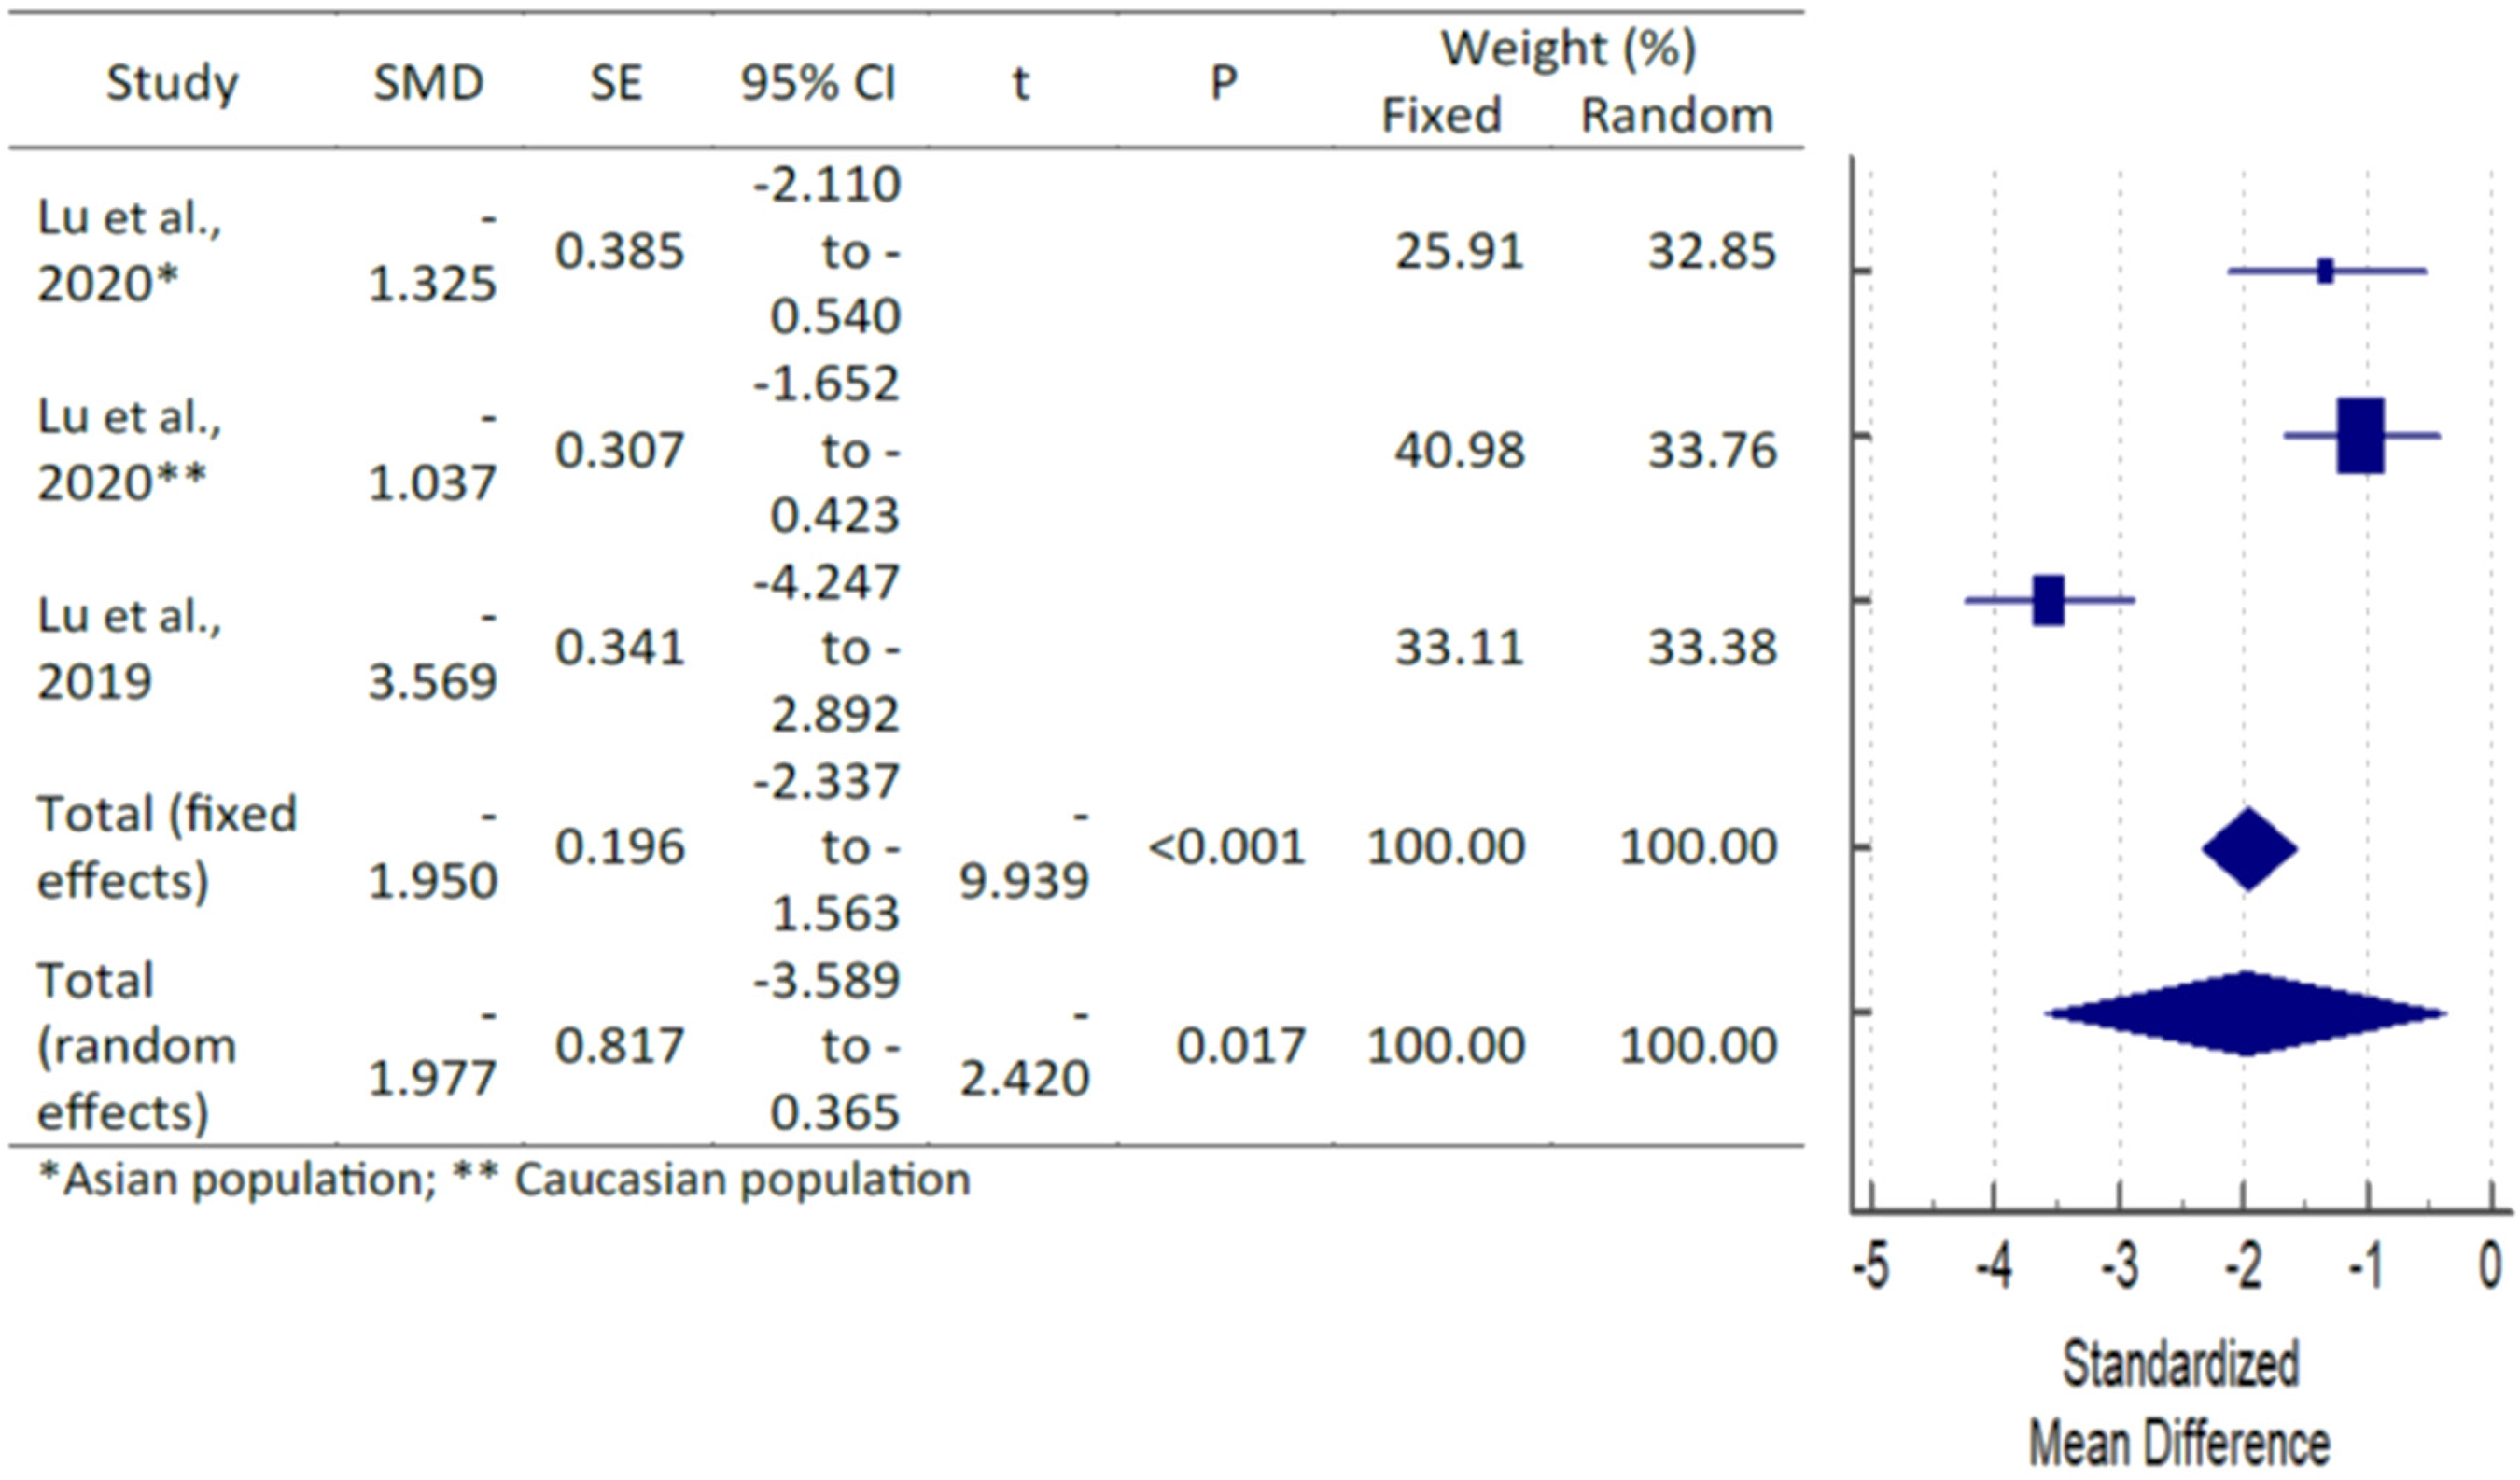
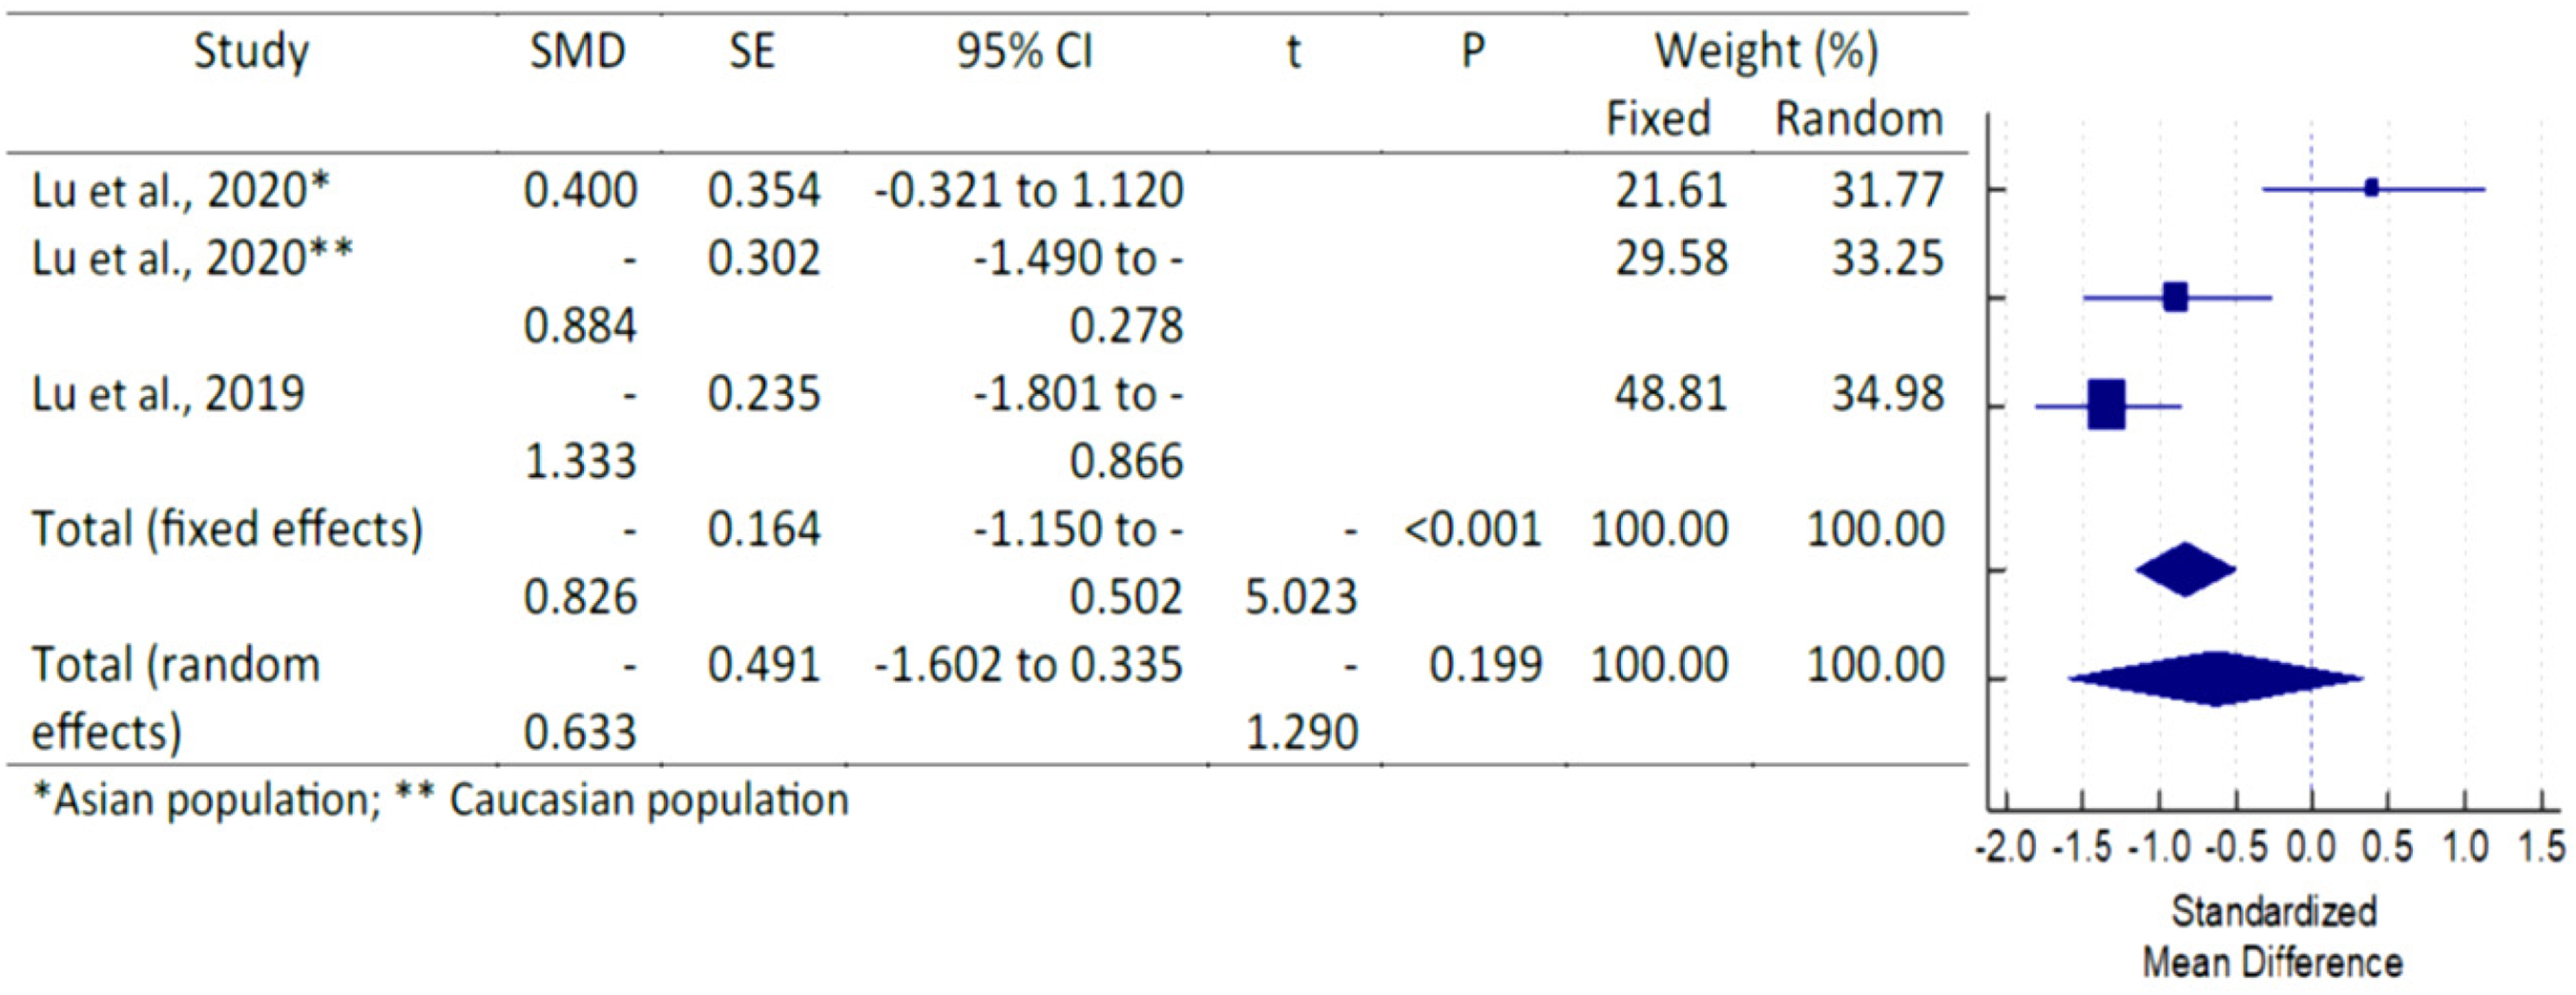
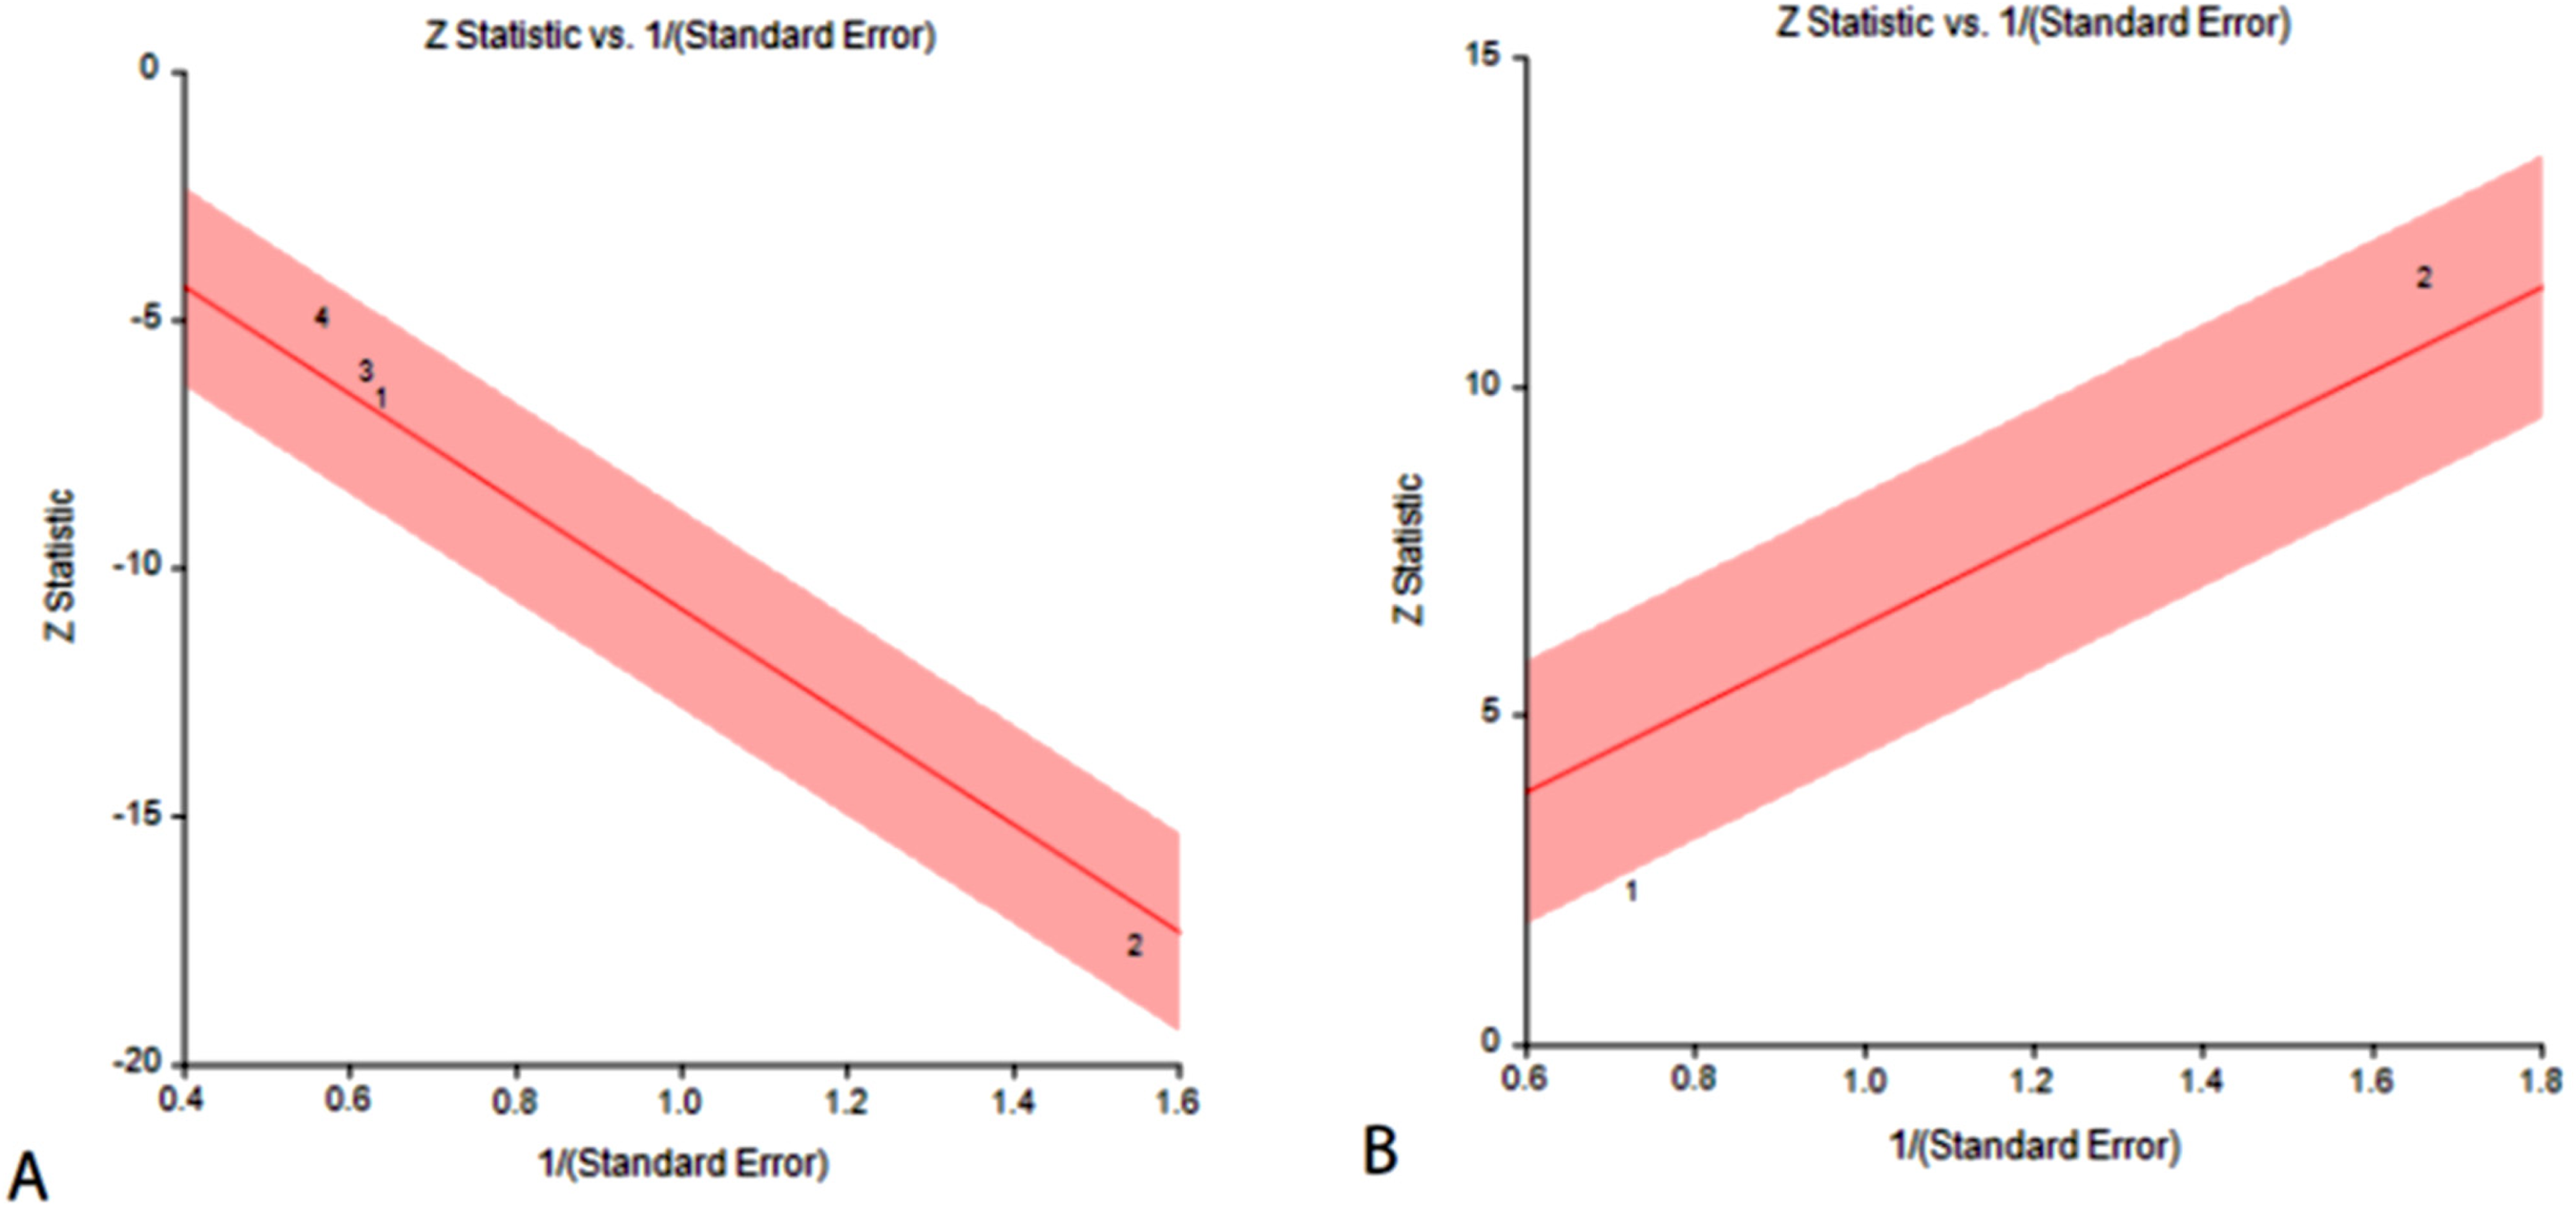
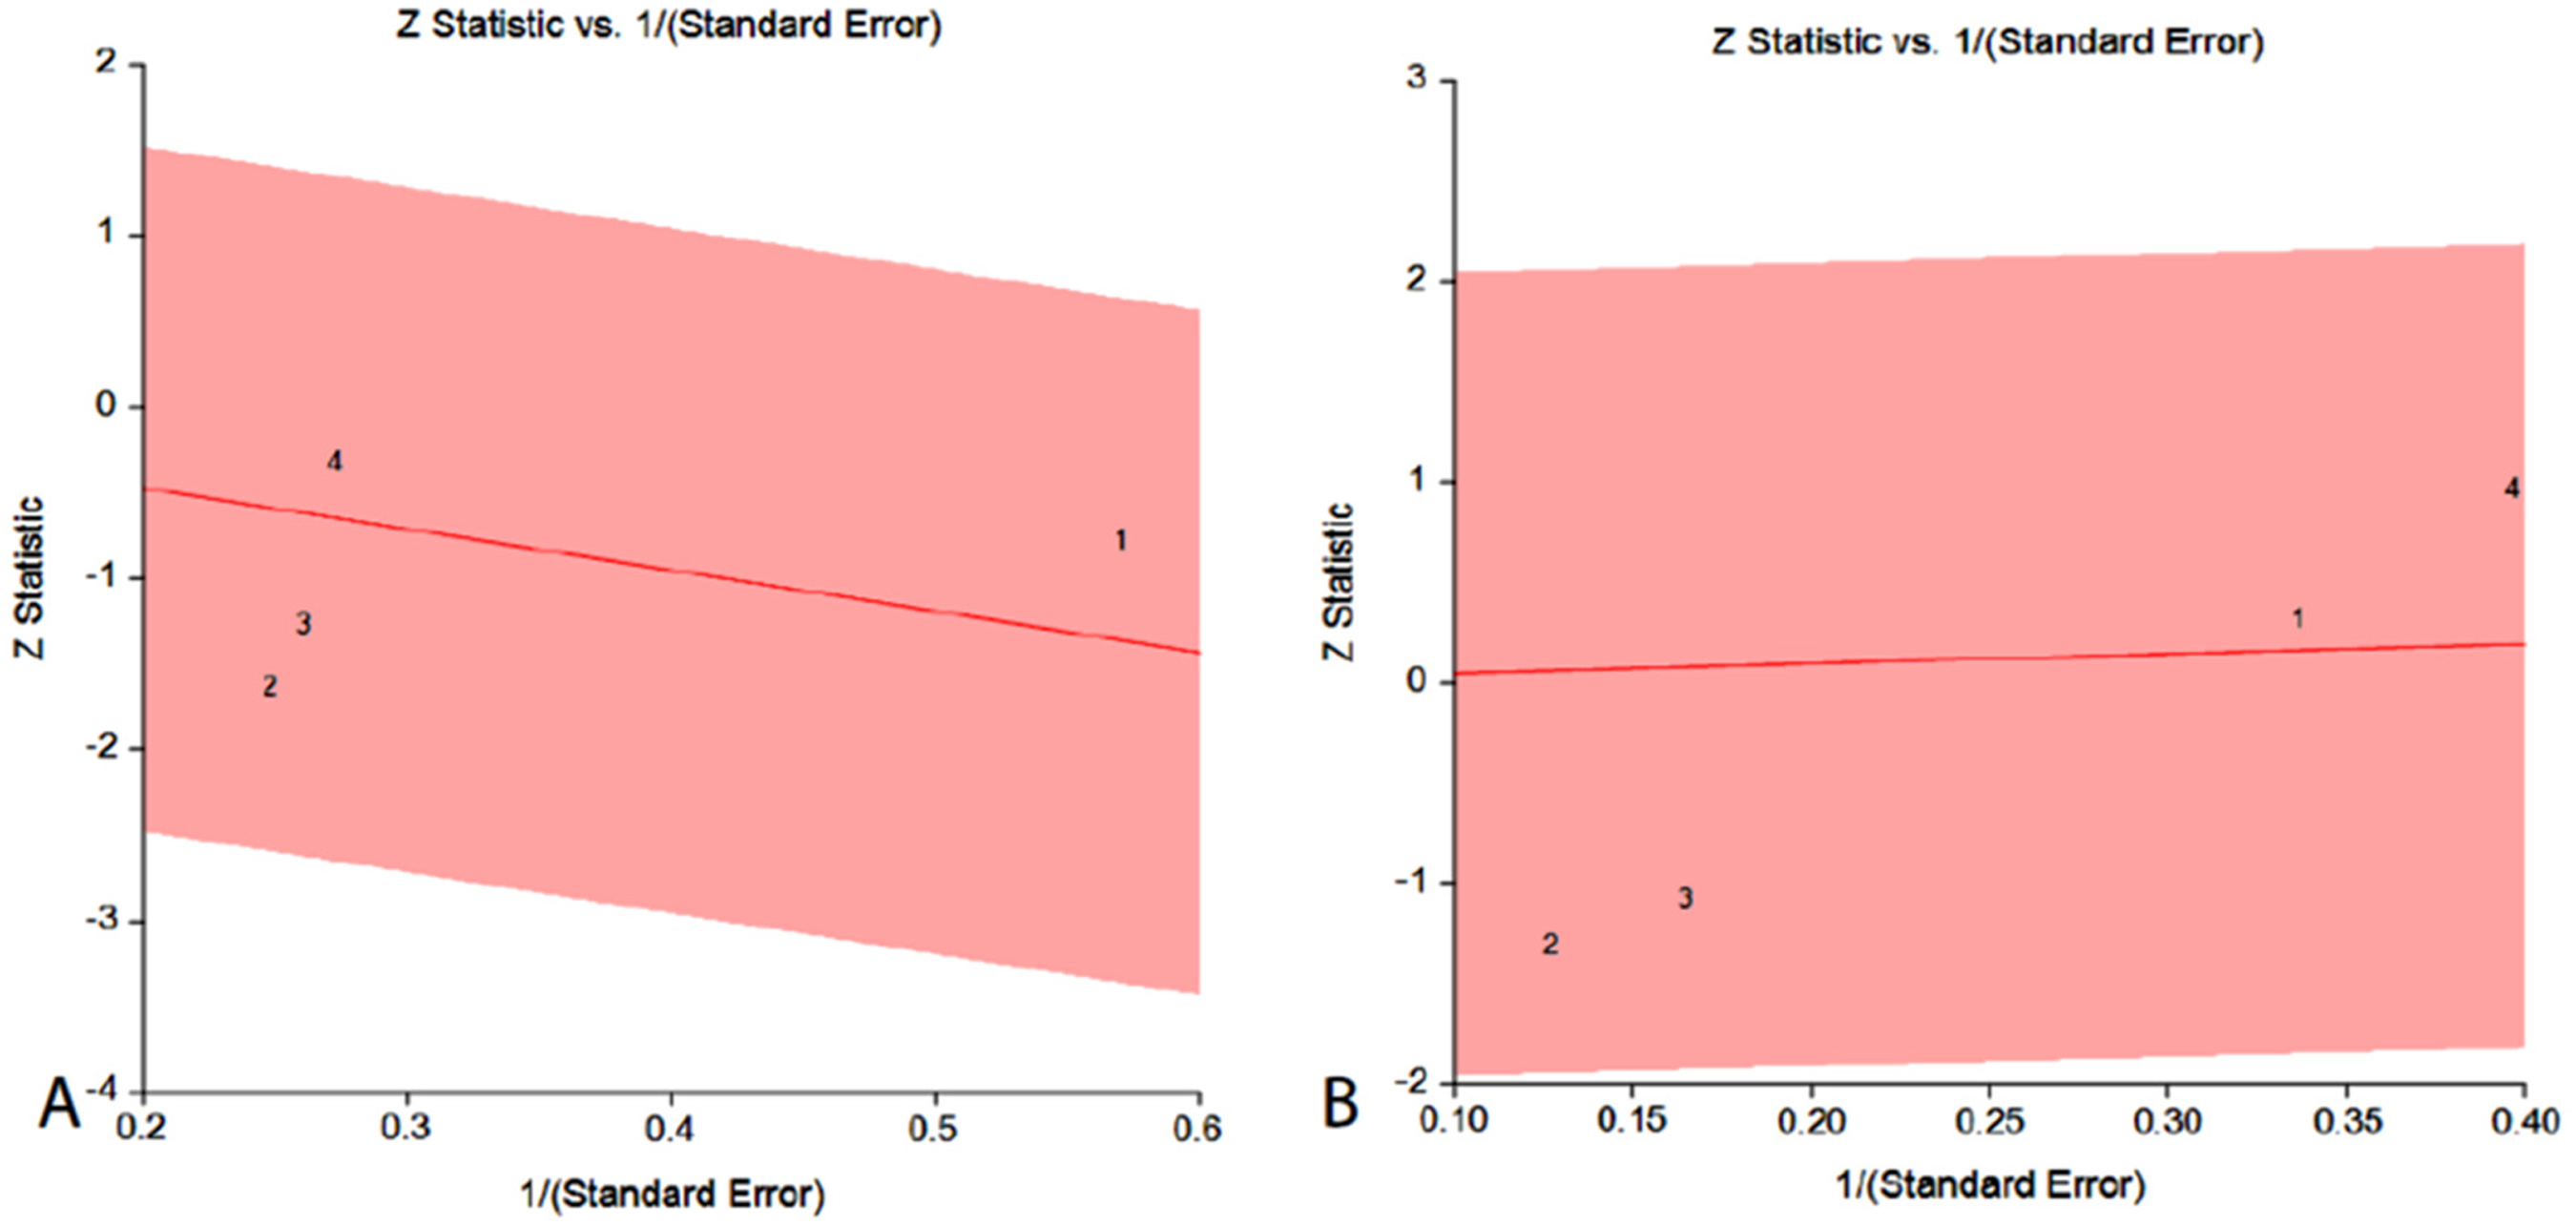
Due to issues with statistical power, there were not enough studies performed to reliably interpret Q statistics. An improved method of quantifying the overlap between effect sizes is provided by the I2 index. Table 4 shows the aggregate mean differences across all outcomes. Forest plots and Galbraith plots were made to illustrate the diversity of the individual studies. Table 3 and Figure 2 show that, with the exception of the mandible and LFH, all outcomes exhibited moderate-to-high heterogeneity (Figures 15A, 15B, 16A, 16B, 17A, 17B, 18A, 18B, 19A, 19B). Statistical subgroup analyses were performed on each outcome to look for indications of variation in effect sizes across categories of interest. Effect size and heterogenicity of the SNA° (Figures 4 and 15A), SNB° (Figures 5 and 15B), ANB° (Figures 6 and 16A), ANS (Figures 7 and 16B), PNS (Figure 8), SN/PP (Figure 9 and 17A), Cor-Col (Figure 10 and 17B), S-N-Pog (Figure 11 and 18A), LFH (Figure 12 and 18B), maxilla (Figure 13 and 19A), and mandible (Figure 14 and 19B) were shown by Forest plot and Galbraith plot. SNA angle showed the largest mean difference (MD = −2.33, p = 0.001) between CS and non-CS patients (MD = −2.33, p = 0.001). In patients with CS, there is a statistically significant decrease in the skeletal relationship between the maxilla and mandible (ANB angle) (MD = −1.89, p = 0.005). Cor - Col effects were observed to cause bilateral condylar morphological changes (MD = −1.98, p = 0.001).

Forest plot for the outcome of SNA.

Forest plot for the outcome of SNB.
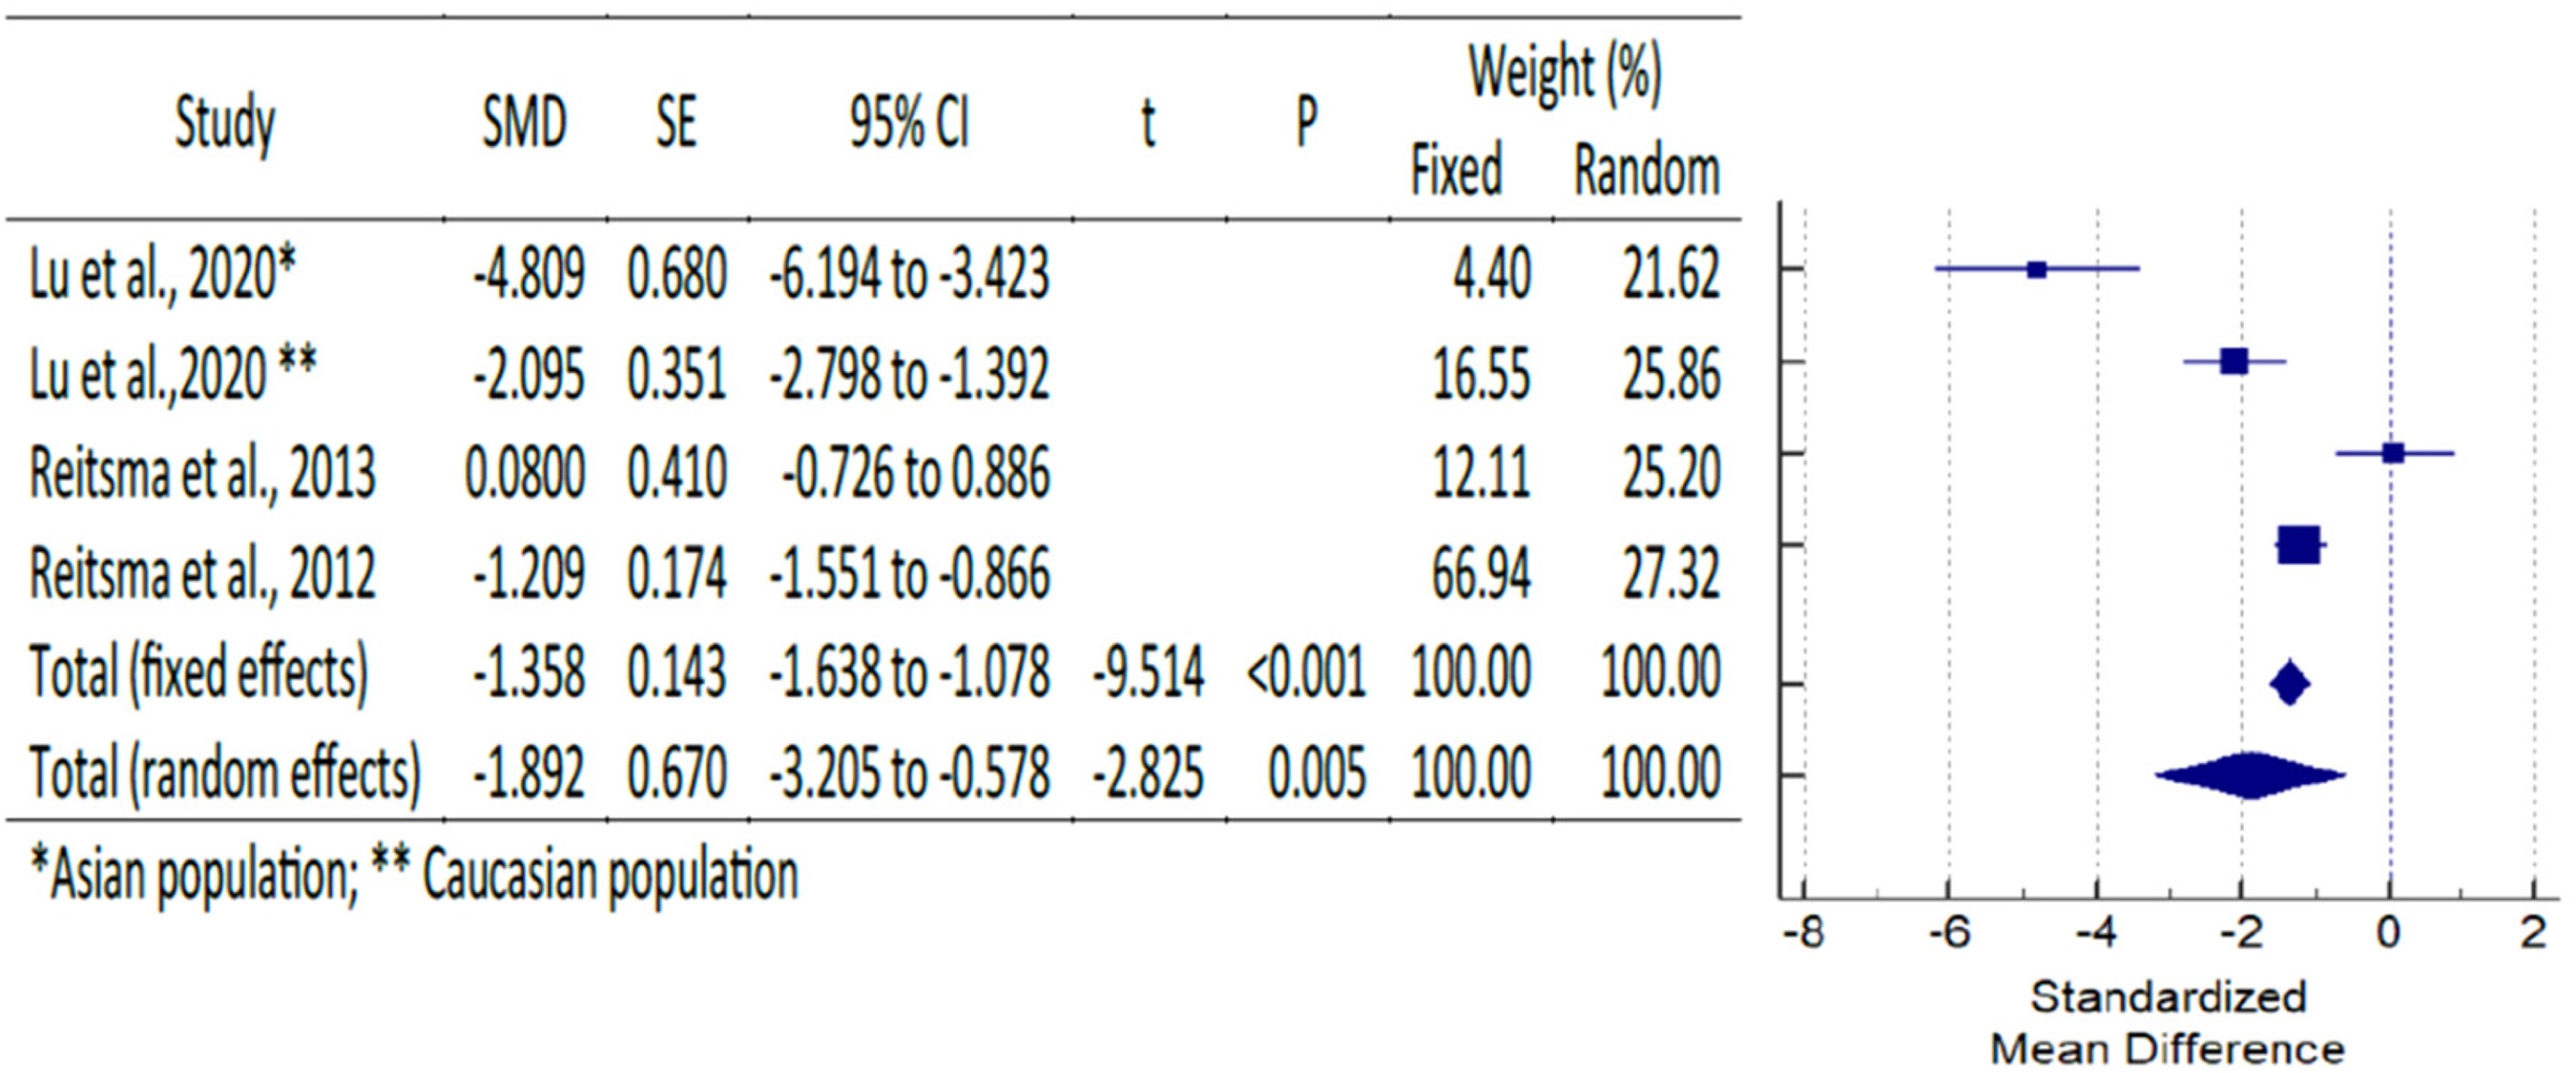
Forest plot for the outcome of ANB.

Forest plot for the outcome of ANS.

Forest plot for the outcome of PNS.

Forest plot for the outcome of SN/PP.
Forest plot for the outcome of Cor- Col.
Forest plot for the outcome of S-N-Pog.

Forest plot for the outcome of LFH.

Forest plot for the outcome of Maxilla volume.

Forest plot for the outcome of Mandibular volume.
Galbraith plot for the outcome of (A) SNA, (B) SNB.

Galbraith plot for the outcome of (A) ANB, (B) ANS.

Galbraith plot for the outcome of (A) SN/PP, (B) Cor- Col.

Galbraith plot for the outcome of (A) S-N-Pog, (B) LFH.
Galbraith plot for the outcome of the volume of (A) Maxilla, (B) Mandible.
Methodological quality assessment of the studies by Newcastle–Ottawa quality scale assessment (NOS).
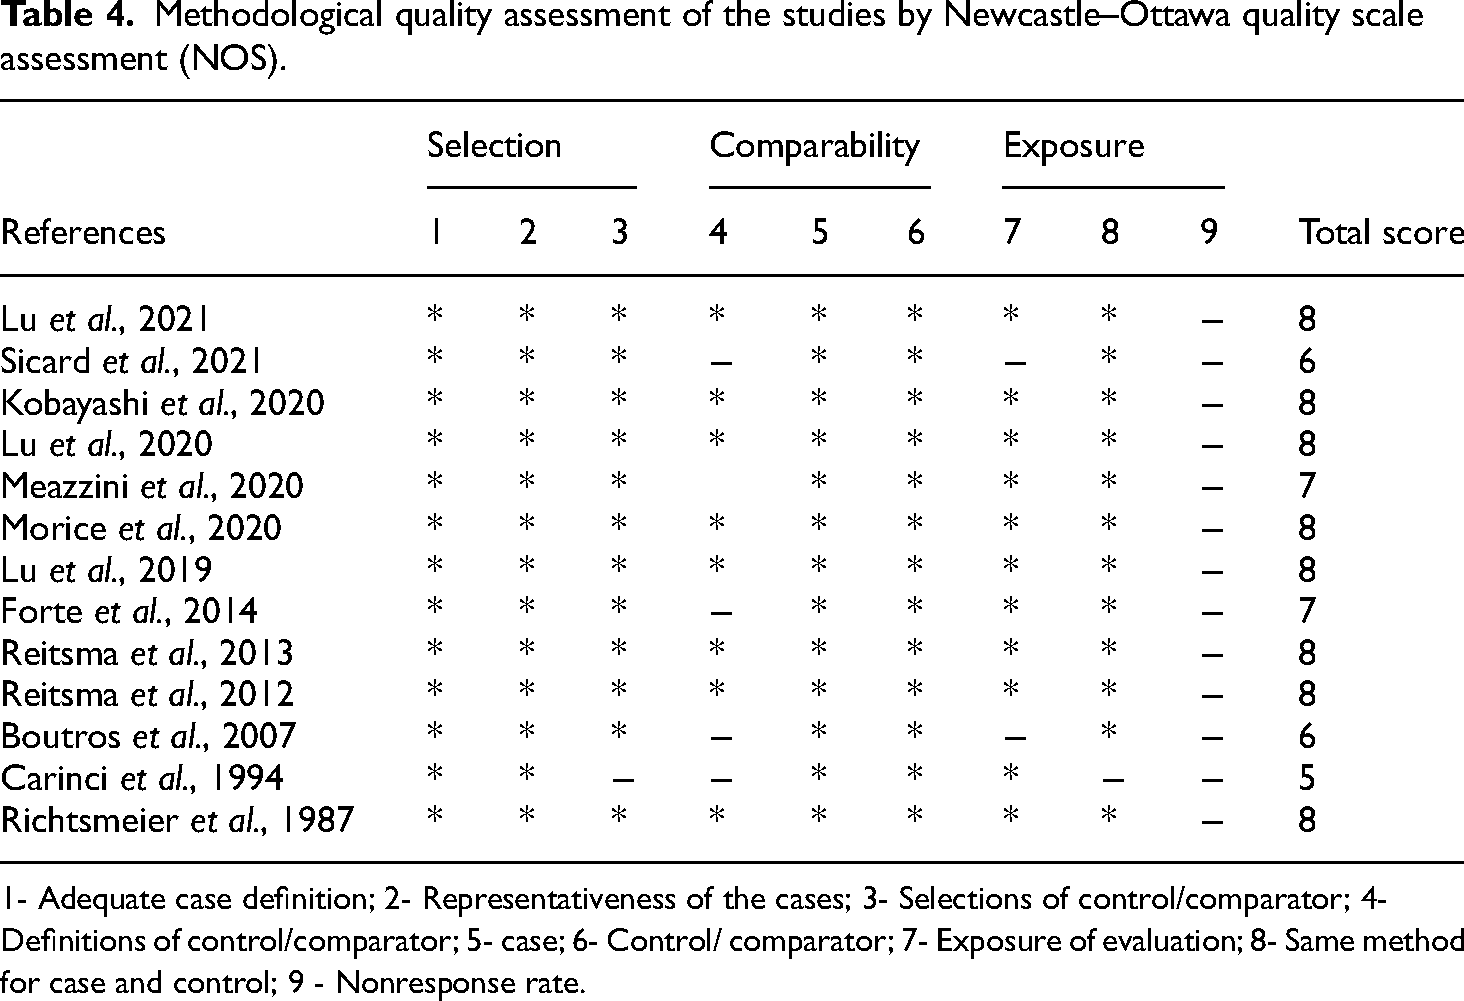
1- Adequate case definition; 2- Representativeness of the cases; 3- Selections of control/comparator; 4- Definitions of control/comparator; 5- case; 6- Control/ comparator; 7- Exposure of evaluation; 8- Same method for case and control; 9 - Nonresponse rate.
Quality of evidence
The NOS method was used to evaluate the quality of the included studies (Table 4). 9 There was a total of 14 articles, 8 of which10,12,14,15,19–22 received a perfect score of 8. A funnel plot was made to show the prevalence of publication bias in the studies (Figures 20 and 21).

Funnel plot for the outcome of (A) SNA, (B) SNB, (C) ANB, (D) ANS, (E) PNS.

Funnel plot for the outcome of (A) SN/PP, (B) Cor-Col, (C) S-N-Pog, (D) LFH, (E) Maxilla, and (F) Mandible.
Discussion
The purpose of this meta-analysis was to evaluate the CFC of CS patients in relation to that of patients who did not have CS and to the general population. To make sure no English-language articles were missed that might have contained information pertinent to the work's hypothesis, it was decided not to limit the search to a specific time period in which they were published. Six studies met the criteria for the meta-analysis, and CFC was used in all of them; however, only measurements that were repeated in at least two articles were considered for the analysis. No more than four works could share a criterion under any conditions. In light of this, the results of this meta-analysis should be interpreted with caution.
Although the SNA angle was found to be smaller in CS patients, there were no statistically significant differences between the groups in the anteroposterior position of the maxilla. The SNA angle, which joins the maxilla to the base of the skull, is significantly reduced in CS patients.19,20 An abnormal cranial base can lead to incorrect interpretations of the antero-posterior and vertical CFC of the mandible and maxilla. Therefore, the Frankfort plane is widely used as a standard for Cfc measurements, as recommended by several authors. 23 Due to a geometric effect, a smaller maxilla in CS may result in an SNA that is comparable to that of controls because the N point will be located further posteriorly due to the reduced anterior cranial base.20,24
Patients of Asian and Caucasian descent with CS showed similar reductions in maxillary and mandibular volume. 22 Maxillary hypoplasia was confirmed in the sagittal plane by the significantly shorter limbs of CS when compared to control groups.14,25 Many people with craniosynostosis have smaller than average maxillary and mandibular volumes, but this disparity appears to be age-related. 22 Bilateral coronal syndrome patients have about a 30% smaller maxillary volume than typically developing children at the age of 11 months. Maxillary volume typically begins to approach normal around 17 months of age, though this can vary depending on the type of cranial suture synostosis. Significantly, volume deficiencies in the maxilla and mandible were reduced by the same amount in both Asian and Caucasian Crouzon syndrome patients.10,16,22
Though CS is not likely to have an indirect effect on orbital sphere expansion, it does limit the volume of the orbital cavity. 10 This suggests that the growth of the orbit is being hampered by synostosis of the cranial vault suture to the CS. Squamosal synostoses shifted the maxilla backward, but they did not prevent the antero-posterior growth of the maxilla like sagittal synostoses did. Therefore, the CS is not likely to limit antero-posterior maxillary growth intrinsically, but it does limit anterior maxillary positioning.10,16
Despite having significantly higher values in CS subjects, the SNB angle did not differ statistically between CS and control subjects.19,20 Here, the cranial base is also associated with an increase in SNB angles as a result of shortening. 20 This finding revealed that the cranial base angle of the CS group was greater, which would result in a more anterior mandibular position due to less symphysis projection.19,20,25 Alterations in tooth size could be caused by a mutation that activates FGFR2 in CS. When teeth are developing, FGFR2 controls cell proliferation and epithelial-mesenchymal interactions.26–28 However, further investigation into the gene's function during tooth formation is required. Both the crown height and the labiolingual cervical diameter of the incisors were smaller in Crouzon patients than in the control group (7.8% and 8.6%, respectively).13,29 The primary teeth of Crouzon patients and controls did not differ significantly, according to the author's research. This data suggests that the FGFR2 gene was involved in tooth development at birth only in a minor capacity.13,30
Those with CS had a narrower ANB compared to controls. 20 In CS patients, the LFH ratio was lower, and the SNA angle was greater. Distinctions between the sexes were only detectable at the ANB and SN/PP angles. 19 Skeletal Class III malocclusions are more common in CS subjects because of their smaller ANB angle, which measures the relationship between the maxilla and mandible from anteroposterior.
Lu et al., 22 found that while Asians and Caucasians had similar maxillary lengths, Asians had more retracted ANS and PNS. The maxillae of Asians measured slightly longer when measured from the nasion to the anterior nasion surfaces. These results corroborate the observation made by Chang et al. 31 that the upper midfaces of Asians are more vertically expanded than they are horizontally compressed. Contrarily, the Asian CS patients tended to have a more retracted anterior neck posture. In addition, the study found that the vertical descent of the ANS and PNS was hampered in Asian patients in relation to the severity of the decline in CS. PNS decreased more slowly in Caucasian patients (and by a larger margin than ANS did). Restricting maxillary development in its posterior region can cause the maxillary plane to rotate inferiorly and posteriorly.32,33
Despite the limitations of the study, the significant difference between those with CS and the general population in CFC morphology allows for the possibility of rejecting the null hypothesis. CFC measurements from different studies need to be combined, and different reference planes should be used to estimate the maxilla's and mandible's vertical and anteroposterior positions for the sake of reaching a definitive conclusion. 34 In light of the paucity of studies reporting on each outcome measure, caution is warranted in drawing conclusions. This is due to the fact that there is insufficient research reporting on each terminal metric. Furthermore, the meta-analysis only included a small number of studies, so the conclusion may shift in the future if more studies with a broader range of data are added.
Conclusion
This meta-analysis has some limitations, but it is still possible to draw the conclusion that the mean values of SNA, ANB, ANS, SN/PP, CoR-CoL, S-N-Pog, and maxillary and mandibular volume were all significantly lower in people with CS compared to the control group. There was a statistically significant difference in SNB between the patients with and without CS. Additionally, they have shorter skull bases, wider dental spacing, more V-shaped maxillary arches, a more dorsally positioned mandible, cleft palates, and open bites. The maxilla and mandible of someone with Crouzon syndrome have slightly less space than normal. Extreme caution should be exercised when treating these patients with maxillary orthodontics. Patients with CS may benefit from computed tomography (CT) scans when deciding whether to undergo orthodontic treatment alone or to have their mouths surgically assisted in their expansion.
Footnotes
Author contribution
Conception: MKA, AAA, KKG, SMM; Design: MKA, AAA, HA, HJA, SV, KKG, SMM, AAS, AF; Literature search: MKA, KKG, SMM; Investigation: MKA, KKG, SMM; Analysis: MKA, KKG, SMM; Manuscript draft preparation: MKA, AAA, HA, BK, HJA, SV, KKG, SMM, AAS, AF; Final manuscript writing: MKA, AAA, HA, BK, HJA, SV, KKG, SMM, AAS, AF; Manuscript approval: MKA, AAA, HA, BK, HJA, SV, KKG, SMM, AAS, AF.
Declaration of conflicting interests
The author(s) declared no potential conflicts of interest with respect to the research, authorship, and/or publication of this article.
Funding
The author(s) received no financial support for the research, authorship, and/or publication of this article
Ethics statement
Given that this is a meta-analysis and systematic review, no IRB approval is necessary. Registration number CRD4202128291 indicates that this review has been submitted to PROSPERO, the International Prospective Register of Systematic Reviews.
Author biographies
Mohammad Khursheed Alam is a PhD in Orthodontics and Dentofacial Orthopedics and FDS RCPS (UK). His area of research is orthodontics focusing on cleft lip and palate, craniofacial growth and anomalies, Laser Orthodontics, etc.
Ahmed Ali Alfawzan is an Associate Professor in Orthodontics and Dentofacial Orthopedics. His area of research is orthodontics focusing on craniofacial growth and anomalies.
Huda Abutayyem is a PhD in Orthodontics. Her area of research is Multidisciplinary Orthodontics.
Bushra Kanwal holds MDS in Orthodontics and MOrth from Edinburgh. Her area of research is Multidisciplinary Orthodontics.
Haytham Jamil Alswairki is a MDS in orthodontics. Currently a Ph.D. fellow in Orthodontics at Universiti Sains Malaysia. His area of research is cleft lip and palate and clinical Orthodontics.
Swati Verma holds a MDS in Orthodontics. Her area of research is Multidisciplinary Orthodontics and Traumatic Dental Injuries.
Kiran Kumar Ganji is an Assistant Professor in Periodontology. His area of interest is regenerative periodontal therapy, laser therapy, and advanced implant therapy.
Manay Srinivas Munisekhar holds a MDS in Oral Pathology, and is a Lecturer. His area of research includes dental pathology, anatomy, cell biology, and quality control in Dentistry.
Ammar A Siddiqui is an Associate Professor of Dental Public Health. His area of research includes population health studies, patient perception towards dental needs & evidence-based research for better decision-making for clinicians. Siddiqui is a diplomate of the royal college of surgeons of England and also holds MDPH from USM, Malaysia.
Ayesha Fahim holds a PhD in Oral Biology, is an Associate Professor of Oral Biology. Her area of research includes dental anatomy, oral microbiology, cell biology, and medical education.