
Abstract
The identification of the film on cotton is of great significance for the improvement of cotton quality. Most of the existing technologies are dedicated to removing colored foreign fibers from cotton using photoelectric sorting methods. However, the current technologies are difficult to identify colorless transparent film, which becomes an obstacle for the harvest of high-quality cotton. In this paper, an intelligent identification method is proposed to identify the colorless and transparent film on cotton, based on short-wave near-infrared hyperspectral imaging and convolutional neural network (CNN). The algorithm includes black-and-white correction of hyperspectral images, hyperspectral data dimensionality reduction, CNN model training and testing. The key technology is that the features of the hyperspectral image data are degraded by the principal component analysis (PCA) to reduce the amount of computing time. The main innovation is that the colorless and transparent film on cotton can be accurately identified through a CNN with the performance of automatic feature extraction. The experimental results show that the proposed method can greatly improve the identification precision, compared with the traditional methods. After the simulation experiment, the method proposed in this paper has a recognition rate of 98.5% for film. After field testing, the selection rate of film is as high as 96.5%, which meets the actual production needs.
Keywords
Introduction
Cotton plays an important role in the military and people's livelihood. 1 To increase the cotton yield, drip irrigation under film is an investable technology for planting cotton.2,3 However, cotton is easily mixed with the film during the mechanical picking process. 4 This will affect the quality of cotton. Therefore, it is important to identify the film on cotton to increase the economic value of cotton. 5
The traditional techniques for removing film can be divided into three types, including mechanic sorting, 6 electromagnetic separation, 7 and photoelectric sorting. 8 Mechanic sorting is a relatively early and traditional agricultural sorting method, and roll winding and gas–solid separation are the most widely used technologies. Kan et al. designed a mesh roller-type cotton and film remnant separator, and the discrete phase model was deployed to analyze the separation principle of unginned cotton and film remnant. 9 Due to the difference in the charge capacity and quality between the cotton and the film, electromagnetic separation is applied to the separation of film and cotton. Zhang et al. established a solid model of electrostatic separation between mechanical cotton harvesting to remove the particles effectively. 7 With the application of image sensors to the field of agricultural sorting, photoelectric sorting technology has been widely promoted. Zhao et al. built an efficient recognition system based on a light-emitting diode (LED) light source and charge-coupled device (CCD) camera to accurately recognize foreign fibers mixed in cotton. 10
However, current technologies have low identification accuracy and cannot remove small-sized film with the characteristics of a colorless and transparent effect. Besides, traditional recognition methods may be easily affected by the external uncertain environment. Therefore, it is very important to investigate a reliable and stable method to satisfy the accurate identification of the film on cotton.
As an emerging nondestructive imaging technology, hyperspectral imaging technology integrates spatial and spectral information of given samples based on a large number of narrow bands. Nowadays, hyperspectral imaging technology has achieved remarkable results in medicine, food, and so on.11,12 Zhou et al. proposed a novel method for the classification of AFB1 concentration of a single maize kernel, based on near-infrared (NIR) hyperspectral imaging. 13 Ji et al. proposed a classification method for potato selection, based on the combination of hyperspectral imaging technology and a multi-class support vector machine (MSVM). 14
Classical processing methods for the hyperspectral data include partial least squares (PLS), support vector machine (SVM), and artificial neural network (ANN). Guo et al. developed a visible near-infrared (VNIR) hyperspectral imaging system to realize the rapid and precise quantitation of adulterated rice by partial least squares regression (PLSR). 15 Peter Lasch et al. systematically investigated the level of taxonomic resolution achievable through the application of FT-IR microspectroscopy, microspectroscopic imaging, and optimized ANN. 16 Zhang et al. focused on the detection and classification of common types of foreign matter hidden within the cotton lint by a short-wave NIR hyperspectral imaging system with linear discriminant analysis (LDA) and a SVM. 17
The above methods have achieved good results, but they require human interference and have limitations in feature extraction. Deep learning can automatically learn and optimize fault features, compared with classical hyperspectral data processing methods.18,19 Convolutional neural network (CNN) is one of the most common deep neural network models, which has been widely applied in agricultural sorting. Amin Nasiria et al. proposed a novel and precise assessment of egg sorting using a deep CNN. 20 Nevertheless, the identification of the film on cotton based on CNN is seldom investigated.
In this paper, an intelligent identification method is proposed to remove the plastic film on cotton based on short-wave NIR hyperspectral imaging and CNN. The main contributions of this paper are listed as follows:
An efficient data processing method is proposed for hyperspectral images of the film. In specific, principal component analysis (PCA) is deployed to process spatial and spectral information of hyperspectral images to reduce the difficulty and cost of network training. An intelligent identification for improving the accuracy of hyperspectral image recognition based on CNN. Especially, CNN can automatically extract the spectral reflectance characteristics of hyperspectral image data and realize quick and accurate identification of the film on cotton.
The remaining part of the paper is organized as follows. In Section 2, materials and hyperspectral imaging systems are introduced. Section 3 illustrates the specific process of sorting and identifying the film. Section 4 presents the experiment and discussion. Finally, the conclusions are drawn in Section 5.
Materials
Experimental materials
Experimental materials: 10 kg of machine-harvested cotton from southern Xinjiang, 50 pieces of film fragments of different sizes selected by skilled workers.
Imaging instruments and hyperspectral imaging system
Imaging instruments: The Gaia Sorter hyperspectral imager (Dualix Instruments Co., Ltd.), which is matched with the Image-λ “Spectral Image” series of cameras and the Gaia Field series of hyperspectral cameras.
As shown in Figure 1, the hyperspectral imaging system is mainly composed of a conveyer belt, driving box, halogen lamp, hyperspectral camera, and computer. The conveyer belt is made of black rubber, which can effectively reduce the influence of reflected light as a background. The camera model is “Image-λ-N25E-SWIR” short-wave infrared camera (the spectral range is 1000–2500 nm).

Hyperspectral imaging system.
A straight-line image of the target can be done by the imaging spectrometer each time. During this process, the light is split into spectral components corresponds to the pixels on the line array. In this case, the structure of each image from a spectral camera includes linear pixels in one dimension (spatial axis) and spectral distribution (the intensity of light in spectral elements) in another dimension (spectral axis). As shown in Figure 1, the hyperspectral images of the cotton mixed with film can be acquired by a spectral camera, which has a resolution of 384 pixels × 600 pixels, a spectral range of 1000 to 2500 nm, and 288 bands.
Algorithm environment
The hardware used in this experiment is Intel®Core(™)i7-6700 CPU,16 GB RAM, and NVIDA FeForce RT X 2080Ti, 11 GB. The software environment is tensorflow-gpu 2.0.0, spectral 0.22.1, sklearn 0.23.2, matplotib 3.2.2, kears 2.3.1, cuda 10.2.89, cudnn 7.6.5. Python3.6 is used as the programming language.
Methods
The process of the proposed method is shown in Figure 2. Firstly, the hyperspectral images from film on cotton are obtained by the hyperspectral camera. Secondly, the PCA-CNN-based algorithm is used to reduce the dimensionality of the hyperspectral image data and identify the film on cotton. Finally, this algorithm is embedded into the cotton sorting equipment, in which the coordinates of the film are input into the blowout valve to complete its rejection.
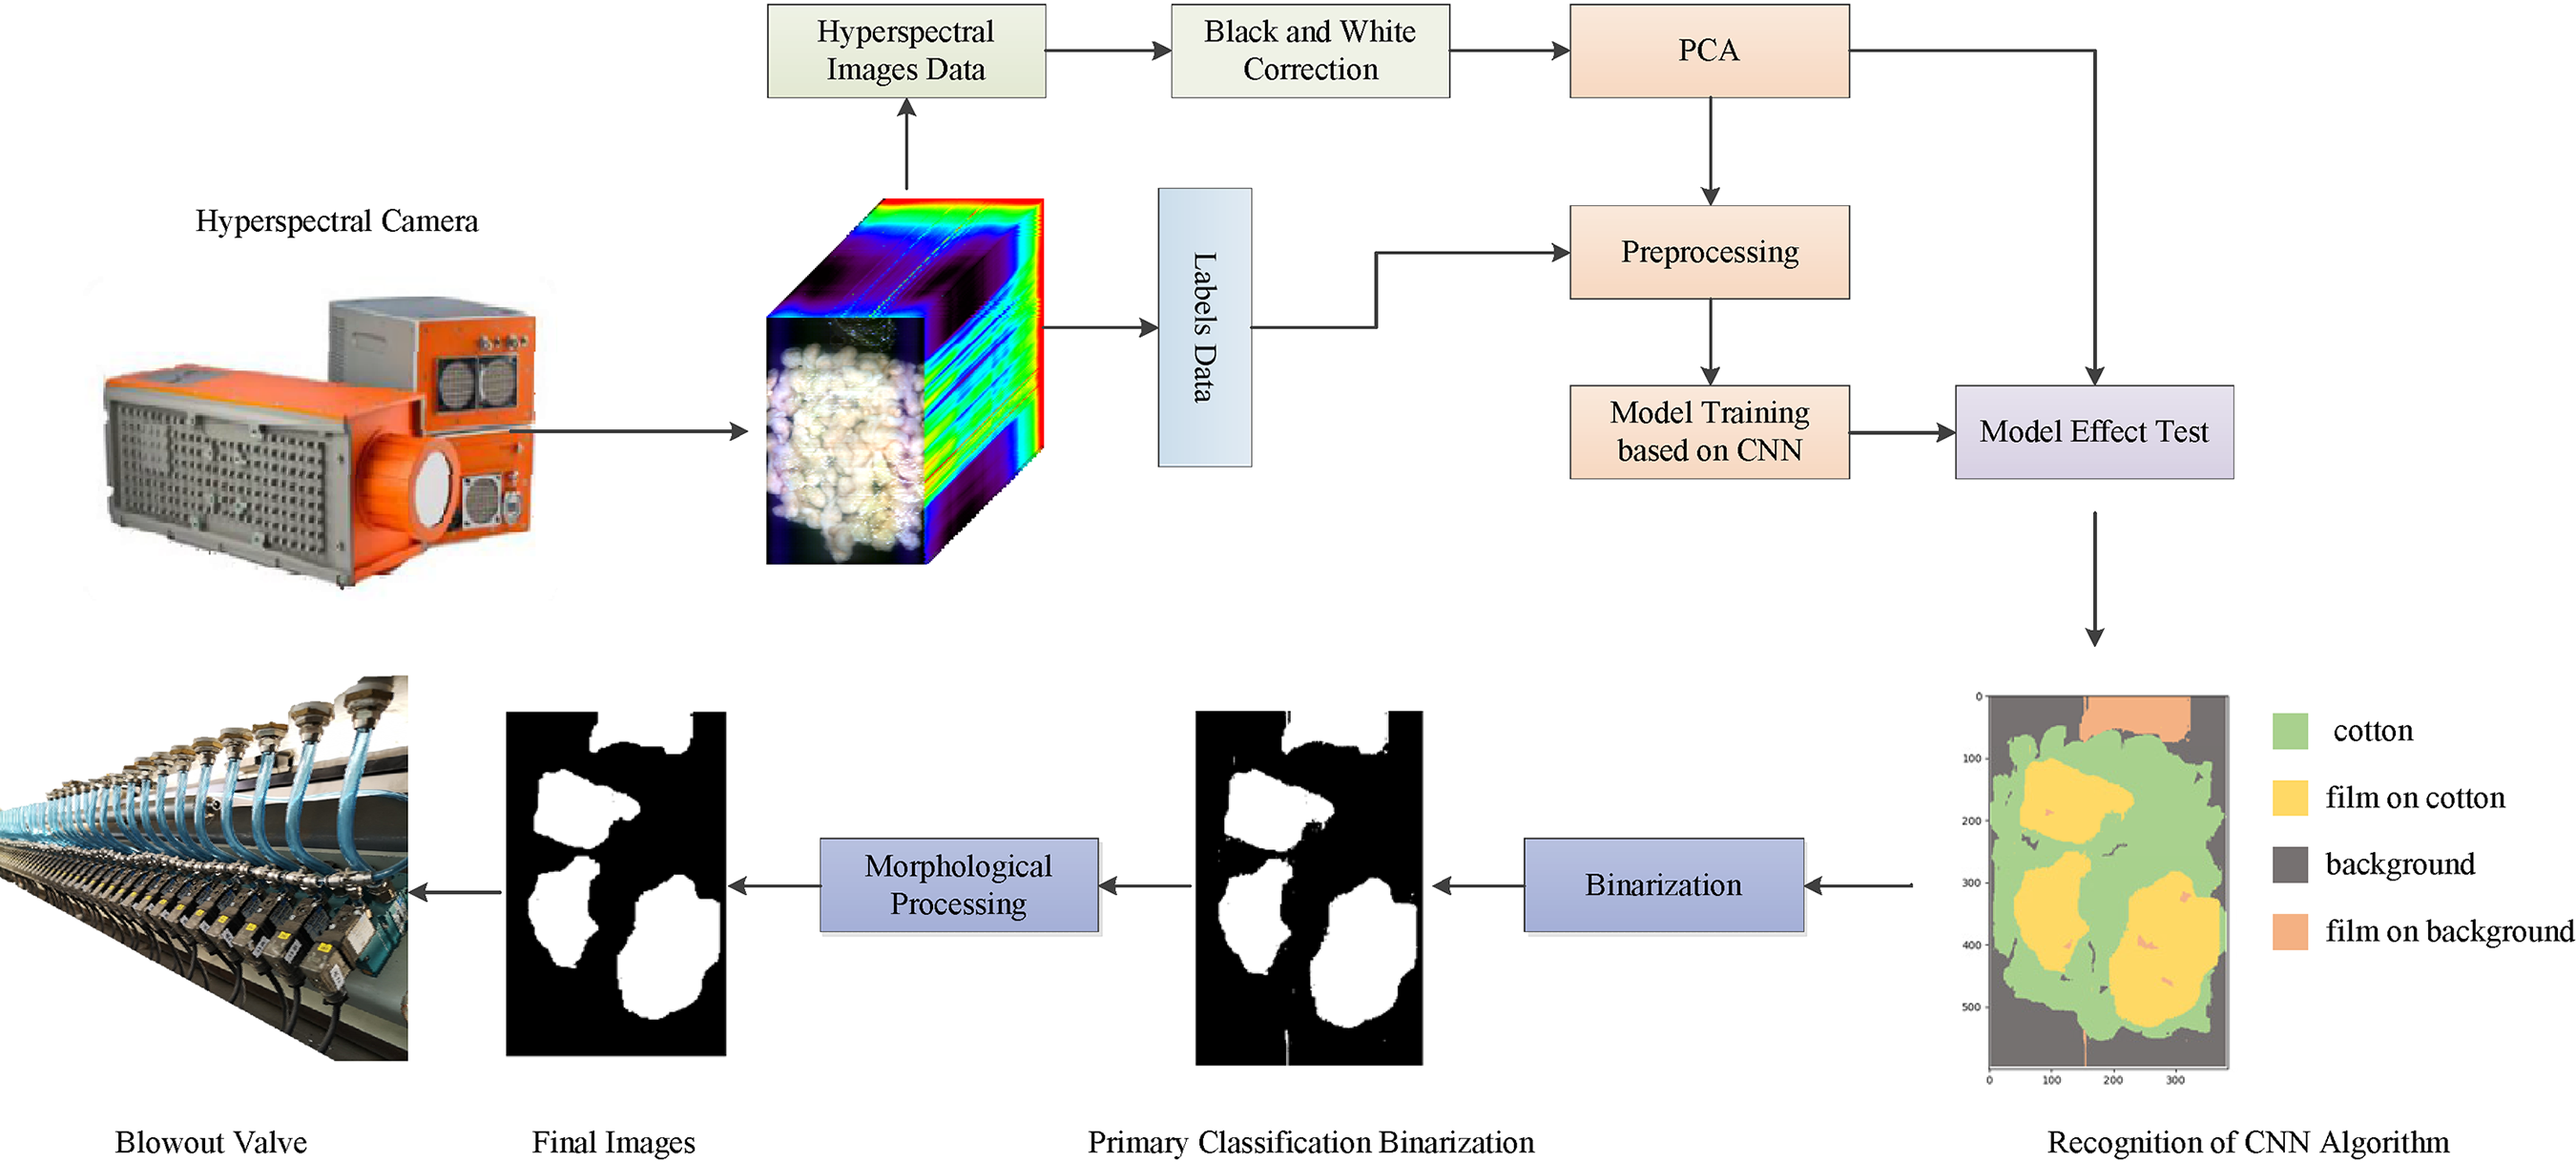
Structural chart of an algorithm for identifying.
The PCA-CNN-based algorithm mainly includes three parts: Black and white correction of hyperspectral images, Dimensionality reduction and preprocessing, Model training based on CNN.
Black and white correction of hyperspectral images
Due to the influence of the illumination angle, intensity and dark current in the camera, a lot of noises may be mixed in the hyperspectral images. So the spectral image needs to be corrected before training, the raw hyperspectral images can be corrected by:

Dimensionality reduction and preprocessing of hyperspectral images data
The application of hyperspectral imaging technology is becoming more and more extensive. However, hyperspectral data have many dimensions, large data volume and redundant information, which will affect the subsequent processing effect if the full-spectrum data is directly utilized. For this reason, the hyperspectral data need to be reduced in dimensionality. PCA, 21 LDA, 22 and independent principal component analysis (ICA) 23 are common dimensionality reduction methods, which can be used to reduce the dimensionality of hyperspectral images data. Among them, the PCA algorithm has the advantages of lower complexity, smaller computation and shorter computation time, which is selected to reduce the dimensionality of the hyperspectral data in this paper.
PCA also named as eigenface method, is a mathematical method for reorganizing information in a data set of samples. 24 The main goal is to reduce the large dimensions of space data to the dimensions of the smallest spaces. 25 PCA can reduce data by geometrically projecting the eigenvectors onto lower dimensions to find the best summary of the data using a limited number of principal components, which reduces the amount of data computation while avoiding the loss of primary information.26,27
The main steps of dimensionality reduction and preprocessing of hyperspectral image data based on PCA are shown in Figure 3.

Hyperspectral images data based on PCA.
Data preprocessing
In this step, the hyperspectral data of each band is converted into a one-dimensional vector. Assuming that the hyperspectral data has a total of N bands and the resolution is
The band i can be expressed as:

Calculate feature space
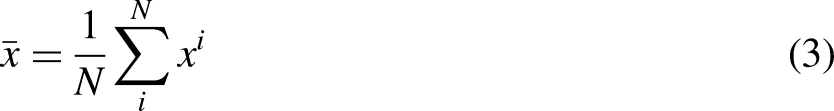
The average vector of all bands can be calculated as:


Projection and similarity test
The difference between each band and the average band is projected vectorially into the feature space, and the feature vector i can be expressed as:


Structuring a neural network
As a feed-forward neural network, CNN is suitable to handle the over-fitting problems in model training. Usually, the CNN consists of an input layer, a convolutional layer, a pooling layer (also called a sampling layer), a fully connected layer and an output layer.28,29
The common CNN-based hyperspectral classification algorithms are one-dimensional convolutional neural network (1D-CNN), two-dimensional convolutional neural network (2D-CNN), and three-dimensional convolutional neural network (3D-CNN). 30 1D-CNN is only used to extract spectral information. 3D-CNN can extract spatial and spectral features with high recognition accuracy. However, compared with 1D-CNN and 2D-CNN, 3D-CNN increases the computational complexity and is not conducive to the training of large data models. 31 To reduce the training cost while ensuring recognition accuracy, 2D-CNN is used in this paper to identify hyperspectral images.
The typical structure of the 2D-CNN is shown in Figure 4, the convolutional layer and the pooling layer are alternately arranged. Each neuron of the output feature surface in the convolutional layer is locally connected to its input. The corresponding connection weight and the local input are weighted and summed. By this operation, the input value of the neuron can be obtained by adding a bias.

Structure of 2D-CNN.
Convolutional layer
In the convolutional layer, multiple convolution kernels are used to convolve with the input image. A series of feature maps are obtained through an activation function after biasing, which can be expressed by


Pooling layer
The depth of the cell matrix of the pooling layer will not be deeper than the previous layer, but the size of the matrix can be reduced in the height and width directions. Meanwhile, the invariance of the feature scale can be guaranteed to a certain extent. Moreover, the addition of the pooling layer can reduce the number of parameters in the entire neural network, which can also prevent overfitting and improve the generalization ability of the model.
The common pooling methods include max pooling, mean pooling, stochastic pooling, etc. To reduce the impact of redundant information in the data, the maximum pooling method is used to perform pooling operations on each area of the feature output by the convolutional layer with a size of
Fully connected layer
After the input image is alternately propagated through multiple convolutional layers and pooling layers, it relies on the fully connected layer network to classify the extracted features. For the fully connected layer, the input is the weighted summation of the one-dimensional feature vectors of all features. Then by getting through the activation function, the input can be obtained by:

To avoid the over-fitting problem in training, a regularization method (dropout technology) is used in the fully connected layer. In this case, some hidden layer nodes are disabled and cannot participate in the forward propagation process of CNN. Since a neuron cannot exist independently from other specific neurons, it can reduce the complexity of adapting to each other between neurons and obtain more robust features by this technology.
Training a neural network
As shown in Figure 5, in the preprocessing stage, the hyperspectral data is equally divided into the training set and test set. The training set will be firstly input into the CNN. In this stage, the loss function will be minimized by the stochastic gradient descent method with the constantly updated weight (w) and bias (b). Then the trained model will be applied to the test set to evaluate the recognition accuracies of cotton, film on cotton, background, and film on the background. Finally, the best model parameters will be selected. A commonly used loss function, named multi-class cross-entropy loss function is deployed. It is constituted by the mean square error function, cross-entropy function, negative log likelihood function and so on. It can be presented by:
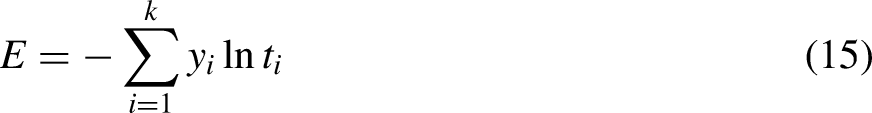
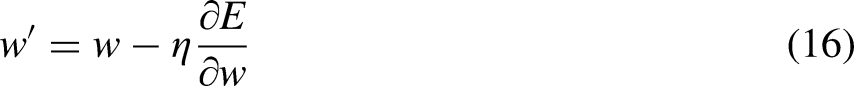


Flow chart of hyperspectral images training.
As shown in Figure 6, the accuracy of training and testing varies with epochs. The training accuracy probability will increase rapidly before the 20 times training. After the 100 times training, the testing accuracy will be maintaining the value of 98.5. Corresponding to the accuracy rate, the model loss is also changing with epochs, shown in Figure 7. When the training is completed, it stabilizes at the lowest value.

Training and testing accuracy.
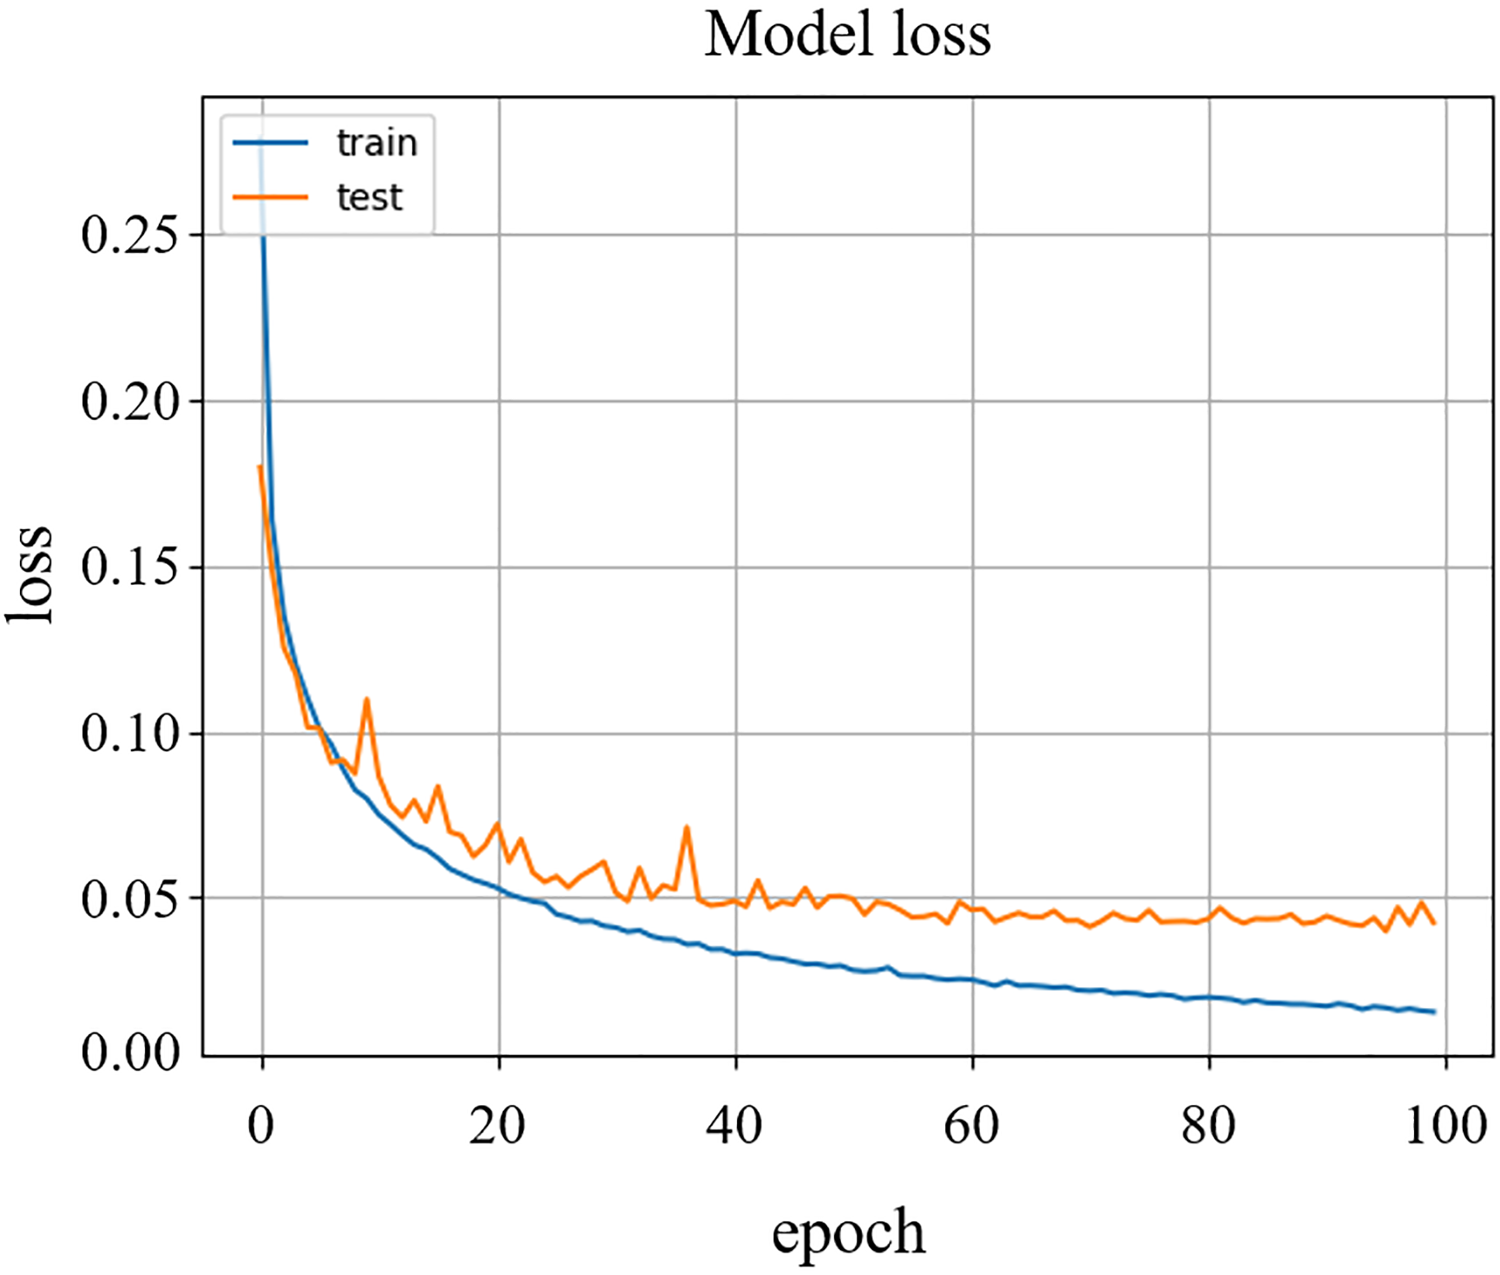
Training and testing loss values.
Results and discussion
Spectral data analysis
As shown in Figure 8, the hyperspectral images are divided into four parts according to spectral reflection characteristics: cotton, film on cotton, background, and film on the background. The four curves represent the average reflectance of these four parts, which have a significant difference in the 1200–2200 nm band and can be used as a basis for film identification. At the same time, it can be seen that the average reflectance difference between cotton and background is obvious, which is very helpful to identify these two components. In addition, the average reflectance difference between ‘cotton and film on cotton’ and ‘background and film on background’ is very close, which adds some difficulty to the subsequent identification. 32

Spectral reflectance curve.
Testing and discussion
The experimental results are shown in Figure 9 and Figure 10. Figure 9 is the original confusion matrix of four parts, the horizontal axis is the predicted value, and the vertical axis is the actual value. The number on the diagonal line represents the number of correct predictions for a certain sample, and the number on the off-diagonal line represents the number of false predictions for a certain sample as other classes. The darker the color of the square, the more samples are predicted to be of the corresponding class.

The original confusion matrix.

Normalized confusion matrix.
According to the original confusion matrix in Figure 9, the overall accuracy (OA) and the KAPPA coefficient can be calculated as shown in Table 1. The OA of the PCA-CNN algorithm is 98.23% and the KAPPA coefficient is 0.9742. The values of OA and KAPPA coefficients are close to 1, indicating high classification accuracy and consistency.
Overall accuracy and KAPPA coefficient.

Figure 10 shows the standardized confusion matrix. The main diagonal represents the average recognition rate for each part. To verify the performance of the algorithm proposed in this paper, the methods of VW-SAE-PSO-ELM, PLS, SVM, ANN, VW-SAE-ELM, SAE-ELM, VW-SAE-ANN and SAE-ANN are used as comparisons. The confusion matrix of various algorithms in literature32,33 is shown in Table 2. The main diagonal in Table 2 shows the average recognition rate of various algorithms for each type of sample. The first row in the table represents the result of the model classification, and the second column is the actual label.
The confusion matrix produced by VW-SAE-PSO-ELM, PLS, SVM, ANN, VW-SAE-ELM, SAE-ELM, VW-SAE-ANN, and SAE-ANN.

By analyzing Figure 10 and Table 2, it can be concluded that the PCA-CNN-based method proposed in this paper achieves a better classification effect for the identification of hyperspectral image data. Here, the reason for a small amount of misclassification of cotton and background is that the edge junction contains the reflection spectrum of cotton and background at the same time. The misclassification of the cotton and the film on the cotton, the background and the film on the background is due to the weak reflection characteristics of the film and the small absorption peak of the weathered film.
In order to distinguish the classification effect more intuitively, the hyperspectral data is converted into a pseudo-color map. In specific, the prediction result is drawn by using the spectral toolkit in the model test, and the result is expressed in the form of a two-dimensional image, shown in Figure 11. The image size is still 384 pixels × 600 pixels. Figure 11(a) is a pseudo-color image of hyperspectral data, Figure 11(b) is an image of manual marking according to the spectral reflectance curve, and Figure 11(c) is a classification effect diagram recognized by the PCA-CNN algorithm. From the perspective of the classification effect, the classification result in Figure 11 is consistent with the confusion matrix data in Figure 10. Because of the weak reflectivity of the film, some of the film on the cotton is recognized as the cotton, and the film on the background is recognized as the background. Since there are a small number of artificial marking errors at the boundary, the trained algorithm model has a misrecognition of pixels and results in noise areas.
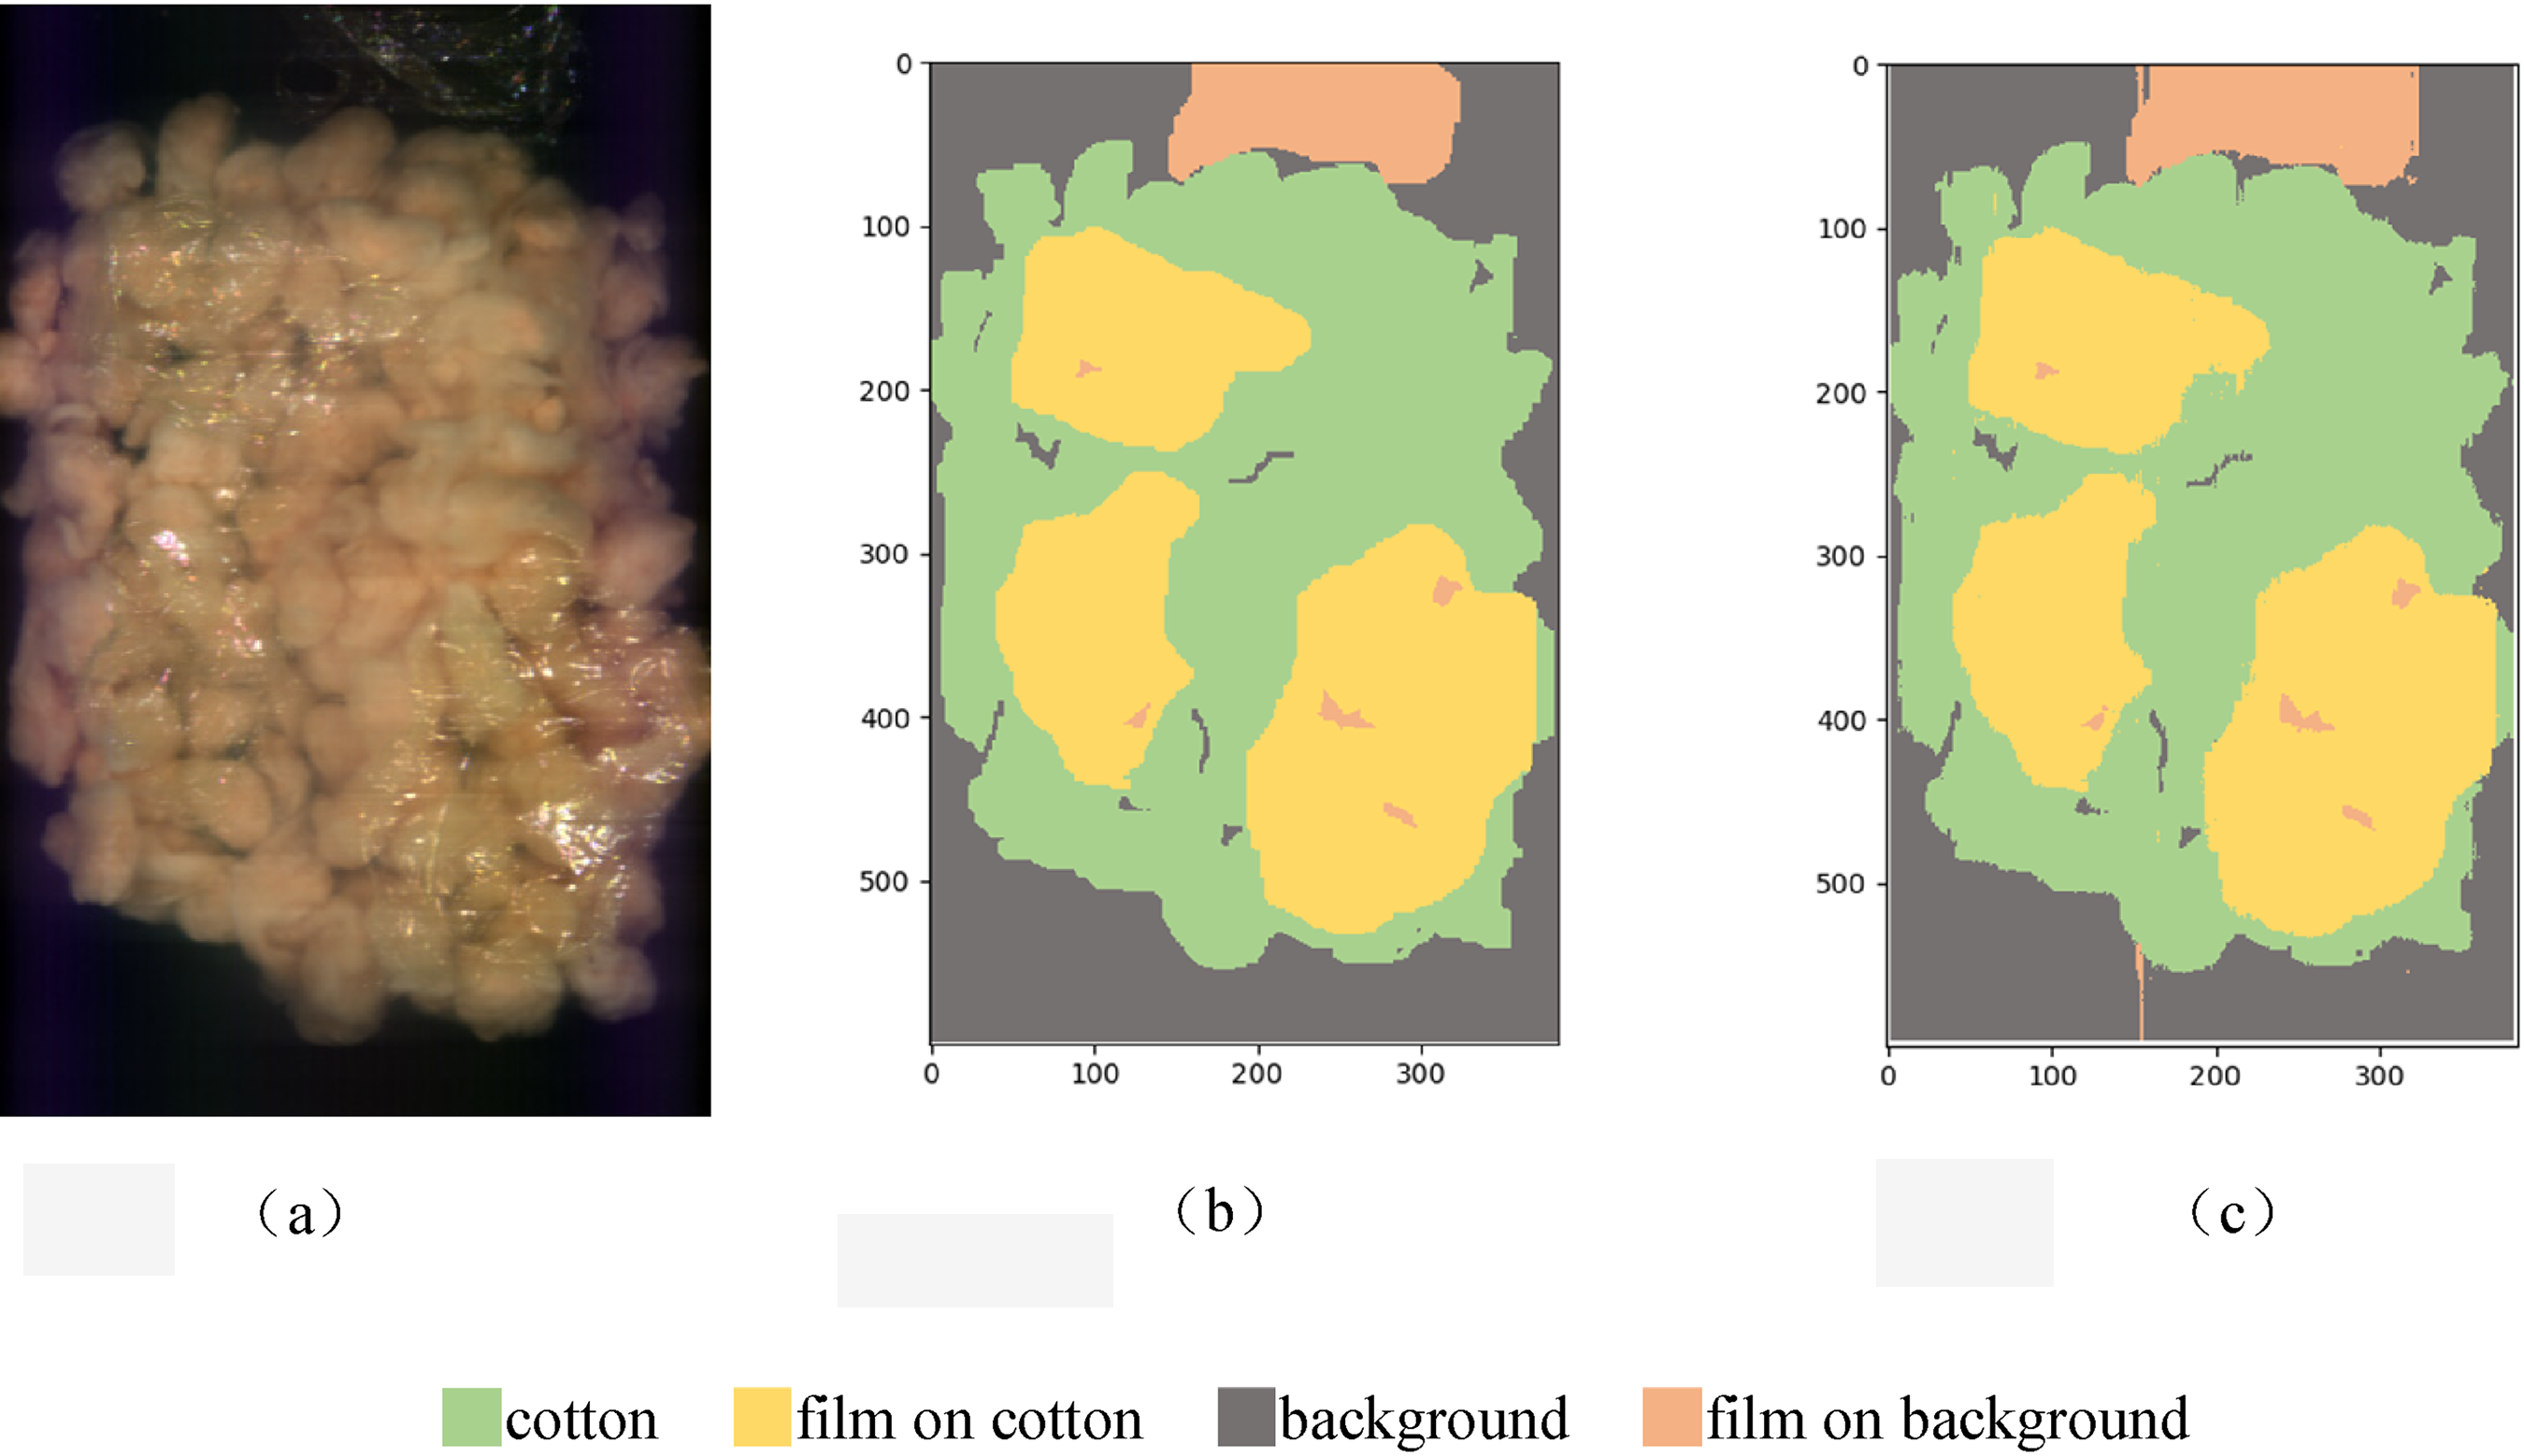
Edo-color map and classification results. (a) Pseudo-color image of hyperspectral data. (b) Manually tagged images. (c) Recognition of CNN algorithm.
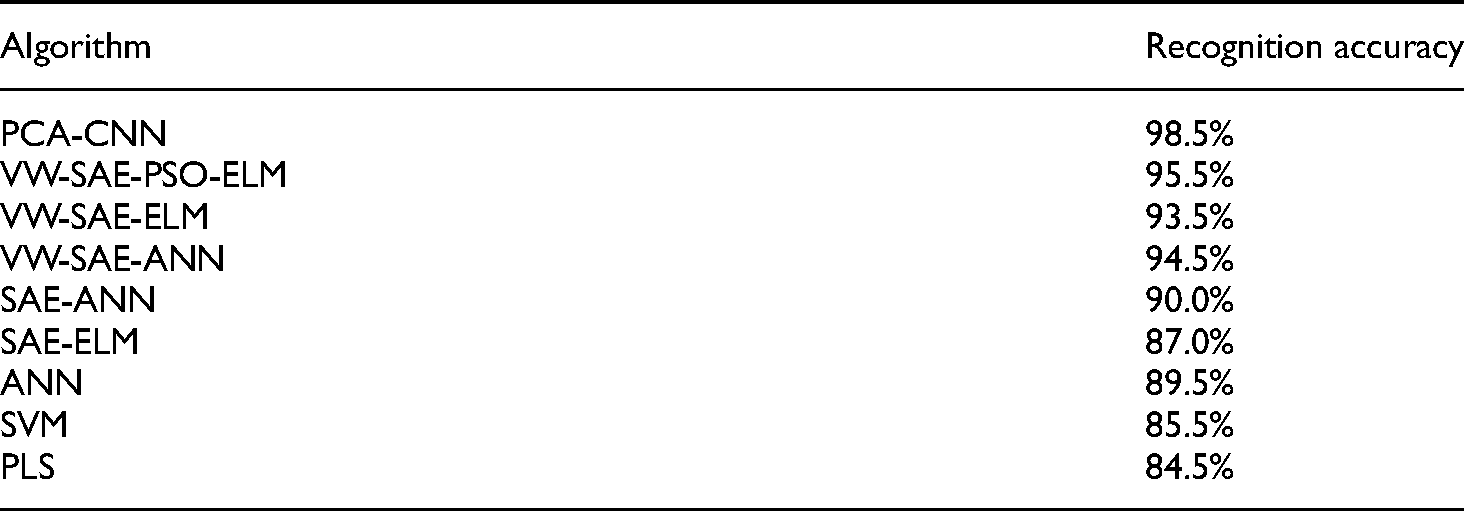
The average recognition accuracy rate of various algorithms for the film is shown in Table 3. It can be seen from Table 3 that the recognition accuracy of VW-SAE-PSO-ELM proposed in the literature32,33 reached 95.5%. The recognition accuracy of the tested VW-SAE-ELM, VW-SAE-ANN, and SAE-ANN also reached more than 90%. Compared with the existing methods, the PCA-CNN-based algorithm proposed in this paper has the best identification performance with an accuracy of 98.5%.
Recognition accuracy of various algorithms.
Considering the positioning requirements of the actual sorting device, the classification results are merged from four categories into two categories. Specifically, the film on the cotton and the film on the background are classified as film, the cotton and the background are classified as the non-film. The processed images are shown in Figure 12. Figure 12(a) is a manual marking image, Figure 12(b) is the binarized image after merging. In order to reduce the noise caused by light, dust and artificial marking errors, the morphological method is used to open the binary image to eliminate the misrecognized small area and the artifacts at the edge of the image. The denoising result is shown in Figure 12(c). Compared with Figure 12(a), the denoising result is close to the ideal manual marking result, which proves the effectiveness of the proposed method.
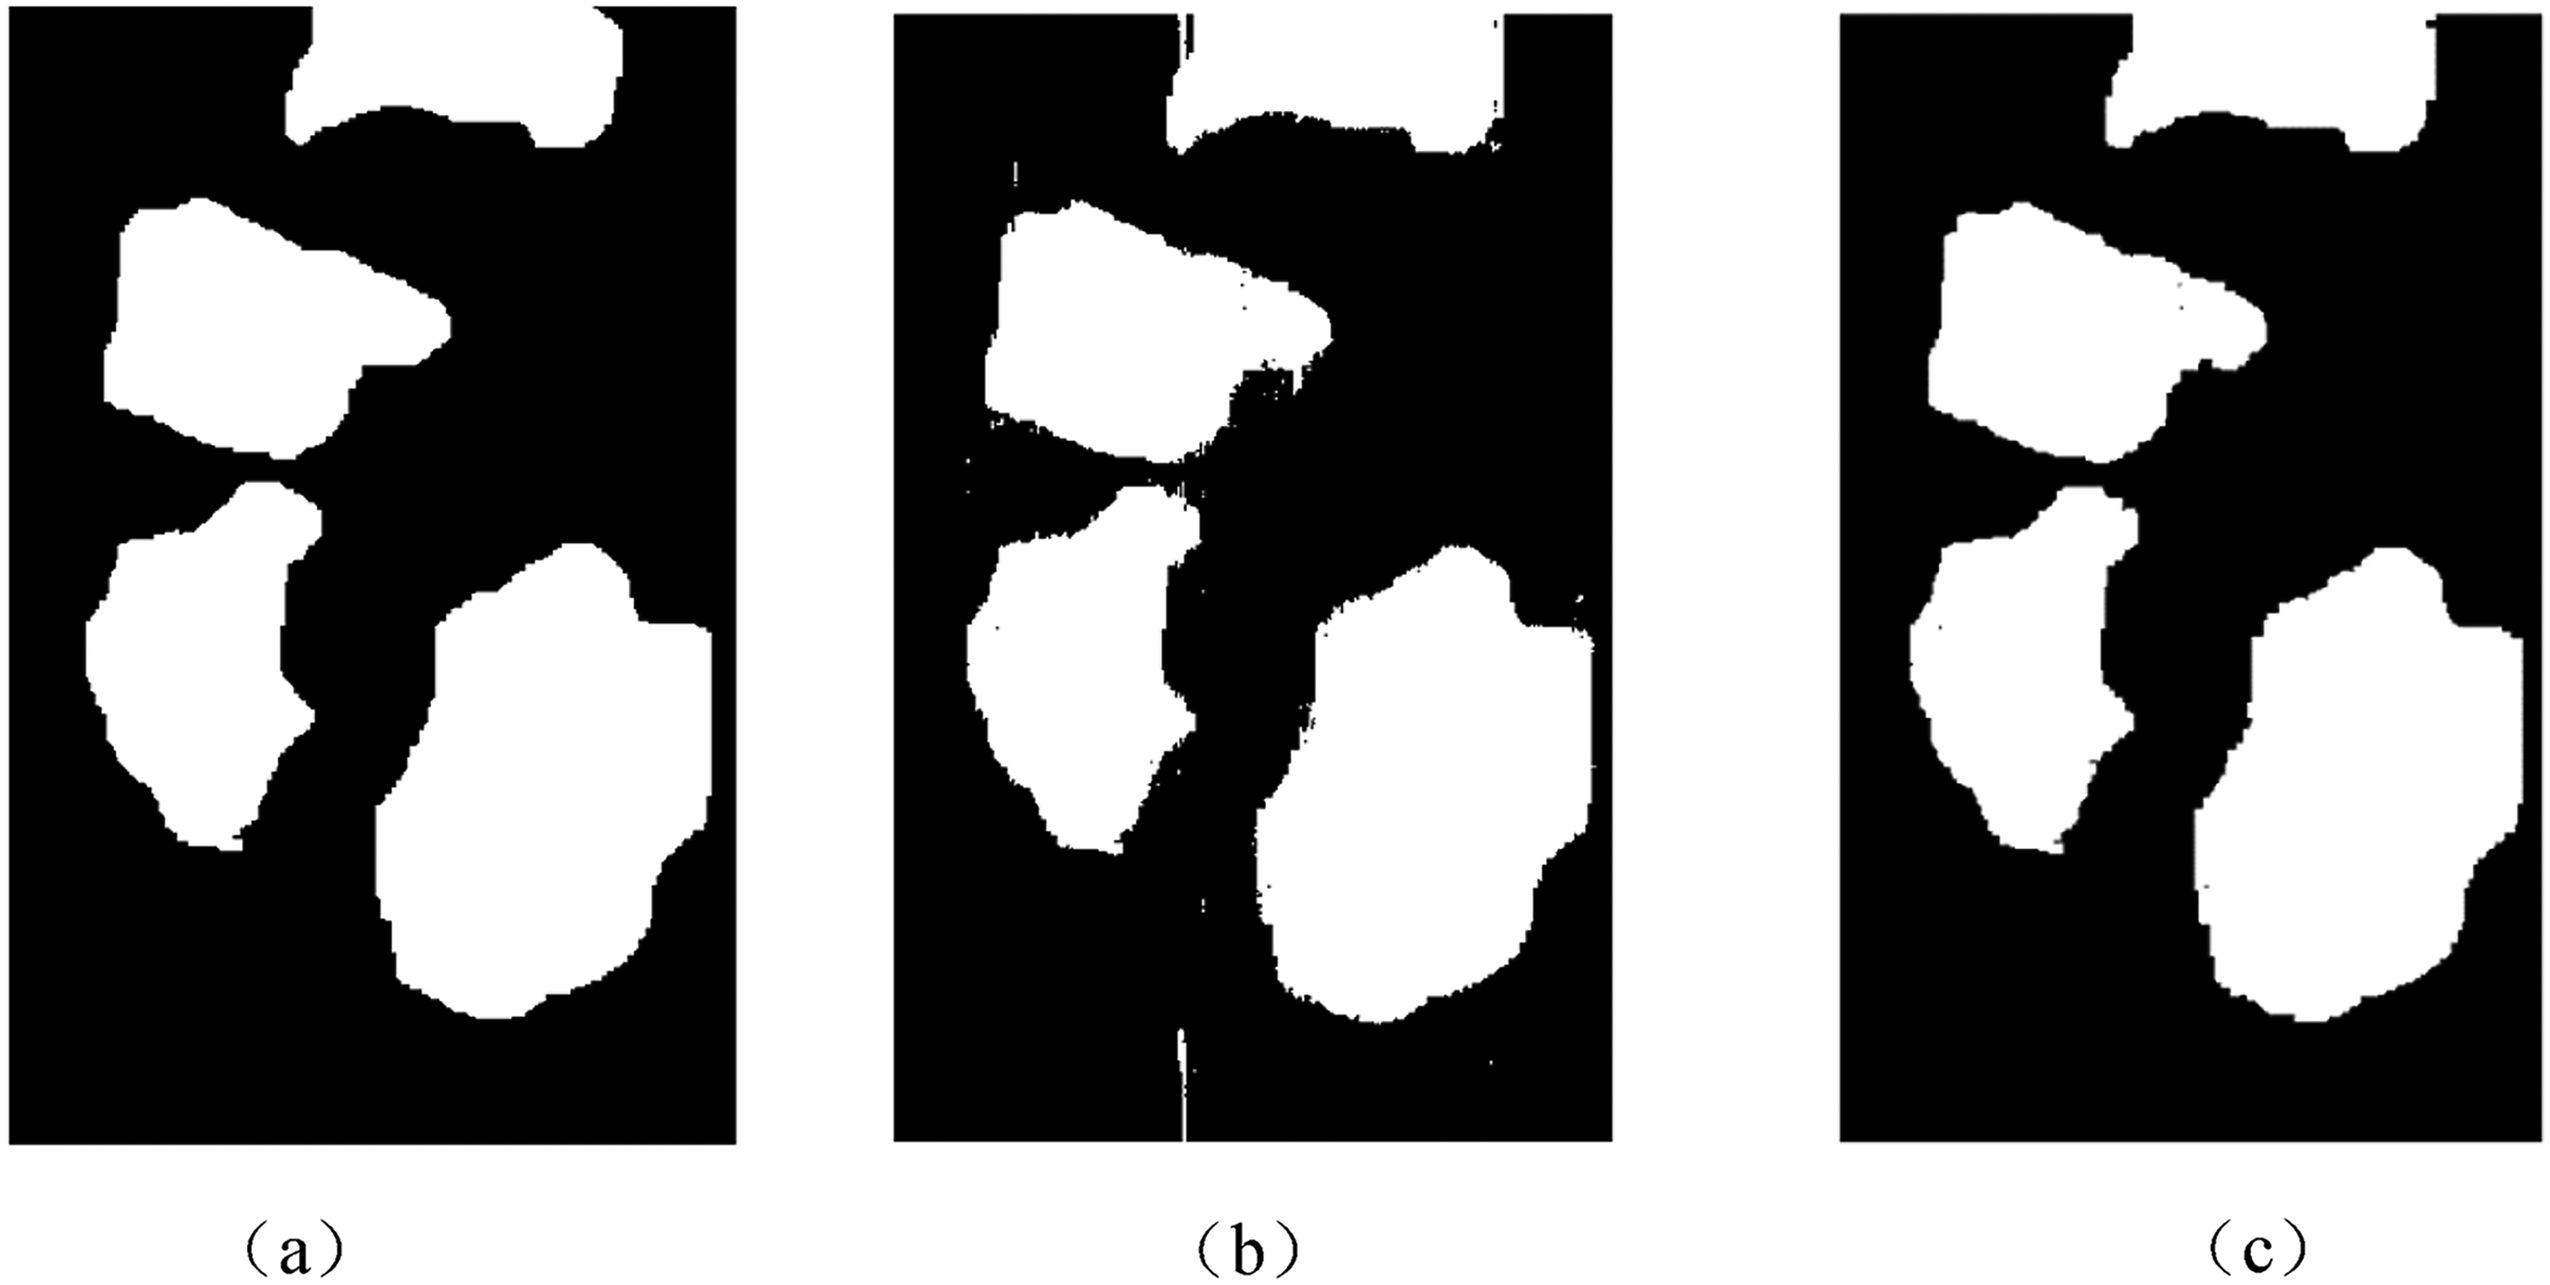
Binarized images processed by a different method. (a) Standard binarization. (b) Primary classification binarization. (c) Morphological processing.
Application test
To verify the performance of the PCA-CNN-based identification method proposed in this paper on the removal of the film in practical applications. The algorithm was tested in a cotton factory of the Agricultural First Division of Xinjiang Production and Construction Corps by sorting experiments. The algorithm was tested in a cotton factory of the Agricultural First Division of Xinjiang Production and Construction Corps by film sorting experiments. The algorithm runs in the Kears Deep Learning framework, implemented by the NVIDIA parallel computing platform CUDA and GPU acceleration library CUDNN. The film sorting experiment conducted in Xinjiang is shown in Figure 13. As can be seen from Figure 13, the mixed cotton and films are put into the removal system embedding algorithm proposed in this paper for film removal of cotton.

Sorting experiment.
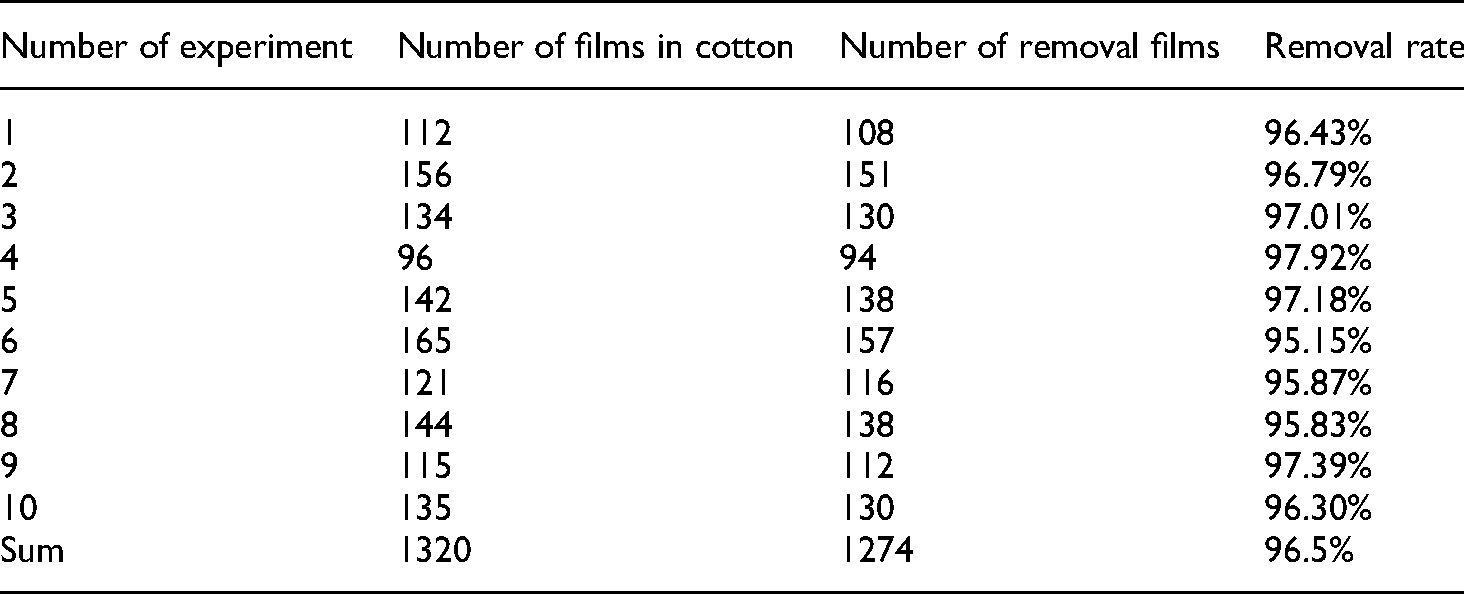
Table 4 shows the recognition results under different experimental conditions. The number of removed films and the corresponding removal rate are recorded in each experiment. After repeated tests, the overall removal rate of the film can reach 96.5%, at an output of 3t/h, which meets the requirements of the actual application.
Statistics of experimental results.
Conclusions
This paper proposed an algorithm for identifying film on cotton based on short-wave NIR hyperspectral imaging and CNN. The main conclusions are as listed as follows:
This paper applies hyperspectral imaging technology to collect images of film, which solves the technical problem of film removal encountered by traditional mechanical sorting and optical sorting methods. The method proposed in this paper successfully combines the preprocessing of hyperspectral data, feature extraction, recognition, and classification, which effectively improves the recognition accuracy of transparent film on cotton. The method proposed in this paper uses PCA to extract features and reduce the dimensionality of hyperspectral data, which provides a solution to the processing problem of a large amount of information and the high dimension of hyperspectral data.
By selecting appropriate network parameters, a CNN model was constructed, which is suitable for the recognition of hyperspectral images. In the actual experimental test, the recognition accuracy rate reached 96.5%.
Hyperspectral imaging technology and the PCA-CNN recognition algorithm proposed in this paper have broad application prospects. This method can be extended to other fields such as the detection of moisture and sugar in fruits and vegetables, the detection of pesticide residues in agricultural products, and the detection of foreign body contamination in meat. More experiments will be carried out to verify the generalization performance of the PCA-CNN-based method in future work.
Footnotes
Declaration of conflicting interests
The author(s) declared no potential conflicts of interest with respect to the research, authorship, and/or publication of this article.
Funding
The author(s) disclosed receipt of the following financial support for the research, authorship, and/or publication of this article: This work was supported by the Natural Science Foundation of Shandong Province (Nos. ZR2020ME128 and ZR2022MF303) and the Key Funding Projects of Liaocheng University (No. 14211).