
Abstract
This paper constructs an Economy-Energy-Emissions (3E) System Dynamics Model using the megacity of Beijing, China, as an example, to estimate the effects of different policy scenarios (including three single-policy scenarios and four combined-policy scenarios) on the core variables of Beijing's 3E system from 2021 to 2035. The results suggest two main points. (1) Following the current development trend, the proportion of the GDP represented by the added value of advanced high-precision industries (Gao Jing Jian in Chinese) will only be 43% in 2035, implying a limited role in promoting economic growth. Despite effective control of total energy consumption, fossil energy's share of total consumption will reach 57% by 2035, hindering the process of making the energy consumption structure cleaner and leading to failure to achieve the targeted inflection point in CO2 emissions by 2025. PM2.5 control shows some successful results and will decrease to 19 μg/m3 in 2035. However, a gap compared to other world-class cities remains. (2) The implementation of a single policy for either industrial structure optimization, energy structure transformation, or emissions control cannot simultaneously meet the goal of high-quality coordinated development of Beijing's 3E system, whereas the comprehensive implementation of policies in all three dimensions is demonstrably effective.
Keywords
Introduction
Cities occupy 3% of the world's land yet hold 56% of the world's population,1, 2 resulting in 66% of global energy consumption and 70%–80% of greenhouse gas (GHG) emissions,3, 4 with more than half the emissions coming from 25 megacities, including 23 Chinese cities, such as Beijing, Shanghai, etc. 5 China has since 1978 experienced a large-scale high-speed urbanization process, with an urbanization rate close to 60%. 6 While promoting economic development, Cities in China have accounted for more than 85% of national energy consumption and GHG emissions, 7 while causing serious PM2.5 pollution, resulting in more than 4000 pollution-linked deaths in China every day. 8 Which means urban pollution control is key to alleviating the pressure of global warming. Therefore, how to achieve high-quality balanced development of the economy, energy, and emissions in cities is an important and urgent issue for the world, but especially for China.
In recent years, Beijing, China, as a megacity, has made great achievements in economic and social development, but the rapid growth of the economy and continuous expansion of urban areas has led to both serious environmental pollution and tight supplies of various factors. 9 The ongoing COVID-19 pandemic has introduced many further obstacles to development.10,11 At present, the city's economic development still relies on high-intensity of resource use, and a comprehensive innovation-driven development pattern has not been established. Advanced industries are still in the preliminary development period, making it difficult to create strong support for economic growth in the short term.12,13 With total energy consumption continuing to grow, a clean revolution in the energy structure awaits further optimization. The massive usage of fossil energy causes high emissions, and in 2013 Beijing experienced the most extreme smog pollution in history. On average, it endured severe smog with visibility of fewer than 3 kilometers every 20 days in that year.14,15 Although there have been improvements in recent years—in 2020 the annual average daily concentration of annual PM2.5 dropped to 39 μg/m3—it is still far behind other first-tier cities in the world (e.g. New York, 15 μg/m3; Tokyo, 8 μg/m3).16,17 As a result, the Beijing Urban Master Plan (2016–2035) (hereinafter referred to as the Beijing 2016–2035 plan) and the Outline of the 14th Five-Year Plan for National Economic and Social Development of Beijing and Long-Range Objectives through the Year 2035 (hereinafter referred to as Beijing's 14th Five-Year Plan and Long-Range Objectives through 2035) set specific targets for the related variables of economic development, energy consumption, and emissions, aiming to develop Beijing into a digitalized, smart, green city.18,19
Therefore, it is essential to study how Beijing can achieve high-quality coordinated development of the Economy-Energy-Emissions (3E) system. Beijing, as a super-large city in China, has been at the forefront of the country in terms of industrial transformation and upgrades, energy structure transformation, and environmental governance. Other cities in China will face even greater challenges in achieving the coordinated development of these three dimensions. Therefore, the success of Beijing will serve as an important demonstration and reference point for the sustainable development of other cities in China, and hopefully also for cities in other countries.
Literature review
Scholars have built numerous models to study coordinated paths for the 3E system using econometric and statistical methods.20,21 While some studies analyze problems by dividing the world into smaller fragments, the System Dynamics (SD) approach encourages problem analysis from a holistic and continuous perspective, which is suitable for studying complex social systems. 22 Meadows et al. first constructed an SD model (the World III model) to analyze resources and environmental issues. 23 The results showed that human society would collapse within a century due to resource shortages and environmental pollution, a finding that aroused widespread concern from all walks of life. Since then, a growing number of scholars have applied SD theory to analyze economic, energy, and emissions problems.
Liu et al. constructed an SD model of China's transportation industry to analyzed the impact of new-energy vehicle policies on CO2 emissions. 24 Fang et al. utilized SD theory to analyze China's energy conservation and emissions reduction trends under different economic growth rates. 25 Based on the World III model, Ansell and Cayzer simulated the impact of climate warming and renewable energy development on economic growth, arguing against the existence of growth limits. 26 Stercke et al. applied an SD model to analyze the relationship between economic development, energy consumption and water protection in London. 27 Daneshzand established an SD model to simulate the impact of natural gas consumption on economic development and carbon emissions. 28 Cai et al. constructed an SD model to analyze the impact of different policies on water resources and energy consumption in the Beijing-Tianjin-Hebei region of China from 2015 to 2030. 29 Cheng et al. applied the Circular-Economy-Effect-and-Policy-Simulation-System-Dynamics (CEEPS-SD) model to explore measures aimed at preventing the Rashomon effect of ‘environmental fragility—economic stagnation’ in northwest China from four perspectives, namely waste utilization, energy conservation, emissions reduction, and sustainable development. 30 Yang et al. built a multi-level SD model to predict the carbon emissions generated by energy consumption in China from 2005 to 2050, with results showing a peak in CO2 emissions from energy consumption in 2043. According to this model, an integrated approach combining technological innovation, infrastructure construction, resident behavioral improvement, and the adjustment of the industrial structure can effectively advance the carbon peak to 2028. 31
Existing studies have also used SD theory to study problems related to Beijing's 3E system. Some researchers built the 3E model from the perspective of an ‘energy consumption terminal’ and calculated emissions by using the unidirectional association between the emission subsystem and other subsystems. For example, Feng et al. constructed a Beijing carbon emissions system model to evaluate emissions from different energy consumption terminals, showing that there is an increasing trend in the long run and that the growth rate from 2021 to 2030 will be consistent with that from 2005 to 2010. 32 To study the impact of energy, environment, and technology policies on meeting Beijing's sustainable development goals, Wu et al. developed a Beijing 3E SD model which is combined with the Analytic Hierarchy Process (AHP) method and evaluated the emissions of economic activities . 33 Tan et al. predicted the SO2 emission from economic and energy subsystem using the SD model, demonstrated that the environmental pollution in Beijing would greatly increase, and thus suggested that there was a need to transform the economic development pattern and increase investment in environmental protection to achieve sustainable development. 34
Seeing the efficient application of the SD model in researching the development of complex systems while noticing the effect of different policy scenarios of Economy-Energy-Emission have not been examined, we construct the Beijing Economy-Energy-Emissions System Dynamics (BJ3E-SD for short) model to study the effects of different policy scenarios on the development of Beijing's 3E system from 2021 to 2035.
This paper makes two main contributions. One is to optimize and expand the existing 3E SD model, as follows. First, the economic subsystem is subdivided into high-precision sectors (information technology, new-energy vehicles, integrated circuit, etc., totaling 10 sectors) and non-high-precision sectors according to the current structure and the target of Beijing's economy as outlined in The development plan of advanced high-precision in the 14th Five-year Plan of Beijing. 35 Second, we note that the traditional 3E SD model only analyzes 3E problems from the ‘energy consumption terminal’ perspective, ignoring the impact of intermediate energy conversion on the energy structure and emissions. We expand the energy subsystem by considering intermediate energy conversion, thereby improving the scientific research underlying the model. Finally, current studies mostly construct the SD model from the ‘economic development → emissions’ or ‘energy use → emissions’ perspectives, thereby failing to consider a bidirectional feedback mechanism between the emissions subsystem and other subsystems. We solve this by coupling SD theory with Exposure-Response (E-R) theory and the Value of a Statistical Life (VSL) method. The E-R theory is widely used in evaluating the relationship between human disease incidence (including death) caused by PM2.5 concentration, based on epidemiology and toxicology36,37 and the VSL method is used to assess the willingness to pay to avoid the diseases by calculating their opportunity cost, including medical cost, rescheduling cost, etc.38,39
Our second main contribution is as follows. Based on the historical trend, we construct the baseline scenario to predict the development trend of the core variables of the BJ3E system from 2021 to 2035, and we simulate three single-policy scenarios (economic, energy, and emissions policy, respectively) and four combined-policy scenarios to analyze the impact of the BJ3E-SD on core variables from 2021 to 2035. Practically, this provides a theoretical basis and decision support for Beijing to achieve high-quality, balanced development of the three systems. Meanwhile, we expect that the research method used in this study and its consideration and design of relevant policy scenarios can also provide some references to help other cities meet the challenge of addressing economic, energy, and emissions problems simultaneously.
Methods and data
Methodology
Our methods are based on SD theory, in combination with the current state of Beijing's economic development, energy consumption, and pollution emissions. (1) We use the BJ3E-SD model to analyze Beijing's problems so that the factors transferring in and out of Beijing (e.g. imported energy) are given exogenously according to Beijing's official documents. (2) To stay in step with Beijing's development outline and plan, we set the changes of the variables in the BJ3E-SD model to phased. (3) We exclude from consideration any impact on the BJ3E system of emergencies, extreme weather, and other factors.
As a complex multi-agent system, the BJ3E-SD model involves numerous factors. We divide the whole system into three subsystems (economy, energy, and emissions) based on existing studies, the current status in Beijing, and data availability.
The first subsystem, the economy, has GDP, capital, labor, and technology as core variables, which are used to analyze the impact of economic development on the BJ3E system. We connect this subsystem to others through GDP, population, technology, government expenditure on environmental protection, and other variables. Specifically, we connect the economy and energy subsystems via industrial output and population, which can affect energy consumption and structure. Meanwhile, technological progress leads to the decline of energy and emissions intensity, then reduces energy consumption and emissions, which act respectively on the energy and emissions subsystems. Finally, government expenditure on environmental protection influences carbon and PM2.5 emissions, which are variables in the emissions subsystem.
The second subsystem, energy, is used mainly to analyze the impact of energy use and structural changes on economic development and emissions. Considering the varieties of energy (coal, gasoline, diesel, kerosene, oil, natural gas, electricity, and renewable energy) and the stages of energy use (processing, conversion, and terminal consumption), this subsystem is subdivided into five departments according to the energy varieties, with each department being further subdivided according to the stages of energy use. It then connects to the emissions subsystem through the emissions intensity variables.
The third subsystem, emissions, takes CO2 and PM2.5 emissions as its core variables and includes two sectors, pollution emissions and health losses, which are used to analyze the impact of emissions on the BJ3E system. According to the International Statistical Classification of Diseases and Related Health Problems (2016) and existing studies,40–43 we apply E-R theory and the VSL method to calculate the health losses caused by emissions and establish a bifunctional feedback mechanism between the emissions and economy subsystems.
Based on the above settings, we build a BJ3E-SD model with 177 variables. The causal loop diagram of the model is shown in Fig. 1.
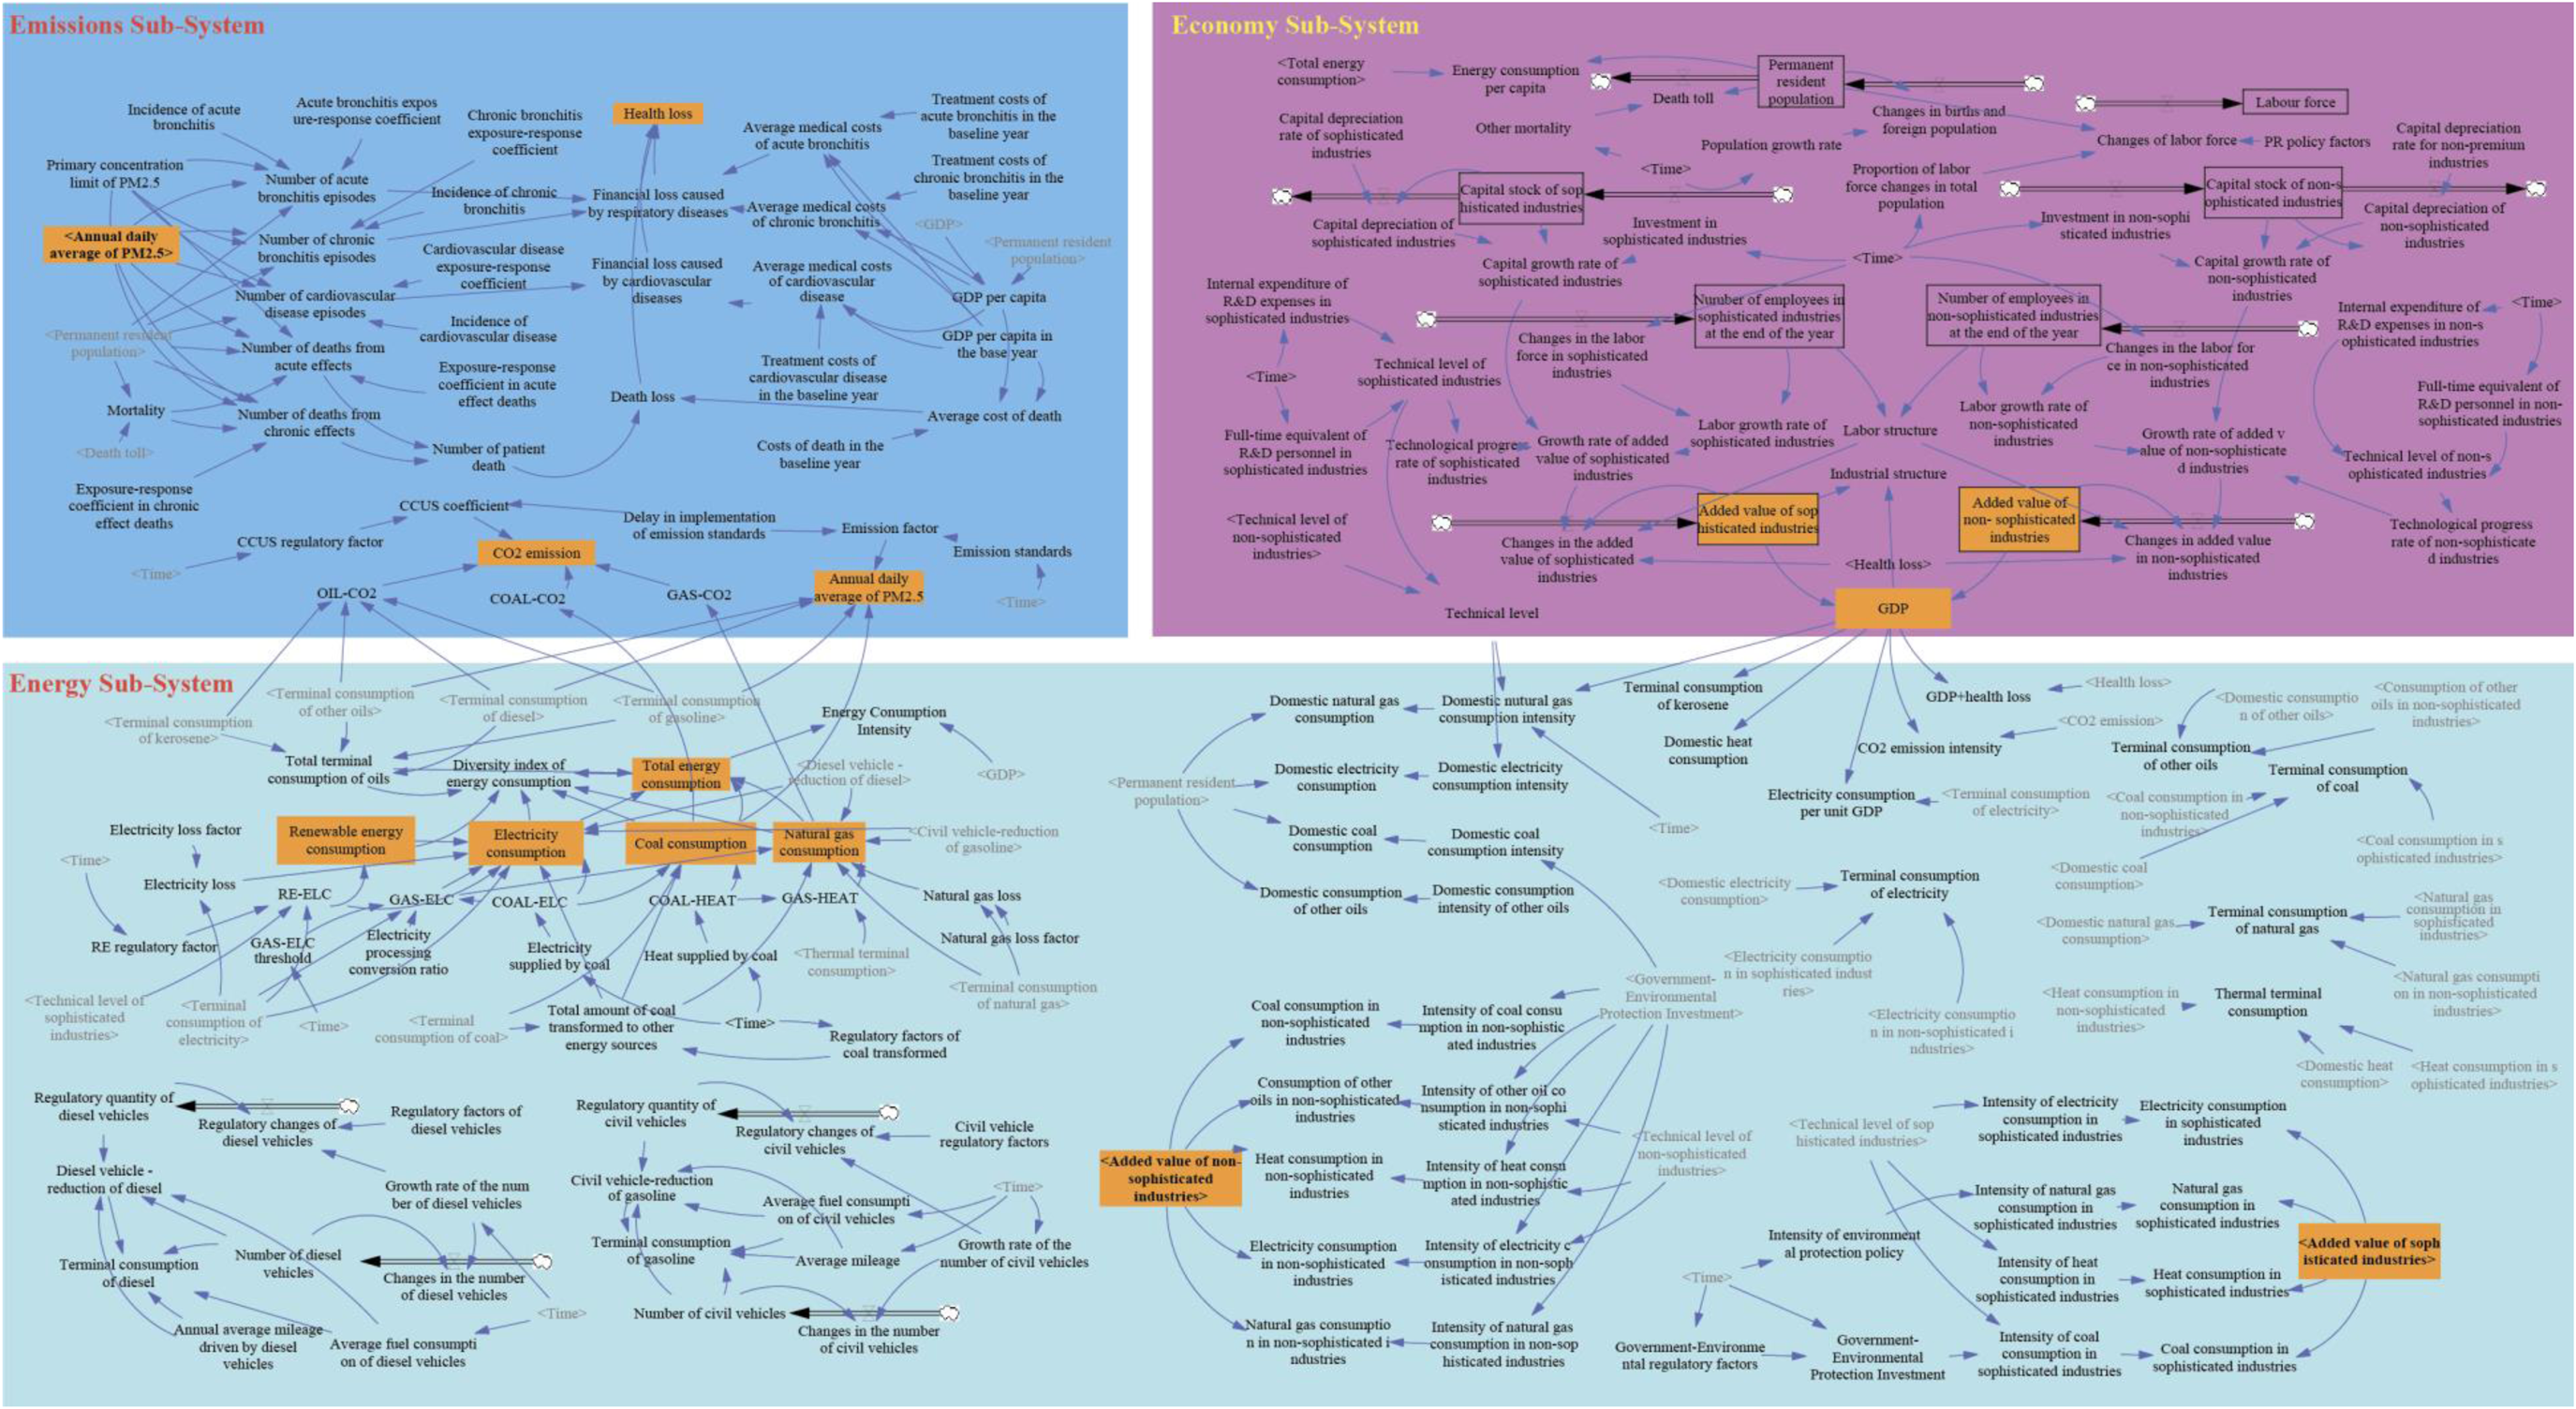
The causal loop diagram of the BJ3E-SD model.
Data
Most data (including GDP, investments, number of employees, etc.) are taken from the Beijing Statistical Yearbook for 2008–2020. 44 The data on full-time equivalent R&D personnel and R&D expenditures are taken from the China Statistical Yearbook on Science and Technology for 2008–2019. 45 Energy consumption data by category are taken from the China Energy Statistical Yearbook for 2008–2019, and we use carbon emissions data from the Multi-resolution Emission Inventory for China and Carbon Emission Accounts and Datasets to perform model checking. For convenience of analysis, we set all prices at 1990 levels.46–48
Model functions and parameters are set mainly by statistical and econometric methods and adjusted by compound simulation. In addition, parts of the functions and parameters are taken from existing studies and relevant government development plans. Among these, the capital depreciation rate is based on relevant research.49–51 The CO2 and PM2.5 emissions standards of vehicles are taken from the IPCC's report and the Technical Guidelines for Compilation of Source Emission Inventory of Atmospheric Fine Particulate Matter (PM2.5) (Trial).52,53 Kerosene consumption is set according to the capacity of the Beijing Capital International Airport and Beijing Daxing International Airport.
Model test
We use historical data from 2008 to 2019 to test the validity of the BJ3E-SD model. As shown in Table 1, the absolute value of the differences between the simulation results and the statistical data are all less than 10%, indicating that the BJ3E-SD model has a high degree of fit with the actual BJ3E system, meaning it is suitable for subsequent simulation analysis.
Historical test results of the BJ3E-SD model.

Scenarios
Baseline scenario
The baseline scenario (Business as Usual, hereinafter referred to as BAU) is set according to the historical trends and current status of economic development, energy consumption, and pollution emissions in Beijing. We assume that the major influencing factors in the BJ3E system, such as investment, labor, and technology, evolve with the historical trends. The specific values and setting standards are shown in Appendix Table A. The BAU scenario is used to simulate the development of the BJ3E system from 2021 to 2035 under the current development trend, aiming to provide a reference frame for policy scenarios.
Policy scenarios
Seven policy scenarios are set in combination with Beijing's current policy demands. These scenarios comprise three single-policy scenarios, three paired scenarios, and one triadic scenario, as detailed below.
The three single-policy scenarios are an industrial structure optimization scenario, an energy consumption structure optimization scenario, and an emissions control scenario, which are used respectively to evaluate the effects of the separate implementation of the economic, energy, and emissions policies.
The industrial structure optimization scenario (IS scenario) simulates the impact of economic policies on the 3E system. Based on the heterogeneity of different industries in terms of energy consumption and pollution emissions, it takes investment, labor, full-time equivalent R&D personnel, and R&D expenditure of high-precision and non-high-precision industries as the control variables. On the premise that the total amount of input remains unchanged, production factors will be promoted to tilt toward high-end and sophisticated industries. Specifically, during the period of 2021–2035, the growth rates of investment and labor in high-tech industries will increase by 2.5 and 1.5 percentage points respectively, and the growth rates of both R&D funds and personnel will increase by 1 percentage point, respectively, compared with the baseline scenario. Correspondingly, this will lead to a drop in the growth rates of capital, labor and technology in non-high-tech industries.
The energy structure optimization scenario (ES scenario) simulates the impacts of energy policies on economic growth, energy consumption, and pollution emissions. Its control variables are coal consumption, the energy consumption of vehicles, the power generation of gas-fired power plants, and renewable energy consumption. In this scenario, Beijing will be coal-zero in 2030, and the growth rates of gasoline vehicles and diesel vehicles will be reduced by 0.5% and 1% respectively compared with BAU scenario. Meanwhile, the generation threshold of gas-fired thermal power plants will be limited at 3 M tce, and the growth rate of renewable energy will be increased by 2% compared with BAU scenario.
The emissions control scenario (EC scenario) simulates the effects of emission policies on the Beijing Economy-Energy-Environment system. The emission standards will be raised on the basis of China's stage IV vehicle emission standard, i.e., reducing the PM2.5 emission concentration limit of gasoline vehicles and diesel vehicles by 20%, to reach the current European standard. Compared with the BAU scenario, the growth rate of environmental protection investment and the technology progress rate of carbon capture, utilization, and storage (CCUS) will be increased by 2% and 5%, respectively.
Considering the limitations of implementing a single policy (Fig. 1 in the Appendix), we reduce the policy intensity of every single policy, pairing and combining the policies into four combined-policy scenarios to simulate the impact of each policy combination on the BJ3E system. The specific settings are as follows: First, we combine the three single policies in pairs. Combined scenario 1 (S1) represents the comprehensive joint implementation of the economic and energy policies. Combined scenario 2 (S2) couples the economic and emissions policies. Combined scenario 3 (S3) combines the energy and emissions policies. Scenario 4 (S4) combines the policies for the economy, energy, and emissions, i.e., all three dimensions, further reducing the intensity of every single policy. Detailed settings of these policy scenarios are shown in Appendix Table B.
Results
Given the above scenario settings, we use VENSIM to simulate the development trend of the variables of the BJ3E system from 2008 to 2035 under the eight scenarios. The results are presented below.
Analysis of policy scenario impacts on economic development
The BAU scenario shows a downward trend in Beijing's economic growth rate. In this scenario, the GDP will increase to 1044 billion yuan in 2025, with an average annual growth rate of 4.8% during the period of the 14th Five-Year Plan, slightly lower than the target (5%) set in Beijing's 14th Five-Year Plan and Long-Range Objectives through 2035 (Table 2). The annual growth rate will be further reduced to 4.1% and 3.7% during 2026–2030 and 2031–2035, respectively. For the added value of advanced industries, in the BAU scenario, the average growth rate will decline from 6.4% (2021–2025) to 6.10% (2026–2030) and then increase to 6.4% (2031–2035), motivated by accelerating progress in innovation. By contrast, the growth rate of non-advanced industries will gradually decrease from 2021 to 2035, from 4.1% (2021–2025), to 3.0% (2026–2030), to 1.9% (2031–2035). In terms of the industrial structure 1 , the proportion of the added value of advanced industries in the total economic output will increase to 34.0% in 2025, slightly higher than in 2020 (31.6%), and will not achieve the target driving economic development, which was set in Beijing's 14th Five-Year Plan and Long-Range Objectives through 2035.
Simulation results of the economic variables
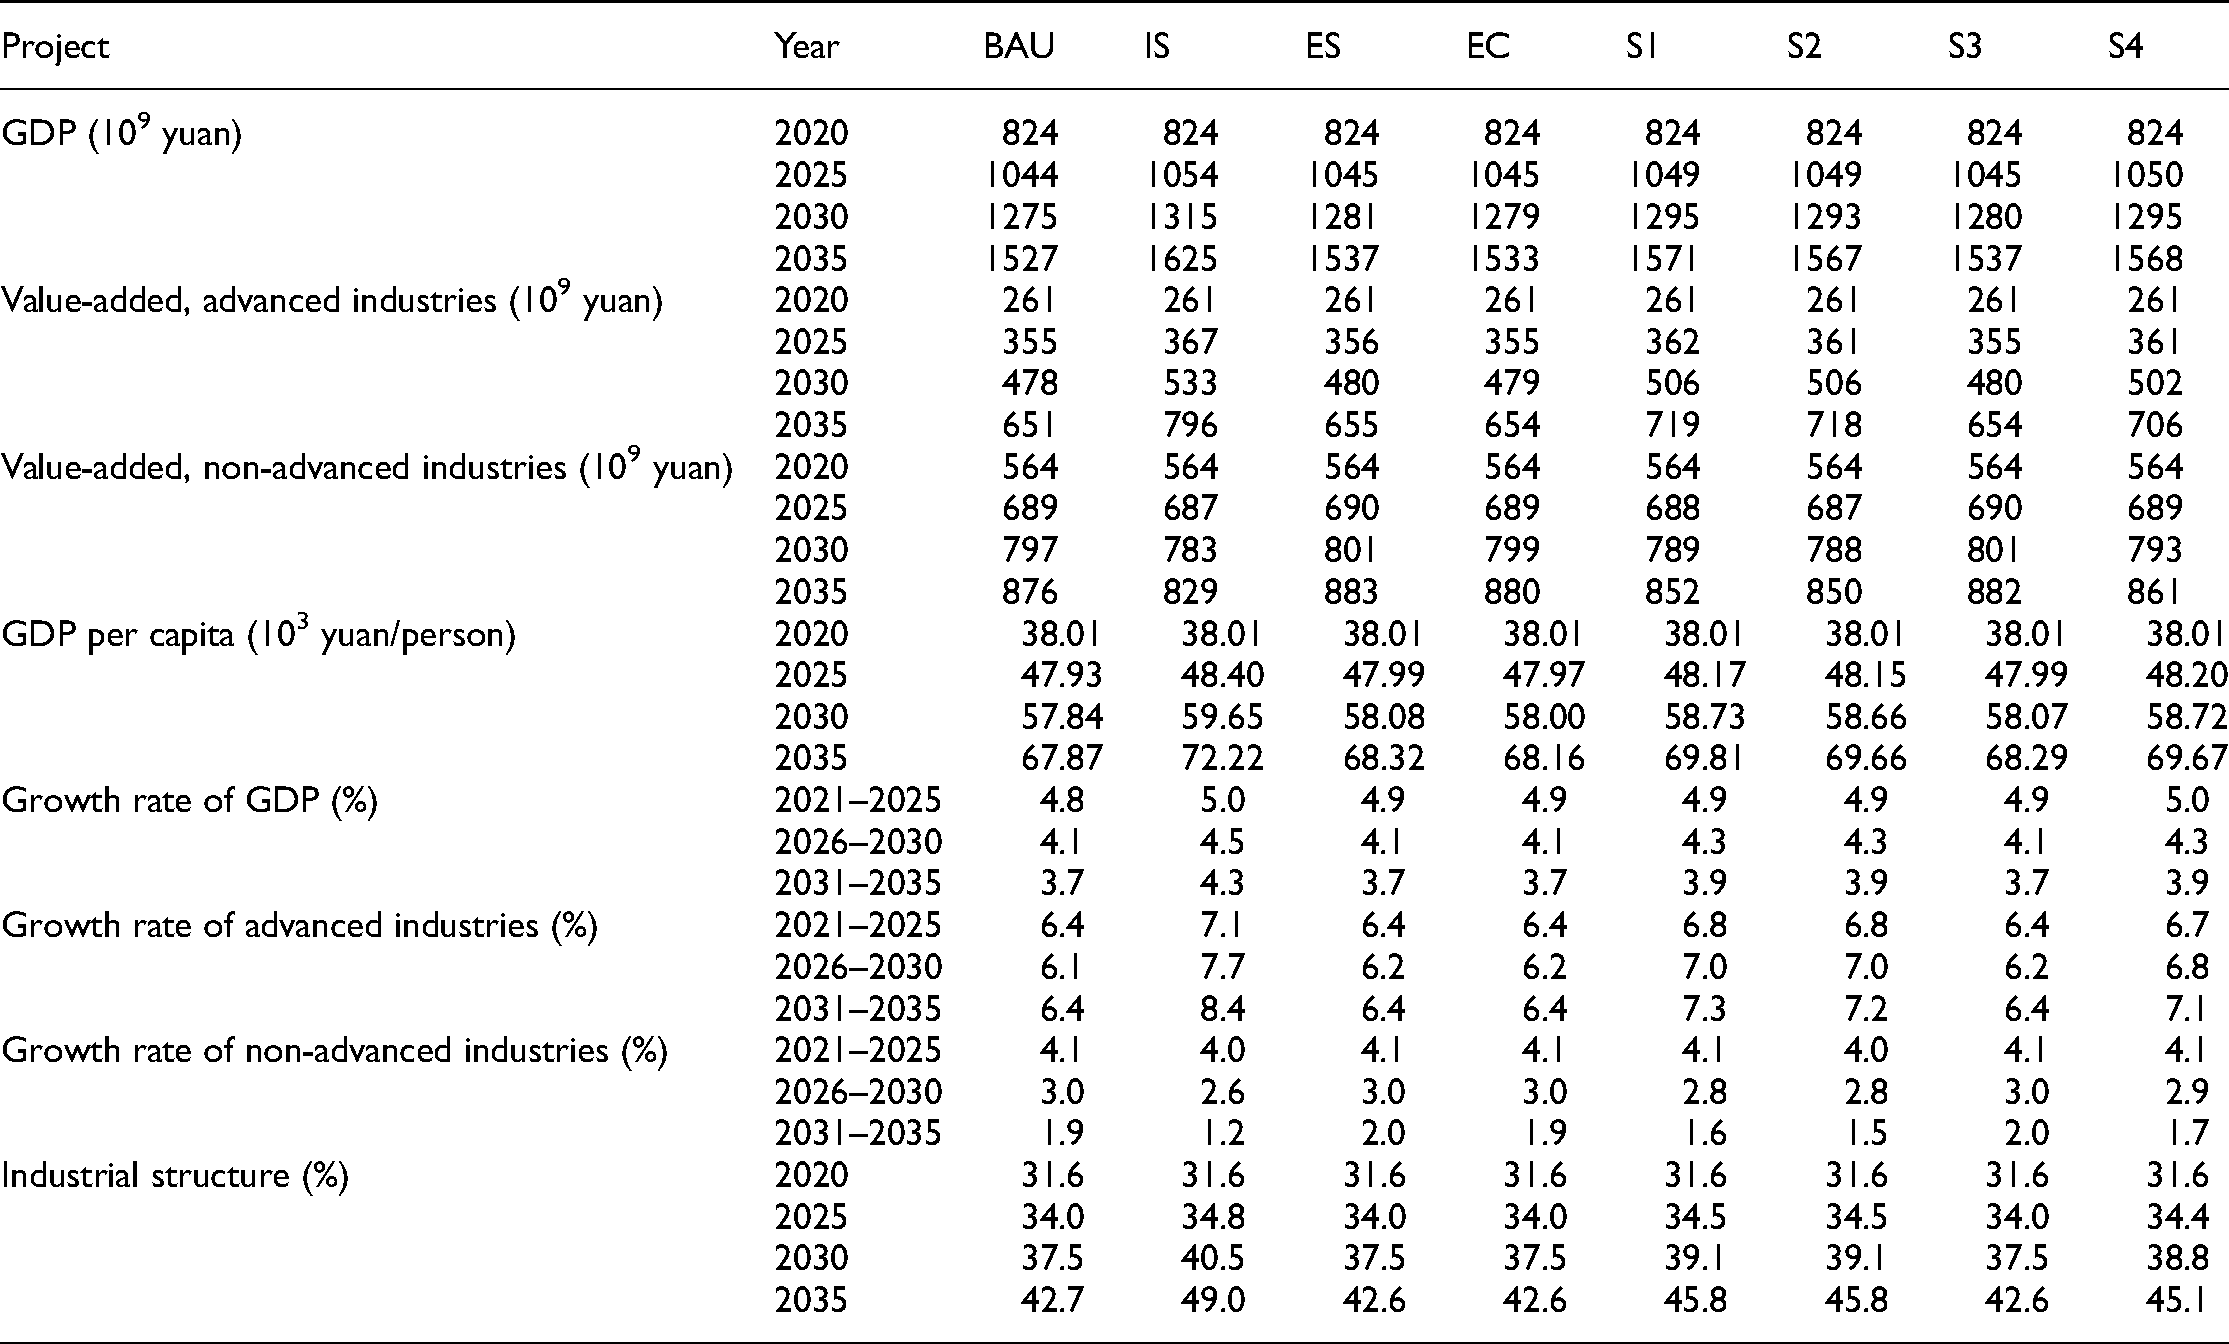
There is a significant economic development in the IS scenario. With the implementation of the economic promotion policy, Beijing's GDP is expected to reach 1625 billion yuan in 2035, and the GDP growth rate will be 5.0% in 2021–2025, 4.5% in 2026–2030, and 4.3% in 2031–2035, which are 0.2, 0.4, and 0.6 percentage points higher than in the BAU scenario, respectively. For the industrial structure, with increases in the investments and talents allotted to advanced industries, the added value of advanced industries will increase from 261 billion yuan in 2020 to 367 billion yuan in 2025, further increasing to 796 billion yuan from 2026 to 2035—an increase of 22.2% compared to the BAU scenario. Accordingly, the added value of advanced industries will account for nearly half (49%) of the total GDP, representing the formation of an advanced economic structure.
In the three scenarios that include the industrial structure optimization policy (the S1, S2, and S4 scenarios), the economic growth rate will increase significantly, and GDP in 2035 will reach 1571 billion yuan, 1567 billion yuan, and 1568 billion yuan, respectively, representing respective increases of 2.9%, 2.6%, and 2.7% compared with the BAU scenario. From the perspective of the industrial structure, advanced industries will develop rapidly in these three scenarios, accounting respectively for 45.8%, 45.8%, and 45.1% of the total GDP, thereby playing an important role in Beijing's economic development.
In the scenarios without industrial structure optimization (the ES, EC, and S3 scenarios), the GDP in 2035 will be 1537 billion yuan, 1533 billion yuan, and 1537 billion yuan, respectively. Compared with the BAU scenario, the respective GDP increases are 0.7%, 0.4%, and 0.6%. The growth rate is nearly the same as in the BAU scenario, and the proportion of advanced industries will decrease slightly compared with the BAU scenario.
The results show that, based on the current trend, Beijing's economic growth rate will slow down from 2021 to 2035, the role of advanced industries in promoting economic development is limited, and non-advanced industries will still play a dominant role. On the premise that the input of investment, labor, and other factors remains unchanged, economic growth can be significantly promoted by concentrating these factors on advanced industries. The implementation of economic policies to optimize the industrial structure is conducive to the construction of an advanced economic structure. While implementing energy and emissions policies can also promote Beijing's economic growth, these policies appear weak in developing advanced industries and optimizing the industrial structure.
Analysis of policy scenario impacts on energy consumption
In the BAU scenario, Beijing's total energy consumption will increase to 89.84 million tons of coal equivalent (M tce) in 2035 (Fig. 2), which is close to the findings of some existing studies (80∼106 Mtce54,55), achieving the target of no more than 90 M tce set in Beijing's 14th Five-Year Plan and Long-Range Objectives through 2035. Meanwhile, energy intensity will decrease from 0.92 tce / 104 yuan in 2020 to 0.80 tce / 104 yuan in 2025 due to technological progress, further decreasing to 0.59 tce / 104 yuan in the 2026–2035 period. This is 36% lower than in 2020, yet it fails to meet the target of a 40% reduction between 2020 and 2035 as set in Beijing's 14th Five-Year Plan and Long-Range Objectives through 2035.
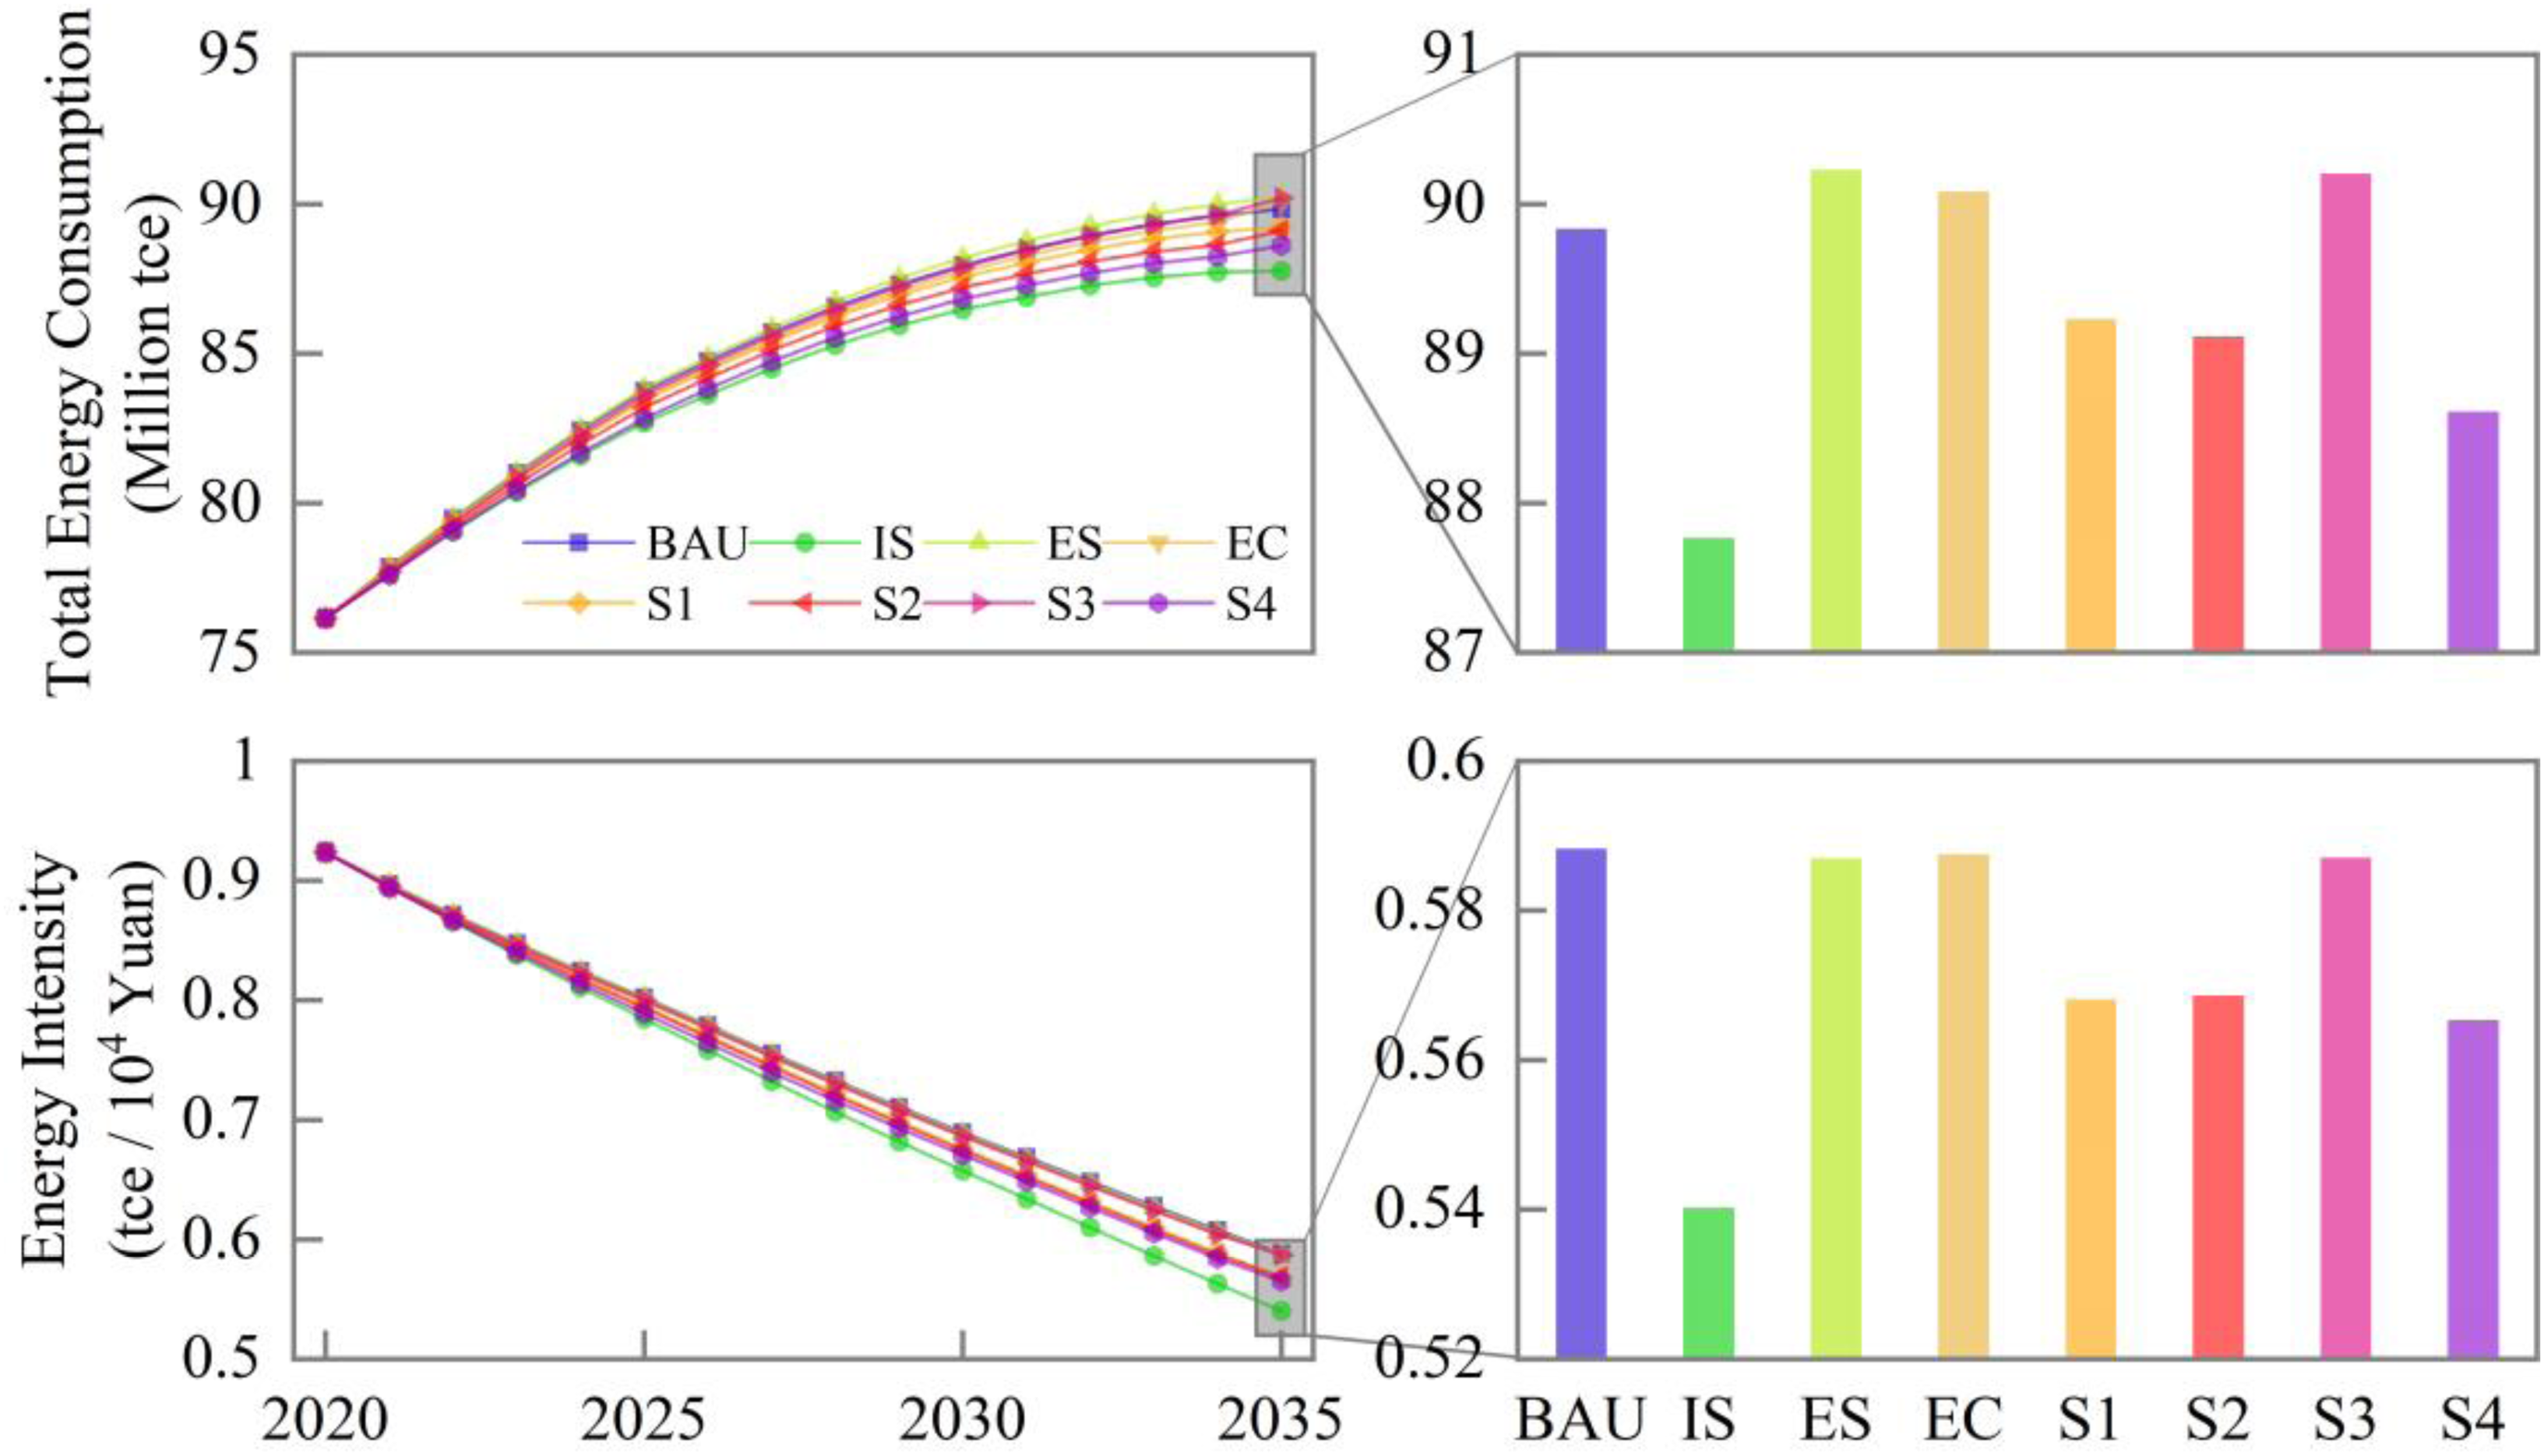
Simulation results for energy consumption and intensity.
There are significant decreases in total energy consumption and energy intensity in the IS scenario. The impact of economic policies on total energy consumption is reflected in two respects. On the one hand, it will accelerate economic development and then increase energy consumption on the premise of constant energy intensity. On the other hand, the improvement in technological level will lead to a decline in energy intensity and then reduce energy consumption. Since the restraining effect of technological progress on energy consumption is greater than the promoting effect of economic growth, the total energy consumption in the IS scenario will be significantly reduced, reaching 87.76 M tce in 2035, which is 2.30% lower than in the BAU scenario. At the same time, energy intensity in the IS scenario will be reduced to 0.78 tce / 104 yuan in 2025 and further reduced to 0.54 tce / 104 yuan in the 2026–2035 period, which is a 41.50% decrease compared to 2020, and energy utilization efficiency will be greatly enhanced.
In addition, the total energy consumption and energy intensity in the S4 scenario also decrease significantly, reaching 88.61 M tce and 0.57 tce / 104 yuan in 2035, respectively, which are 1.40% and 3.90% lower than in the BAU scenario. Unlike the IS scenario, the ES, EC, and S3 scenarios barely differ from the BAU scenario in total energy consumption and energy intensity.
Beijing's energy structure will change significantly according to adjustments in the industrial structure and technological progress. As shown in Fig. 3, coal consumption in Beijing is predicted to decrease from 3.35 M tce to 2.44 M tce from 2021 to 2035, thereby failing to reach the target of less than 0.74 M tce in 2025 set in Beijing's 14th Five-Year Plan and Long-Range Objectives through 2035. Oil consumption will increase to 25.49 M tce in 2025 and then decrease to 23.09 M tce in 2035, accounting for 25.70% of total energy consumption, which is 5.20 percentage points lower than in 2020. In terms of natural gas use, the growth rate will slow down from 1.00% (2016–2020) to 0.40% (2031–2035) with the shrinkage of the space for the Coal Reducing Project, which is stable at about 26 M tce. Electricity (including renewable energy) will account for the largest part of energy consumption in Beijing, with an average annual growth rate of 2.90% from 2021 to 2035, reaching 38.57 M tce in 2035. The proportion of renewable energy consumption will increase from 7.90% to 11.80% in 2020–2025, which is lower than the target of 14% in 2025 set in Beijing's 14th Five-Year Plan and Long-Range Objectives through 2035. It will further increase to 24.60% in 2035, which is 4.60 percentage points higher than the renewable energy target of 20% of total energy consumption set for 2035 in the Beijing 2016–2035 Plan.

Simulation results for the energy structure.
Compared with the other scenarios, the ES scenario's clean revolution in the energy structure will lead to the most significant progress. As shown in Fig. 3, the respective consumption of coal and oil products in 2035 will be 0.62 M tce and 20.23 M tce, decreasing respectively by 81.50% and 16.50% compared with 2020. The consumption of natural gas will be reduced to 20.46 M tce in 2035, which is 20.50% lower than in the BAU scenario, while electricity consumption will increase by 26.90%. At the same time, renewable energy consumption will increase significantly, reaching 28.91 M tce in 2035 and accounting for 32% of total energy consumption, which is 12 percentage points higher than the target of 20% in 2035 set in the Beijing 2016–2035 Plan.
As for the combined scenarios, the energy structure in the S1, S3, and S4 scenarios will be significantly optimized in comparison to the BAU scenario. In 2035, these scenarios’ respective proportions of traditional fossil energy (coal and oil) consumption will be 24.20%, 24.60%, and 24.90%, which are respectively 4.3, 3.8, and 3.5 percentage points lower than in the BAU scenario (28.4%). The respective proportions of electricity use in these scenarios will reach 51.70%, 51.00%, and 51.20% in 2035, all of which are higher than in the BAU scenario (42.90%).
The results show that, according to the current development trend, total energy consumption in Beijing will be effectively controlled from 2021 to 2035. Oil products will replace coal as the most popular source of energy, hindering the process of a clean revolution in the energy structure. The implementation of economic policies is conducive to take the advantage of high energy efficiency in advanced industries, which can effectively reduce energy use and achieve the target set in the Beijing 2016–2035 plan (less than 90 M tce in 2035). Implementing either the energy or the emissions policy will be helpful in promoting a clean transformation of the energy structure, but weak in controlling the total amount of energy consumed. In terms of the energy structure, policies and measures other than energy policy have no obvious effects on promoting the process of a revolution in energy structure.
Analysis of policy scenario impacts on pollution emissions
Under the BAU scenario, carbon emissions in Beijing will show an uptrend in 2021–2025 and then decrease in 2026–2035. Specifically, carbon emissions have decreased rapidly in the last ten years due to coal use reduction motivated by the Coal Reduction Project. 56 Considering that coal use has been reduced to a relatively low level, as shown in Fig. 4, carbon emissions will increase with the growth of oil and natural gas consumption, reaching a peak of 102.95 million tons in 2025, which is similar to the results of some other studies (89∼115 million tons32,55,57,58), thereby failing to meet the target of peaking and declining before 2025 set in Beijing's 14th Five-Year Plan and Long-Range Objectives through 2035. During the 2026–2035 period, carbon emissions in Beijing will show a downtrend due to the reduction in oil consumption, decreasing to 97.92 million tons in 2035, which is slightly lower than 118 million tons from some studies32,55,57,58). It is because the environmental losses were considered in our model and it has a cumulative permanent impact on Beijing 3E system. As for carbon intensity, Beijing's CO2 emissions intensity will fall to 0.64 tons/104 yuan in 2035, down 47% from 1.16 tons/104 yuan in 2020 (Fig. 4).

Simulation results for emissions.
Compared to the BAU scenario, Beijing's CO2 emissions show varying degrees of decline in the seven policy scenarios. Specifically, although optimizing the industrial structure will lead to a significant reduction in the scale of energy consumption in Beijing, it will have a small impact on the energy structure. The demand for oil and gas will remain at a high level, resulting in a much lower carbon reduction process in the IS scenario than in the other policy scenarios. In the short term, carbon emissions in the ES scenario will decrease rapidly to 94.82 million tons in 2025, 7.90% lower than in the BAU scenario, 5.60% lower than in the IS scenario, and 3.90% lower than in the EC scenario (Fig. 4). The CO2 emissions intensity will decrease to 0.91 ton / 104 yuan in 2025, down 25.10% from 2020. In the long term, the promotional effect on carbon reduction of implementing the energy structure optimization policy will gradually weaken, with CO2 emissions decreasing to 77.60 million tons in 2035, lying between the IS (92.30 million tons) and EC (72.70 million tons) scenarios. As the space for optimizing the energy structure shrinks, the impact of terminal governance on carbon emissions will be more significant in the long run. As shown in Fig. 4, accelerating CCUS innovations and applications of CCUS technology will significantly promote carbon reduction in the EC scenario, with total emissions decreasing to 72.70 million tons in 2035, which is 33.30% lower than in 2020 (98.14 million tons). Carbon intensity will decrease to 0.43 tons/104 yuan in 2035, which is 27.10% lower than in 2020. In the combined scenarios S1 and S2, which incorporate the industrial structure optimization policy, the respective carbon emissions in 2035 will be 81.13 million tons and 81.84 million tons, which are respectively 17.10% and 16.40% lower than in the BAU scenario. Compared with the IS scenario, emissions reduction in these two scenarios will be significantly improved but still less than in the other scenarios. In the S3 and S4 scenarios, CO2 emissions will decrease respectively to 72.20 and 70.90 million tons in 2035, accompanied by carbon intensity reaching 0.47 ton/104 yuan and 0.45 ton/104 yuan, respectively. This shows that accelerating CCUS technology innovation and application is an effective measure to reduce GHG emissions and realize the strategic goal of carbon reduction.
In terms of PM2.5 emissions, as shown in Fig. 4, the annual average PM2.5 concentration (hereinafter referred to as PM2.5 concentration) in the BAU scenario will decrease to 19
The effects of other scenarios on PM2.5 emissions are as follows. (1) Implementing the industrial structure optimization (IS) policy causes a significant decline in PM2.5 emissions. On the one hand, the development of ‘clean energy–friendly’ advanced industries is conducive to reducing dependence on coal and oil products. On the other hand, technological progress is beneficial to reducing energy intensity, limiting energy use (including fossil energy), and further promoting PM2.5 emissions reduction. As shown in Fig. 4, the PM2.5 concentration in the IS scenario will decrease to 13.2
In summary, according to the current trend, Beijing's CO2 emissions will reach a peak in 2025, failing to achieve the target of a ‘decline before 2025’ set in Beijing's 14th Five-Year Plan and Long-Range Objectives through 2035. After that, carbon emissions will remain at a high level due to high fossil energy consumption. In the short term, implementing the energy policy will lead to a decrease in traditional fossil energy (coal and oil) consumption, resulting in a significant reduction in carbon emissions and accelerating the process of carbon peaking, yet it will fail to limit carbon emissions in the long run. In the long term, with the reduction of the energy structure optimization space, controlling carbon emissions on the terminal side will play a more important role in carbon reduction. The PM2.5 concentration will be significantly decreased from 2021 to 2035, but there is still room for improvement compared to the world's first-tier cities, such as New York and Tokyo. Both industrial structure optimization and energy consumption structure optimization are conducive to PM2.5 pollution reduction. However, the emissions policy is weak in terms of PM2.5 governance.
Conclusion
We constructed a BJ3E-SD model to simulate and analyze the impact of industrial, energy, and emissions policies as well as their combined effect on Beijing's Economy-Energy-Emissions system during 2021–2035. The main conclusions are summarized and discussed below.
According to current trends, the economic growth rate of Beijing will slow down in 2021–2035, non–high-precision sectors will continue to occupy the dominant position, and the role of advanced high-precision industries in promoting economic development will be limited. Total energy consumption will be effectively controlled, while oil will replace coal to become the most popular energy source, hindering the completion of a clean revolution in the energy structure. In terms of emissions reduction, Beijing will fail to achieve the inflection point of carbon emissions before 2025, which is the target set in Beijing's 14th Five-Year Plan and Long-Range Objectives through 2035. The goal is to decrease the PM2.5 concentration, but a gap compared to other world-class metropolises remains.
Implementing a single policy—either industrial structure optimization, energy structure optimization, or emissions control—cannot achieve all the targets of Beijing's Economy-Energy-Emissions system simultaneously. Implementing the industrial structure policy alone is conducive to increasing the leading role of advanced industries in economic growth and reducing total energy consumption and PM2.5 emissions; however, it has little effect on energy structure optimization and carbon reduction. Implementing the energy structure optimization policy alone is beneficial to promoting a clean revolution in the energy structure; however, it fails to limit energy consumption and carbon emissions. Implementing the emissions reduction policy alone would significantly decrease CO2 emissions and enable a carbon peak to be achieved before 2025; however, it has limited effects in optimizing the energy structure and decreasing PM2.5 concentration.
The comprehensive, joint implementation of economic, energy, and emissions policies is conducive to building an advanced economic structure, promoting a clean revolution in the energy structure, and effectively reducing CO2 and PM2.5 emissions. This is an effective way for Beijing to achieve high-quality coordinated development of the 3E system. With this combined implementation, the added value of advanced high-precision industries will reach 706.2 billion yuan in 2035, an increase of 8.4% compared to the baseline scenario. The proportion of fossil energy consumption will drop to 49%. Significant progress will be made in transforming the energy consumption structure into a cleaner one, and CO2 and PM2.5 emissions will be reduced by 28% and 30%, respectively. Pollution emissions will be effectively controlled.
Based on these results, Beijing should actively build an economic structure with more advanced high-precision industries and focus on innovation-driven development. On the one hand, enhancing the attractiveness of high-precision sectors to ensure a sufficient supply of capital, labor, and other needed production factors for these industries. On the other hand, it is important to decentralize and relocate non-advanced, labor-intensive, and energy-consuming industries. Based on the innovation-driven economic development model, the government should continuously provide government R&D subsidies, promote relevant personnel education and training, and develop policies that can attract high-tech talent. We should also pay more attention to the role of technological progress in promoting economic growth.
Beijing should strictly control total energy consumption and deepen the energy revolution. After completing the Coal Reduction Project, it is vital to shift our focus to oil consumption reduction, to strengthen restrictions on vehicle emissions, and to promote the use of cleaner energy in transportation. The amount of electricity generated by local gas-fired power plants should be reduced while increasing the amount of green power imported into Beijing. Meanwhile, we suggest that innovation be accelerated to promote simultaneous improvement in the quality and quantity of renewable energy.
It is essential to reduce emissions in the preliminary stage and minimize pollution from emissions. The government should encourage and support the development of emissions reduction technology, such as CCUS, and increase investment in environmental protection. The government should also strengthen top-level, comprehensive design, implementing a collaborative policy mechanism to establish a balanced development system of ‘economic development–energy revolution–emissions governance’.
Footnotes
Authors’ contributions
Declaration of conflicting interests
The author(s) declared no potential conflicts of interest with respect to the research, authorship, and/or publication of this article.
Funding
The author(s) disclosed receipt of the following financial support for the research, authorship, and/or publication of this article: This work was supported by Beijing Natural Science Foundation [grant number 9222011], Humanities and Social Science Research Foundation of the Ministry of Education, China [grant number 20YJA790018].
Notes
Appendix
We built three stronger single policy scenarios to verify the limitations of single policies: 1) Stronger industrial structure optimization scenario (SIR); 2) Stronger energy structure optimization scenario (SES); 3) Stronger emissions control scenario (SEC). The policy intensity in each stronger scenario was enhanced by 50%.
As shown in Appendix Fig.1, the stronger IS scenario is helpful to economic growth, but coupled with the highest energy use, carbon emission, and PM2.5 concentration; the stronger ES scenario works well in energy and emission dimension, while has little impact on economic development; the stronger EC scenario exhibits unparalleled strength in reducing carbon emission, but otherwise its contribution is disheartening.