In this article, we suggest an enhanced family of estimators for estimation of population mean employing the supplementary variables under probability proportional to size sampling. Up to the first order of approximation, numerical formulations of the bias and mean square error of estimators are obtained. From our suggested improved family of estimators, we give sixteen different members. The recommended family of estimators has specifically been used to derive the characteristics of sixteen estimators based on the known population parameters of the study as well as auxiliary variables. The performances of the suggested estimators have been assessed using three actual data. Furthermore, a simulation investigation is also accompanied to evaluate the effectiveness of estimators. The proposed estimators have a smaller MSE and an advanced PRE when linked to existing estimators, which are based on actual data sets and simulation studies. Theoretically and empirically studies also reveal that the suggested estimators accomplish well than the usual estimators.
In survey sampling, the proper usage of the supplementary variable may increase estimator’s accuracy during both the construction and estimation phases. Supplementary variables are frequently used to enhance accuracy of the estimators. This information may be used at the design stage or estimation stage, or at both stages. A wide range of strategies for employing the supplementary information using ratio, product, and regression methods are described in the survey sampling literature. Many various types of estimators have been proposed, each one taking benefit of the connection between the study and the supporting variable by combining ratio, product, or regression estimators.
Many researchers have suggested various estimators by adequately modifying the supplementary variables including Singh and Espejo,1 Grover and Kaur,2 Shabbir et al.,3 Muneer et al.,4 Muili et al.,5 Grover and Kaur,6 Singh and Usman,7 Zaman and Kadilar,8 Yadav and Zaman,9 Zaman et al.10
In some cases, when sampling elements vary significantly in size, e.g. in a health survey, related to a number of patients having a precise disease, the size of health units may differ, correspondingly survey connected to the income of the household, a household may have the different number of relations, then in such circumstances, it is important to use PPS sampling scheme. Numerous researchers have suggested various estimators by adequately modifying the supplementary variables under PPS. The researcher can investigate this research by Rao,11 Srivenkataramana and Tracy,12 Agarwal and Kumar,13 Panday and Singh,14 Ahmad and Shabbir,15 Al-Marzouki et al.16 and Singh et al.17
Sampling methodology
Let a population B = {B1, B2,…, BN} contain N identifiable units. Suppose and { , } be the features of the study variable Y and the supplementary variables (and ) respectively. The rank of the supplementary variables is denoted by . Suppose a sample of size n is chosen by PPS with replacement. Let
, be the PPS sampling for obtaining the units. We take a sample of size n by adopting the PPS sampling with replacement.
Define
, be the sample mean conforming to population mean , and .
As and are the supplementary variables, and is the rank of the first supplementary variable.
Let
E() = 0, as i = 01,2
E() = , E() = , E() = , E() = ʎ , E() = ʎ ,
E() = λ , = = = .
Where ʎ = .
Some of the existing estimation of mean
In this section, we have studied various adopted estimators that are available in the literature:
(i) Singh et al.17 recommended the following estimator:
(v) Kumar and Bhougal,21 suggested the following estimators:
where is a constant. The ideal value of is given by:
The least mean square error at the optimal value of , is given by:
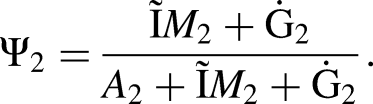
v) Singh and Kumar22 suggested the following estimators:
The biases and MSE of and , are given by:
and
Suggested efficient estimator for mean
An appropriate usage of the supplementary variables may help in improving the exactness of an estimator both during the design stage and at the estimation stage. Enchanting inspiration from Ahmad et al.,23 we suggested a family of estimators that includes many more effective estimators expending two supplementary variables. The main advantages of our suggested estimator is that it is further elastic, effective than the existing estimators, which is given by:
where
Putting values of , where i = 1,2,3,4, in (17)
By solving given in (17), we have
where
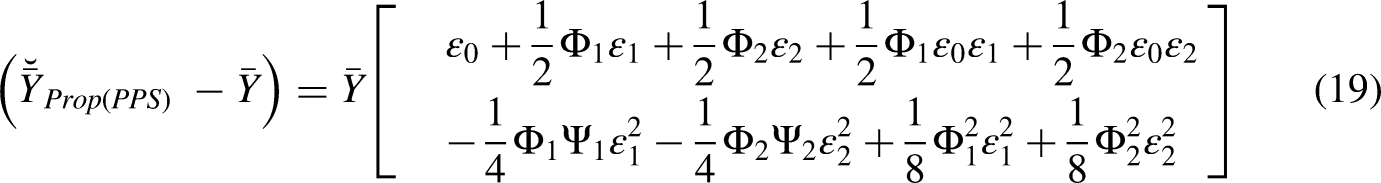
Using (19), the properties of , are given by:
and
Differentiate Equation (20) with respect to and , we have
Putting values of and in (20), we get minimum MSE of and is given by:
where
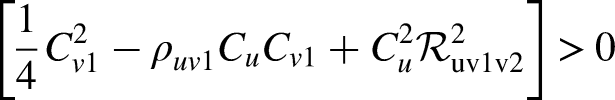
is the coefficient of multiple determination of u on and .
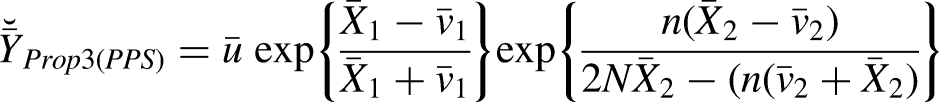
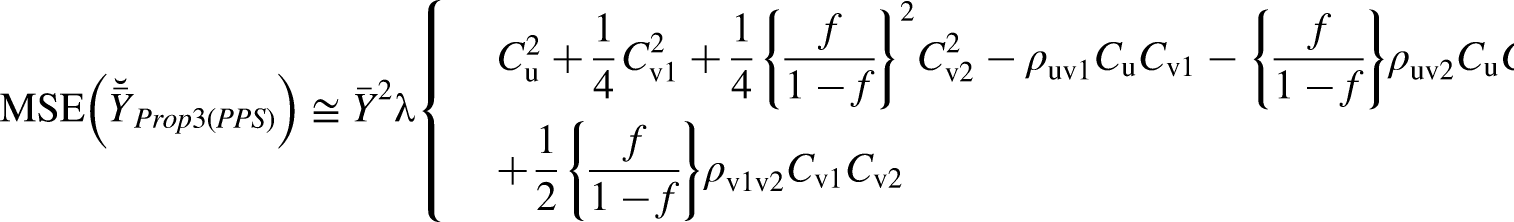
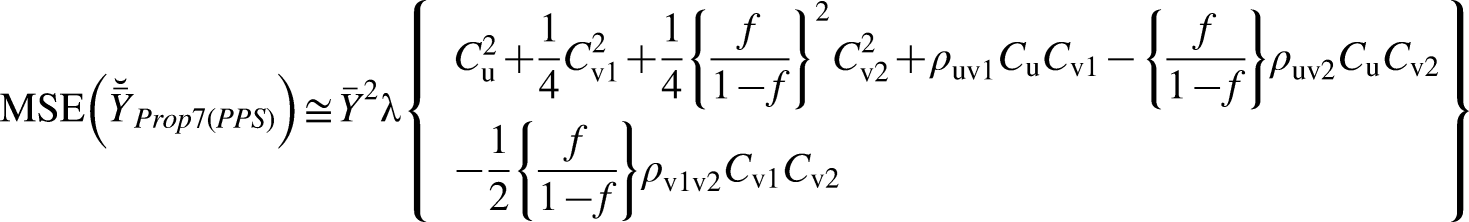
Now placing changed values of in equation (17), we get:
1. As ,
The properties of , are given by:
2. As ,
The properties of , are given by:
3. As ,
The Properties of , are given by:
4. As ,
The properties of , are given by:
5. As ,
The properties of :
6. As ,
The properties of :
7. As ,
The properties of :
8. As
The properties of :
9. As ,
The properties of :
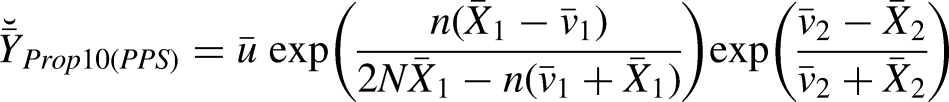
10. As ,
The properties of :
11. As ,
The properties of :
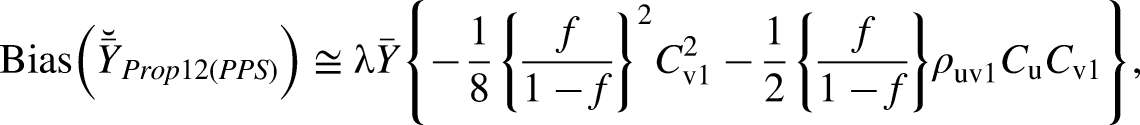
12. As ,
The properties of :
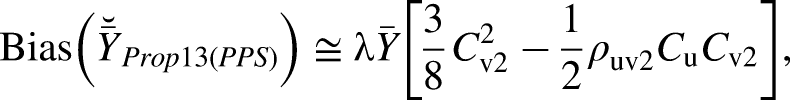
13. As ,
The properties of , are given by:
14. As ,
The properties of :
15. As ,
The properties of :
16. As ,
The variance of :
Theoretic assessment
In this unit, we compared the adopted and suggested estimators in terms of MSE.
From (2) and (21)
(ii) From (4) and (21)
(iii) From (6) and (21)
(iv) From (9) and (21)
(v) From (10) and (21)
(vi) From (12) and (21)
(vii) From (15) and (21)
(viii) From (16) and (21)
Numerical illustration
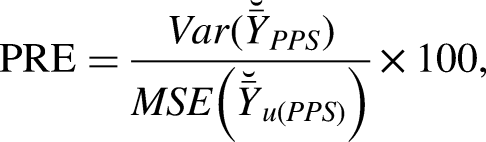
In this unit, we deliberate altered population data sets for mathematical evaluations of the suggested and existing estimators. Data descriptions of these data are given in Table 2. The presentation of the considered estimators is compared in terms of PRE. We obtain the competence of estimators with existing estimators with the help of following expressions.
where u = , , , , , , , .
Summary statistics using populations I–III.
Parameters
Population-I
Population-II
Population-II
N
80
67
34
15
15
10
ʎ
0.06666667
0.06666667
0.6666667
5182.637
23.634333
199.4412
1126.463
20.59851
208.8824
285.125
9.79253
747.5882
40.4875
34
17.47059
1338.756
22.75134
203.3169
51.94002
37.57293
17.8003
0.4758864
0.5356861
0.3630288
0.2371875
0.6869816
0.3401158
0.4163328
0.7442662
0.3598615
0.8520118
0.8344614
0.8890212
0.4794675
0.8235835
0.7029563
0.7103788
0.9655628
0.7909407
740038
71.13702
3387.898
3886.483
128.748
202.4327
48099.24
180.1726
233.6354
10568817
93.8327
3825.127
63257.12
107.6524
3689.709
344.6741
336.2949
27.96725
Various members of our suggested estimator .
Members of suggested estimators
1
1
1
2
1
2
3
1
3
4
1
4
5
2
1
6
2
2
7
2
3
8
2
4
9
3
1
10
3
2
11
3
3
12
3
4
13
4
1
14
4
2
15
4
3
16
4
4
The MSE and PRE using three actual populations are given in Tables 3 and 4.
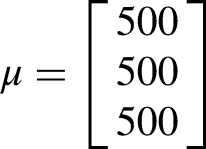
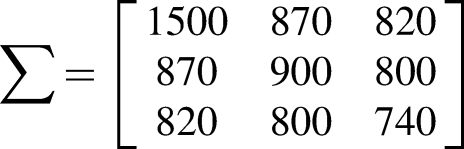
From a multivariate normal distribution with modified covariance matrices, we generated three groups with a combined size of 5000. Below are the population means and covariance matrices:
Population-I:
and
= 0.8820, = 0.9722 and = 0.7884
Population-II:
and
= 0.75290, = 0.8684 and = 0.73445
Population-II:
and
= 0.6197, = 0.5105 and = 0.4965
Discussion and findings
We used three actual data and a simulation to observe the MSE and PRE of the existing and the suggested estimators. The minimum MSE of the suggested estimator is pointed out in Equation (21). The suggested estimator and the existing estimators were linked in terms of PRE. Summary statistics are shown in Table 2. The results of MSE and PRE on the basis of real data sets are available in Tables 3–4. It is observed from the numerical results that our suggested estimator is best among all the existing counterparts. The improvement in proficiency in Data 3 is more as compared to Data 1 and 2. The MSE and PRE result using simulated data sets are given in Tables 5 and 6. The outcome of the simulation study clearly determines that for the simulated data sets 1–3, the PRE of the suggested estimator is better than the existing estimator. Thus, we applause emphatically, the use of our suggested estimator over the existing estimators are better as linked to other considered estimators.
MSE using simulation results of populations I–III.
Estimators
Population-I
Population-II
Population-III
1.784719
1.72736
1.69054
0.553815
0.62479
0.62596
7.683389
7.52173
7.36046
0.5857964
0.58960
0.58258
4.150583
4.03807
3.94983
0.423499
0.46004
0.45953
27.41200
28.4530
28.1090
35.68900
36.1730
36.8870
0.292409
0.32070
0.33007
Percentage relative efficiency using simulation results of populations I–III.
Estimators
Population-I
Population-II
Population-III
100
100
100
322.259
276.469
270.0713
23.228
22.964
22.9678
304.665
292.971
290.1805
42.999
42.776
42.80028
421.421
375.472
367.8788
6.5107
6.07092
6.014223
5.0007
4.7752
4.58302
610.350
538.6145
512.1712
Conclusion
In this article, we suggested a modified family of estimators under PPS sampling using two supplementary variables. From our suggested family of estimators, we generate sixteen new estimators which are shown in Table 1. According to results based on three actual data, it is emerged that the suggested estimator achieves fine as compared to its existing counterparts. A simulation study also gives the same reflective as observed in real data sets. In theoretical and empirical efficiency comparisons, it has been revealed that our suggested estimator proves more efficient than the usual estimators. Consequently, we acclaim the use of our suggested estimators for proficiently estimating the finite population mean under probability proportional to size using supplementary variables. The present idea can be protracted to advance an enhanced family of estimators based on stratified sampling, proportion, and systematic sampling.
Footnotes
Declaration of conflicting interests
The author(s) declared no potential conflicts of interest with respect to the research, authorship, and/or publication of this article.
Funding
The author(s) received no financial support for the research, authorship, and/or publication of this article.
ORCID iD
Sohaib Ahmad
Author biographies
Sohaib Ahmad is a Phd Scholar at Abdul Wali Khan University Mardan. His research interests includes survey sampling, randomized response, and Data analysis. He published a number of research articles in the same field.
Javid Shabbir a is Professor in the Department of Statistics, University of Wah, Pakistan. His research direction is Advanced Survey Sampling and Randomized Response.
Erum Zahid is working in the department of Applied mathematics and statistics, institute of space technology Islamabad, Pakistan. Her research direction includes Survey Sampling, Spatial Statistics and Data Analysis.
Muhammad Aamir working as Assistant Professor, at Abdul Wali Khan University, Mardan, Pakistan. His research direction is Survey sampling, Time Series Analysis, Machine Learning, and he has deep insights on the accuracy of forecasting models.
References
1.
SinghHPEspejoMR. On linear regression and ratio-product estimation of a finite population mean. Statistician2003;1:59–67.
2.
GroverLKKaurP. A generalized class of ratio type exponential estimators of population mean under linear transformation of auxiliary variable. Commun Stat-Simul Comput2014;43:1552–1574.
3.
ShabbirJHaqAGuptaS. A new difference-cum-exponential type estimator of finite population mean in simple random sampling. Revista Colombiana de Estadística2014;37:199–211.
4.
MuneerSShabbirJKhalilA. Estimation of finite population mean in simple random sampling and stratified random sampling using two auxiliary variables. Commun Stat-Theory Methods2017;46:2181–2192.
5.
MuiliJOAgwambaENErinolaYA, et al.Modified ratio-cum-product estimators of population mean using two supplementary variables, 2020.
6.
GroverLKKaurA. An improved regression type estimator of population mean with two supplementary variables in stratified double sampling. J Stat Theory Pract2020;14:1–16.
7.
SinghGNUsmanM. Generalized family of estimators using dual of supplementary variable under non-response. J Stat Theory Pract2021;15:1–35.
8.
ZamanTKadilarC. New class of exponential estimators for finite population mean in two-phase sampling. Commun Stat-Theory Methods2021;50:874–889.
9.
YadavSKZamanT. Use of some conventional and non-conventional parameters for improving the efficiency of ratio-type estimators. J Stat Manag Syst2021;24:1077–1100.
10.
ZamanTDünderEAuduA, et al.Robust regression-ratio-type estimators of the mean utilizing two supplementary variables: a simulation study. Math Probl Eng2021;2021: 1–9. doi:10.1155/2021/6383927
11.
RaoJ. Alternative estimators in PPS sampling for multiple characteristics, Sankhya. Indian J Stat A1966;28:47–60.
12.
SrivenkataramanaTTracyDS. Transforming the study variate after PPS sampling. Metron1979;37:175–181.
13.
AgarwalSKumarP. Combination of ratio and PPS estimators. J Indian Soc Agric Stat1980;32:81–86.
14.
PandeySSinghRK. On combination of ratio and PPS estimators. Biom J1984;26:333–336.
15.
AhmadSShabbirJ. Use of extreme values to estimate finite population mean under PPS sampling scheme. J Reliab Stat Stud2018; 11: 99–112.
16.
Al-MarzoukiSChesneauCAkhtarS, et al.Estimation of finite population mean under PPS in presence of maximum and minimum values. AIMS Math2021;6:5397–5409.
17.
SinghHPMishraACPalSK. Improved estimator of population total in PPS sampling. Commun Stat-Theory Methods2018;47:912–934.
18.
CochranW. The estimation of the yields of cereal experiments by sampling for the ratio of grain to total produce. J Agric Sci1940;30:262–275.
19.
MurthyMN. Product method of estimation. Sankhya: Indian J Stat A1964;26:69–74.
20.
BahlSTutejaR. Ratio and product type exponential estimators. J Infor Optimizat Sci1991;12:159–164.
21.
KumarSBhougalS. Estimation of the population mean in presence of non-response. Commun Stat Appl Methods2011;18:537–548.
22.
SinghHPKumarS. A regression approach to the estimation of the finite population mean in the presence of non-response. Aust N Z J Stat2008;50:395–408.
23.
AhmadSAamirMHussainS, et al.A new generalized family of exponential factor-type estimators for population distribution function using two supplementary variables. Math Probl Eng2022;2022: 1–13. doi:10.1155/2022/2545517
24.
MurthyMN. Sampling theory and methods. Calcutta-35: Statistical Publishing Society, 204/1, Barrackpore Trunk Road, India, 1967.