
Abstract
Previous researches has shown that inlet backflow may occur in a centrifugal pump when running at low-flow-rate conditions and have nonnegligible effects on cavitation behaviors (e.g. mass flow gain factor) and cavitation stability (e.g. cavitation surge). To analyze the influences of backflow in impeller inlet, comparative studies of cavitating flows are carried out for two typical centrifugal pumps. A series of computational fluid dynamics (CFD) simulations were carried out for the cavitating flows in two pumps, based on the RANS (Reynolds-Averaged Naiver-Stokes) solver with the turbulence model of k-ω shear stress transport and homogeneous multiphase model. The cavity volume in Pump A (with less reversed flow in impeller inlet) decreases with the decreasing of flow rate, while the cavity volume in Pump B (with obvious inlet backflow) reach the minimum values at δ = 0.1285 and then increase as the flow rate decreases. For Pump A, the mass flow gain factors are negative and the absolute values increase with the decrease of cavitation number for all calculation conditions. For Pump B, the mass flow gain factors are negative for most conditions but positive for some conditions with low flow rate coefficients and low cavitation numbers, reaching the minimum value at condition of σ = 0.151 for most cases. The development of backflow in impeller inlet is found to be the essential reason for the great differences. For Pump B, the strong shearing between backflow and main flow lead to the cavitation in inlet tube. The cavity volume in the impeller decreases while that in the inlet tube increases with the decreasing of flow rate, which make the total cavity volume reaches the minimum value at δ = 0.1285 and then the mass flow gain factor become positive. Through the transient calculations for cavitating flows in two pumps, low-frequency fluctuations of pressure and flow rate are found in Pump B at some off-designed conditions (e.g. δ = 0.107, σ = 0.195). The relations among inlet pressure, inlet flow rate, cavity volume, and backflow are analyzed in detail to understand the periodic evolution of low-frequency fluctuations. Backflow is found to be the main reason which cause the positive value of mass flow gain factor at low-flow-rate conditions. Through the transient simulations of cavitating flow, backflow is considered as an important aspect closely related to the hydraulic stability of cavitating pumping system.
Introduction
Cavitation not only reduces the hydraulic performances of centrifugal pumps, but also may cause instabilities in pumping systems. They include various modes such as cavitation surge and rotating cavitation. These instabilities are generally modeled by the transfer functions, which is used to indicate the relationship between the fluctuating hydraulic parameters at the inlet and outlet of pumps. Brennen et al.1,2 have made stability analysis based on the transfer functions for the cavitating pump by introducing two cavitation parameters: the cavitation compliance
If the cavitation compliance and the mass flow gain factor are respectively defined as
Tsujimoto et al.7,9 have also made a linear stability analysis for the flow instabilities in pumps, taking into account the cavitation effect in the continuity equation using mass flow gain factor and cavitation compliance. These studies showing that the onset condition of the cavitation surge and rotating cavitation can be represented by M > 2(1 + σ)ΦK, where σ and Φ are the cavitation number and flow rate coefficient, respectively. The cavitation compliance K and the mass flow gain factor M in these studies are respectively defined as
For the flow instabilities in cavitating pumps, backflow at the impeller inlet is reported to be an important factor affecting the dynamic behavior. 10 Many studies11–17 show that a certain amount of backflow main occur at the inlet of inducer or pump impeller when operating at low-flow-rate conditions, and sometimes lead to the backflow cavitation due to the low pressure at the core of backflow vortexes. To consider the impact of backflow, Yamamoto et al.10,11 have investigated the cavitation surge with backflow vortex cavitation observed at impeller inlet, occurring in a cavitating centrifugal pump under the flow rate condition of 0.5 Qdesign (Qdesign represents for the designed flow rate). The cavitation compliance and the mass flow gain factor are evaluated from the resonant frequency by assuming quasi-steady response of cavities. They found the obtained value of mass flow gain factor M is negative and could not explain the cavitation surge observed. Besides, they corrected the onset condition of cavitation surge and rotating cavitation to Mcos(α + π) > 2(1 + σ)ΦK, taking account of the phase delay of the cavity response due to the delay of the backflow development. Tsujimoto and colleagues11,18 have conducted a single phase numerical simulation for an inducer. By assuming that the cavity volume fluctuation is in phase with the angular momentum in the upstream, they deduced that the backflow responds to the flow rate fluctuation as a first-order lag element and the phase delay approaches 90° as the frequency is increased. So the backflow vortex cavitation will destabilize low frequency oscillations and stabilize high frequency oscillations.
Most previous investigations indicated that the mass flow gain factor plays an important role on pump system stability. But the values of these parameters were difficult to obtain. Usually they were estimated indirectly from resonance frequency obtained in experiments, based on 1D quasi-static linear acoustic analysis theory. Sometimes they failed to explain the occurrence of cavitation instability.11,18 Besides, the backflow occurring at the impeller inlet plays an important role in the dynamics of cavitation surge as reported in some studies.10,17,18 So the present study aims for the understanding of how backflow influence the mass flow gain factor and cavitation instability. A series of computational fluid dynamics (CFD) simulations were carried out for two typical pumps with different specific speeds to estimate cavitation performances, mass flow gain factors and cavitation compliances. The influences of backflow on the mass flow gain factor are comparatively analyzed. After that, in view of the internal cavitating flow fields, the backflow effects on the cavitation instability were further analyzed.
Numerical methods
Case descriptions
Two typical centrifugal pumps are chosen for the comparative analysis of cavitation performances, mass flow gain factors and cavitation compliances. The main parameters are shown in Table 1. Pump A is used in experimental investigation in Duplaa et al. 19 Pump B has much higher specific speed than Pump A.
The main parameters of two centrifugal pumps.

In the present study, cavitation compliance Kc and mass flow gain factor Mc are respectively defined as equations (1) and (2). The head coefficient ψ, cavity volume Vc, and inlet mass flow rate Qs are required to estimate the value of cavitation compliance and mass flow gain factor at different operating conditions. Thus 3D steady-state simulations with cavitating flows based on computational fluid dynamics methods are carried out for two pumps at different flow rate coefficients δ and cavitation numbers σ.


Governing equations
A commercial CFD code of ANSYS CFX is used in present work with a RANS (Reynolds-Averaged Naiver-Stokes) solver. The mass conservation equation and momentum equation are represented as equations (3) and (4), respectively. The bar is dropped for averaged quantities, except for products of fluctuating quantities. 20


where ui (i = u, v, w) is the velocity, xi (i = x, y, z) is the positon, t is the time, p is the pressure, μ is the dynamic viscosity, and SM is the external momentum source term. The Reynolds stresses
For cavitating flow, the homogeneous multiphase model is typically used because the vapor velocity field is assumed to be the same as the liquid velocity field. The ρ is defined as the density of mixture with the following definition:

where α is the volume fraction, the subscripts v and l represent the vapor and liquid phases, respectively. Based on the mass conservation equation (3), mass transfer equation is used to simulate the vapor-liquid mass transportation considering of the phase transformation between liquid and vapor in the mixture media.21–23

where the vaporization rate and condensation rate are respectively given as follows:


where Fvap and Fcon are vaporization rate and condensation coefficients, αnuc is the volume fraction of the nucleation sites, RB is the mean nucleation site diameter, and Pv is saturation pressure.
Computational domain and mesh validation
The computational domain of each centrifugal pump consists of an inlet tube, an impeller, a volute part, and an outlet tube, as shown in Figure 1. The mesh number independence should be tested because of the effect of mesh quantity on calculating accuracy and efficiency. The Grid Convergence Index (GCI) method based on Richardson extrapolation method is used in present work to evaluate the mesh resolution. A detailed description of the GCI method can be found in the Celik et al. 24 For Pump A, hexahedral meshes are generated for whole computational domain. For Pump B, tetrahedral meshes are generated for impeller part and hexahedral meshes for the others.

The partial computational cells for two pumps.
The head coefficients ψ are chosen as the key variable (ϕ) in the simulations for both pumps. Considering of the backflow at the impeller inlet of Pump B, the axial velocity of main flow (probed at z* = 0.4, r* = 0) and the circumferential velocity of backflow (probed at z* = 0.4, r* = 0.915) in inlet tube are chosen as the additional key variables for Pump B, where z* and r* are the dimensionless distance to impeller inlet and the dimensionless radial distance to impeller axis, respectively. For the off-designed conditions of δ = 0.0168, σ = 0.733 for Pump A and δ = 0.107, σ = 0.195 for Pump B, the calculations of the discretization error for the mesh are shown in Table 2. The convergence indexes of GCIfine 21 are within 1%. In the present work, the total number of cells is N1 = 3190506 for Pump A, and there are 3579031 meshes for Pump B including about 1.94 million tetrahedral meshes in impeller part and 0.77 million hexahedral meshes in inlet tube. The partial computational cells for two pumps are shown in Figure 1.
Calculations of the discretization error for the mesh.

Boundary conditions and numerical setups
Although the solution from the RANS equations has inherent limitation in simulating the development of backflow vortex structure,11,25 it can predict the performance and the impact of the backflow.26–29 Thus, the turbulence model of k-ω shear stress transport (SST) was utilized to simulate the inner flow field of pump in this study, due to its advantage of low cost and high accuracy for rotating machinery. The automatic near-wall treatment in ANSYS CFX is employed for all walls in pumps, which automatically switches from wall-functions to a low-Re (Reynolds number) near wall formulation as the mesh is refined. Calculations were carried out for both cavitating and non-cavitating conditions. Water and water vapor are chosen as working fluids. A homogeneous multiphase model has been applied for cavitating calculations and the growth of a gas bubble has been described by the Rayleigh-Plesset model with the saturated vapor pressure of 3540 Pa. 30 The basic simulation settings are listed in Table 3. Inlet and outlet conditions are respectively set through cavitation number and flow rate coefficient according to the operating condition. The flow filed of impeller part is simulated in a rotational frame while other domains are simulated in stationary frame. The blades and impeller walls are set as rotating walls while other walls are set as stationary walls. The interfaces between rotational and stationary components are set within frozen rotor method in steady calculations and transient rotor stator method in unsteady calculations, respectively. The time-step applied in the unsteady simulation is set as Δt = 1/210 T, based on the impeller rotation period T and the number of impeller blades. A coupled solver in ANSYS CFX is used in present work, which solves the hydrodynamic equations (for u, v, w, p) as a single system. This solution approach uses a fully implicit discretization of the equations at any given time step. 30 A detailed description of the numerical methodology can be found in ANSYS Academic Research. 30
Basic numerical settings.

Results
General performance
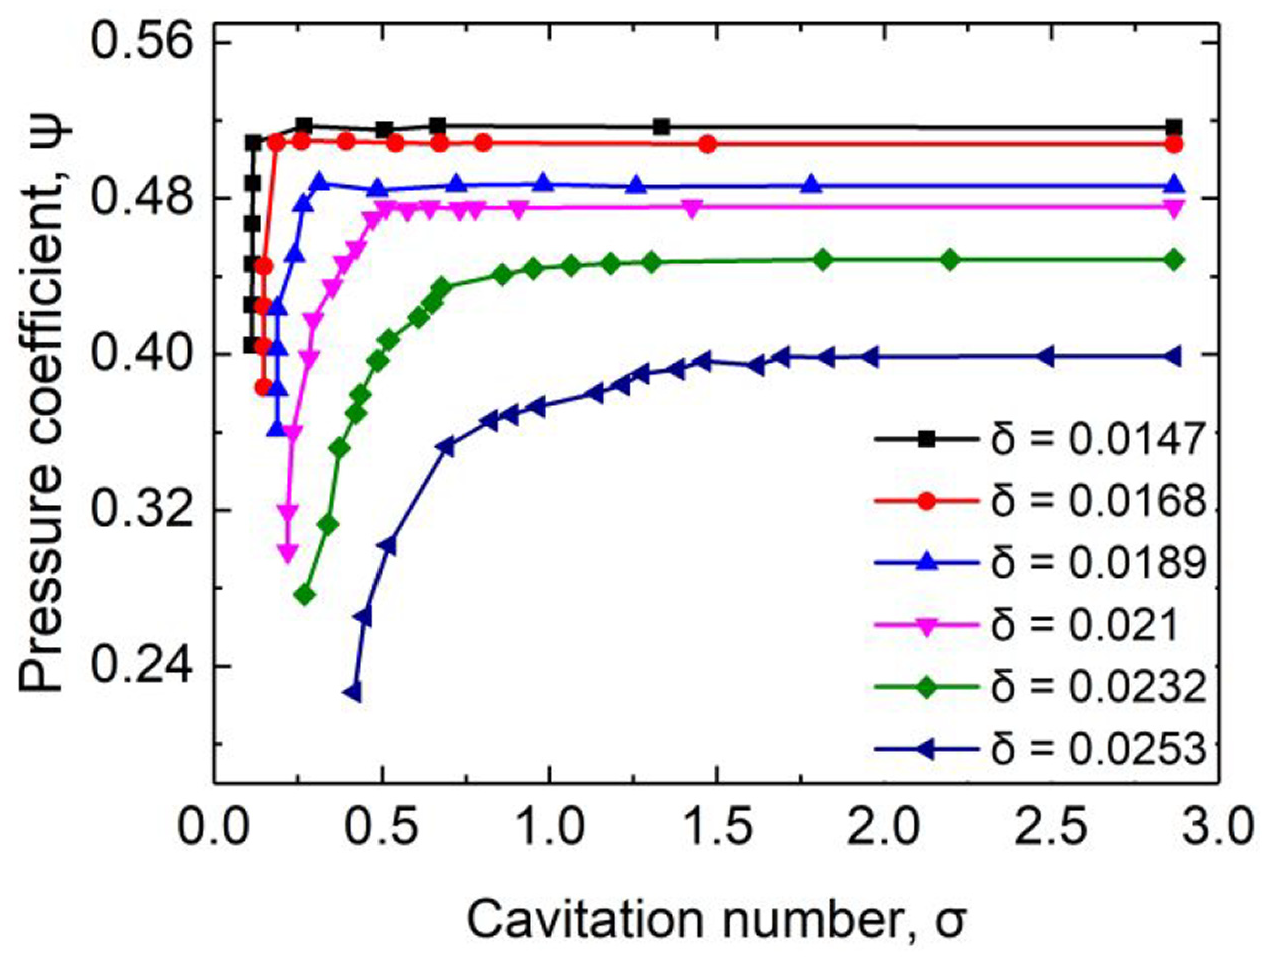
Firstly, steady simulations were carried out for two pumps at different flow rates and cavitation conditions to obtain general performances. The rotating speed was set to 2000 r/min for Pump A and 1500 r/min for Pump B. The performance curves obtained under non-cavitating conditions are shown in Figures 2 and 3. Comparisons with experimental data are made for pump A but only calculation results are presented for pump B for the lack of experimental data. The cavitation curves are shown in Figures 4 and 5, based on simulations with different flow rate coefficients and cavitation numbers. For both pumps the cavitation curves under large flow rate conditions show gentle slope with the decrease of cavitation number. However, the curves of Pump A show sudden head breakdown near critical cavitation number for low-flow-rate conditions, while that of Pump B has relatively gentle slope, because Pump B has relatively wider flow passage.

Non-cavitation performance curves of Pump A.
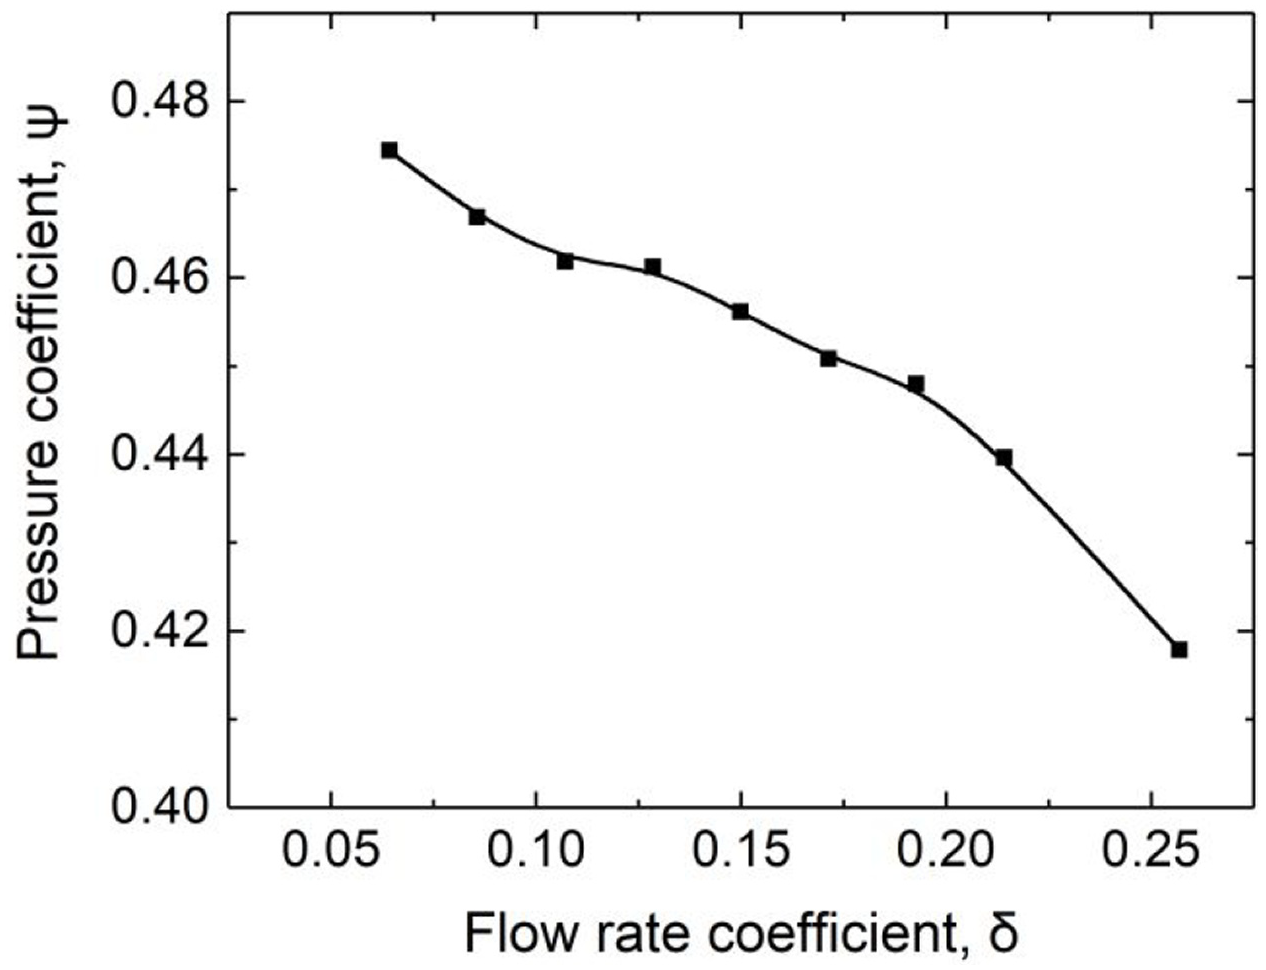
Non-cavitation performance curves of Pump B.
Cavitating performance curves of Pump A.

Cavitating performance curves of Pump B.
Cavitation compliance and mass flow gain factor
The cavity volume in the pumps were calculated with the equation (9) based on the vapor volume fraction αv obtained by the cavitating flow simulations. Based on the curve fitting between cavity volume and cavitation number, the cavitation compliances at different flow rate coefficients can be calculated through equation (1). Considering the vapor-water two-phase flow inside pumps, the equivalent cavitation compliance was calculated as equation (10).


Figures 6 and 7 show the curves of cavity volume versus flow rate coefficient at different cavitation numbers for two pumps. The curves of equivalent cavitation compliance versus cavitation numbers at different flow rate coefficients are plotted in Figures 8 and 9. For both pumps the equivalent cavitation compliance increases with the decreasing of cavitation number, but the curves for Pump A has steeper slope than that for Pump B near critical cavitation numbers.

The curves of cavity volume versus flow rate coefficient of Pump A.

The curves of cavity volume versus flow rate coefficient of Pump B.

The curves of equivalent cavitation compliance versus cavitation number of Pump A.

The curves of equivalent cavitation compliance versus cavitation number of Pump B.
The curves of mass flow gain factor at different flow rate coefficients can be calculated through equation (2) based on the curve fitting between cavity volume and inlet mass flow rate. Figures 10 and 11 show the curves of mass flow gain factor versus cavitation number. For Pump A, the mass flow gain factors are negative and the absolute values increase with the decrease of cavitation number for all calculation conditions, which means the cavity volume decrease with flow rate. For Pump B, the mass flow gain factors are negative for most conditions but positive for some conditions with low flow rate coefficients and low cavitation numbers. Besides, the curves are not monotonic. They reached the minimum value at condition near σ = 0.151 for most cases.

The curves of mass flow gain factor versus cavitation number of Pump A.

The curves of mass flow gain factor versus cavitation number of Pump B.
Discussion
Above results show that there are great differences on cavity volume and mass flow gain factor curves of two pumps. To investigate the reason for these differences, the cavities in two pumps under different cavitation numbers are illustrated in Figures 12 and 13 respectively, taking the condition of low-flow-rate coefficient as an example (for Pump A, δ = 0.0168; for Pump B, δ = 0.107). For Pump A, Figure 12 shows that the cavities are all located between blades and expand toward impeller outlet with the reducing of cavitation number. But for Pump B, except for the cavities between blades, cavities also appear in the inlet tube at the conditions with low cavitation numbers σ = 0.243~0.151.

The cavities (colored by αv = 0.05) in Pump A changing with cavitation number at flow rate coefficient of 0.0168.

The cavities (colored by αv = 0.05) in Pump B changing with cavitation number at flow rate coefficient of 0.107.
For Pump B, Figure 14 illustrates the cavities in Pump B at different flow rate coefficients with low cavitation number (σ = 0.151). The cavities only appear near the blade leading edge on the suction side with δ ≥ 0.1713. However, with δ ≤ 0.1499, a separated cavity appears in the inlet pipe and expand toward the pump inlet as flow rate coefficient decreases. Figure 15 shows the curves of cavity volume versus flow rate in impeller and inlet pipe. The cavity volume in the impeller decreases while that in the inlet pipe increases with the decreasing of flowrate, which make the total cavity volume in Pump B reach the minimum value at the condition of δ = 0.1285 and then increase as the flow rate decreases.

The cavities (colored by αv = 0.05) in Pump B changing with flow rate coefficient at cavitation number of 0.151.
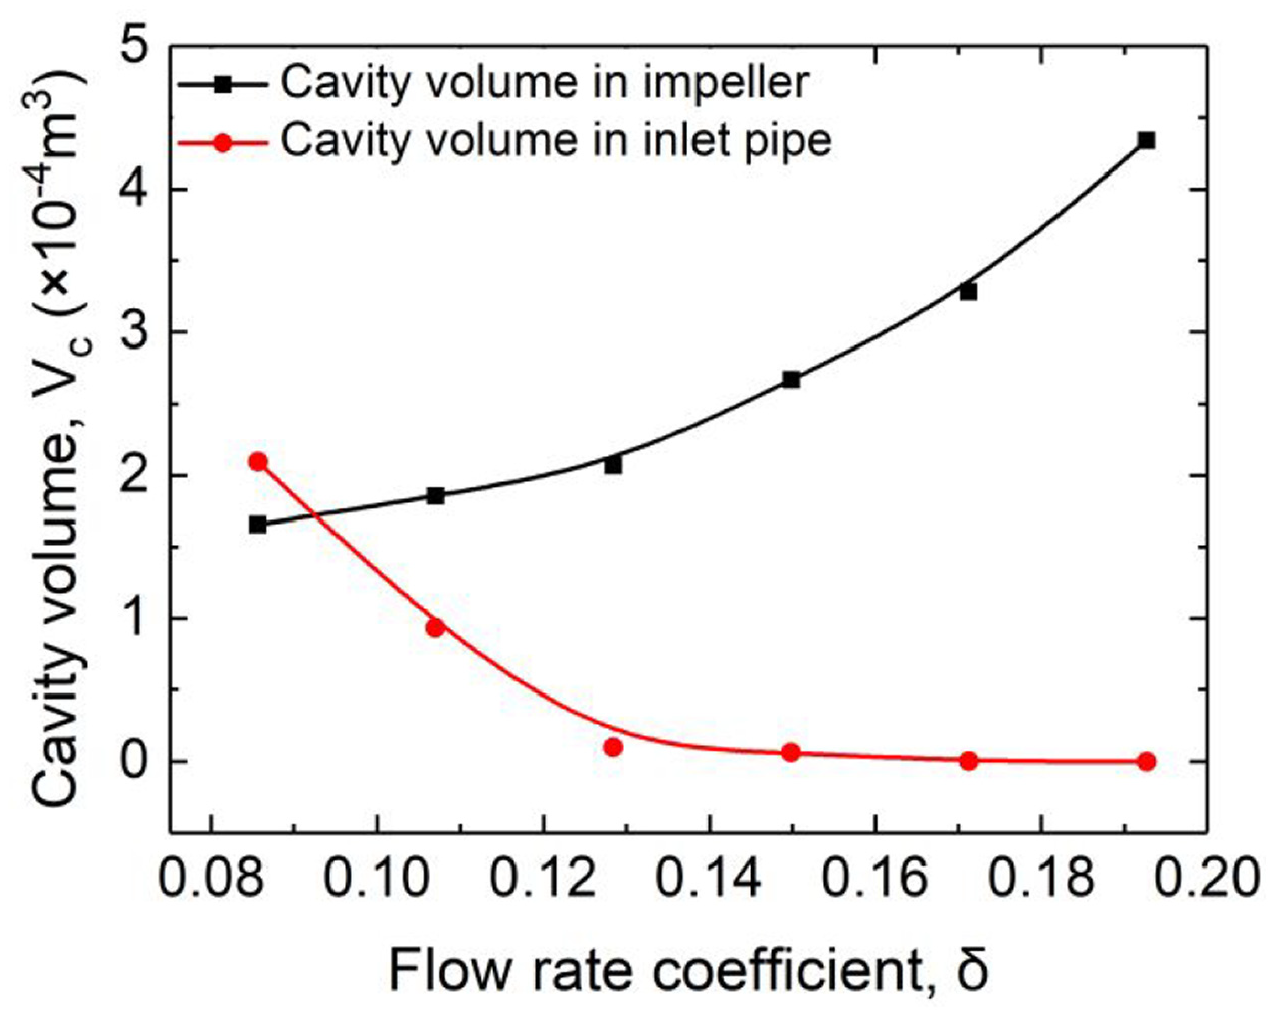
The curves of cavity volume versus flow rate coefficient in different region of Pump B.
Cavitation in inlet tube of Pump B is related to severe reverse flow here. Backflow has been observed even at designed flow rate (Qdesign) for Pump B but only at low flow rate (below 0.4 Qdesign) for Pump A. As flow rate decreases, severe backflow appears in the inlet tube of Pump B as shown in Figure 16 with the cavitation number σ = 0.151. The length of backflow and the value of velocities (vma for the axial velocity of main flow and vbt for the circumferential velocity of backflow) are also plotted in Figure 17. The backflow length and both velocities rise rapidly with the decreasing of flow rate.

The backflow streamlines in inlet pipe of Pump B, changing with flow rate coefficient and cavitation number.

The curves of backflow length and velocity magnitude versus flow rate coefficient at cavitation number of 0.151.
The strong shearing between the swirling backflow and the main flow may lead to cavitation in the inlet tube. As flow rate decreases, the backflow velocity increases and the backflow area increases. Because of blockage effect, the main flow velocity increases with the decrease of flow rate, which increases the shearing effect between backflow and main flow further, thus aggravates the cavitation in inlet tube. On the other hand, the increase of main flow velocity decreases the attacking angle at blade leading edge, which may cause the decrease of cavity volume inside impeller. In this way, the total cavity volume in Pump B would reach a minimum value at certain flow rate. This explains the mass flow gain factor being positive at some of the low flow rate conditions.
Transient simulation results
Above analysis based on steady simulations seems to imply that the development of reversed flow can aggravate cavitation in pump inlet tube. But at the same time, the results also show a tendency that the reversed flow length would decrease with the development of cavitation (see in Figure 16). To analysis the backflow effect on the flow stability further, transient calculations for cavitating flows were carried out for two pumps. There were no flow rate oscillation or low-frequency pressure pulsation in Pump A but only some pressure pulsations related to the impeller rotating and blades passing. However, for Pump B, results show obvious low-frequency fluctuations at some conditions with low flow rate coefficients and low cavitation numbers. Taking the condition with δ = 0.107 and σ = 0.195 as an example, there are obvious fluctuations with head (represented by coefficient ψ1–2), inlet-flow-rate-coefficient (φ1) and cavity volume (Vc) even with steady boundary condition (constant inlet total pressure and constant outlet mass flow rate). All the fluctuations have a low-frequency component of about 0.27 fn, and the pressure coefficients at different positions fluctuate synchronously. Similar study was firstly carried out in the previous work of this research, 31 which mainly presents the backflow phenomena near impeller inlet and its effect to the cavity volume and inlet flow rate. In this paper, the main results and conclusions are reviewed and further summarized to show the instability under the condition when the mass flow gain factor of Pump B is positive.
Figure 18 illustrates the evolution of cavities inside the pump at different instants in the low-frequency oscillations. The vapor areas in blue correspond to 5% vapor volume fraction. These images show the cavities are not only attached on blade suction side near leading edge but also appear as a hollow cylinder located in the shearing layer between the main flow and the reversed flow in the inlet tube periodically.

Cavity evolution in Pump B under the condition with δ = 0.107 and σ = 0.195.
Figure 19 shows the fluctuations of head ψ1–2, cavity volume Vc, pressure coefficient at pump inlet ψ1, inlet flow rate δ1, backflow volume Vbackflow, and axial velocities of main flow vma, further processed based on the previous work. 31 A 90° phase difference between cavity volume and inlet flow rate fluctuation means the mass conservation of cavitating flow field is satisfied, since the outlet flow rate was assumed to be constant. The phase of backflow volume fluctuation is opposite with that of inlet flow rate. So it can be concluded that the periodic growth and condensation of cavities in the pump cause the fluctuation of inlet flow rate and in return influence the backflow development. The cavity growth and condensation are controlled by the pressure, shown as a 180° phase difference between cavity volume and pump inlet pressure in Figure 19.

The fluctuations of head coefficient, cavity volume, inlet pressure coefficient, inlet flow rate coefficient, backflow volume and axial velocities on axial line in Pump B under the condition with δ = 0.107 and σ = 0.195. 31
Therefore, the relations among inlet pressure, inlet flow rate and backflow is very important to understand the periodic evolution of the cavities in the pump. Assuming a disturbance to decrease inlet flow rate, it will cause the increase of reversed flow in impeller inlet, as shown in Figure 19. The enhanced shearing between swirling backflow and main flow further aggravates the pressure drop and the cavitation located in the shearing layer in inlet pipe. The cavities subsequently reduce the reversed pressure gradient near impeller leading edge which is generally considered to be the main reason of reversed flow. Thus, the backflow volume begins to decrease while inlet flow rate starts to increase. Because of the reversed pressure gradient from the low-pressure region near impeller inlet to the high-pressure region away from the impeller, cavity volume becomes maximum when cavities reach high-pressure region. After that, cavities begin to collapse, and cavity volume reaches minimum when the cavities in inlet pipe disappear. Due to the mass conservation of cavitating flow field, 31 after cavity volume reaches maximum, inlet flow rate becomes larger than outlet flow rate, and then reaches maximum during the decreasing process of cavity volume. During the decreasing process of cavity volume and inlet flow rate, the reversed pressure gradient near impeller leading edge gradually increases and cause the aggravation of backflow and shearing effect. Then the pressure level near impeller inlet become lower, and consequently cavitation occurs and aggravates in inlet tube. Thus the next finite oscillation cycle will start.
Above study show that the low-frequency cavitation surge related to inlet reverse flow can be predicted by 3D transient hydro-dynamic simulation. Detailed analysis of the low-frequency oscillations show that the positive feedback caused by the reversed flow at impeller inlet is the essential reason of above cavitation instability. On the other hand, the development of cavitation has a tendency to suppress the backflow by reducing the reversed pressure gradient near impeller leading edge, like a damping effect. This damping effect, combining with the reversed pressure gradient in inlet pipe with respect to backflow, contribute to make a finite oscillation cycle.
Conclusions
In this paper, calculations of cavitating flow were carried out for two different centrifugal pumps at different conditions of flow rate coefficients and cavitation numbers. Comparisons of cavity volume, cavitation compliance and mass flow gain factor are made out for two pumps. The following conclusions can be made.
Backflow was found to have significant effects on mass flow gain factor. For the pump of low specific speed (Pump A) with less reversed flow in pump inlet, the cavity volume in the impeller decreases with the decreasing of flow rate, which result in negative mass flow gain factor. For the pump of high specific speed with severe inlet backflow (Pump B), the cavity volume in the impeller decreases while that in the inlet tube increases with the decreasing of flow rate, which make the total cavity volume in Pump B reaches the minimum value at certain cavitation number and the mass flow gain factor become positive.
Backflow also influence cavitation stability significantly, which can be explained by the 1D-acoustice analysis by taking into account of positive feedback caused by positive mass flow gain factor. The cavitation surge can also be predicted by 3D transient simulation, which revealed the periodic evolution of cavitation, inlet pressure, inlet flow rate, reversed flow etc. The essential reason of instability is positive feedback caused by the reversed flow at impeller inlet. But the damping effect of cavitation on the reversed flow, combining with the reversed pressure gradient in inlet pipe with respect to backflow, contribute to make a finite oscillation cycle.
However, the present 3D transient simulation didn’t take into account the influence of inlet pipe length, which may affect the system fluctuation frequency because of pipe system response. Further investigations are need in future in this aspect.
Footnotes
Notation
Kc = cavitation compliance of vapor
g = gravitational acceleration (m/s2)
ψ = head coefficient,
ΔP = total pressure difference between pump inlet and outlet (Pa)
ρ = density of fluid (kg/m3)
u2 = circumferential velocity at impeller outlet (m/s), u2 = πnD2/60
Vc = cavity volume in pump (m3)
σ = cavitation number,
Ps = area-average static pressure at pump inlet (Pa)
vs = area-average velocity at pump inlet (Pa)
Pv = saturated pressure of vapor (Pa)
u1 = circumferential velocity at impeller inlet (m/s), u1 = πnD1/60
Mc = mass flow gain factor
Qs = mass flow rate at pump inlet (kg/s)
δ = flow rate coefficient,
Qd = mass flow rate at pump outlet (kg/s)
r2 = radius of impeller outlet (m),
αv = vapor volume fraction
Kl = cavitation compliance of water
Kequ = equivalent cavitation compliance
z* = dimensionless distance to impeller inlet,
z = distance to impeller inlet (m)
r* = dimensionless radial distance to impeller axis,
r = radial distance to impeller axis (m)
vma = axial velocity of main flow (m/s)
vbt = circumferential velocity of backflow (m/s)
Lb* = dimensionless length of backflow,
Lb = length of backflow (m)
fn = impeller rotating frequency
ψ1-2 = head coefficient
ψ1 = pressure coefficient at pump inlet
δ1 = inlet flow rate coefficient
Vbackflow= backflow volume in inlet pipe (m3)
Declaration of conflicting interests
The author(s) declared no potential conflicts of interest with respect to the research, authorship, and/or publication of this article.
Funding
The author(s) disclosed receipt of the following financial support for the research, authorship, and/or publication of this article: This research was funded by the National Natural Science Foundation of China with the grant number of 52079141.