
Abstract
A numerical and experimental study was carried out to investigate the two-phase flow fields of the typical three valves used in the multiphase pumps. Under the gas volume fraction conditions in the range of 0%–100%, the three-dimensional steady and dynamic two-phase flow characteristics, pressure drops, and their multipliers of the ball valve, cone valve, and disk valve were studied, respectively, using Eulerian–Eulerian approach and dynamic grid technique in ANSYS FLUENT. In addition, a valve test system was built to verify the simulated results by the particle image velocimetry and pressure test. The flow coefficient CQ (about 0.989) of the disk valve is greater than those of the other valves (about 0.864) under the steady flow with a high Reynolds number. The two-phase pressure drops of the three valves fluctuate in different forms with the vibration of the cores during the dynamic opening. The two-phase multipliers of the fully opened ball valve are consistent with the predicted values of the Morris model, while those of the cone valve and disk valve had the smallest differences with the predicted values of the Chisholm model. Through the comprehensive analysis of the flow performance, pressure drop, and dynamic stability of the three pump valves, the disk valve is found to be more suitable for the multiphase pumps due to its smaller axial space, resistance loss, and better flow capacity.
Keywords
Introduction
Multiphase transport has become one of the most widely used and effective technologies in the mechanical industry.1,2 It helps to achieve the centralized purification, separation, and storage of the gas and liquid. Among various types of multiphase pumps, a reciprocating multiphase pump has a simple structure, high reliability, and excellent internal-compression performance. 3 And it can be applied to a wide range of the gas volume fraction (GVF) conditions in transportation and pressurization.
The hydraulic end of a single-acting reciprocating multiphase pump is shown in Figure 1. The pump valves are the key channels for the two-phase fluid to flow into or out of the reciprocating multiphase pumps. When the oil and gas pass through the pump valves, the two-phase flow characteristics in the valve cavities directly affect the flow capacity and pressure drop of the pump valves, and thus have a significant impact on the transport performance and energy consumption of the multiphase pumps. Therefore, studying the two-phase flow and pressure drop of the pump valves under different conditions of GVF = 0%–100% is important for the research and application of the multiphase pumps.
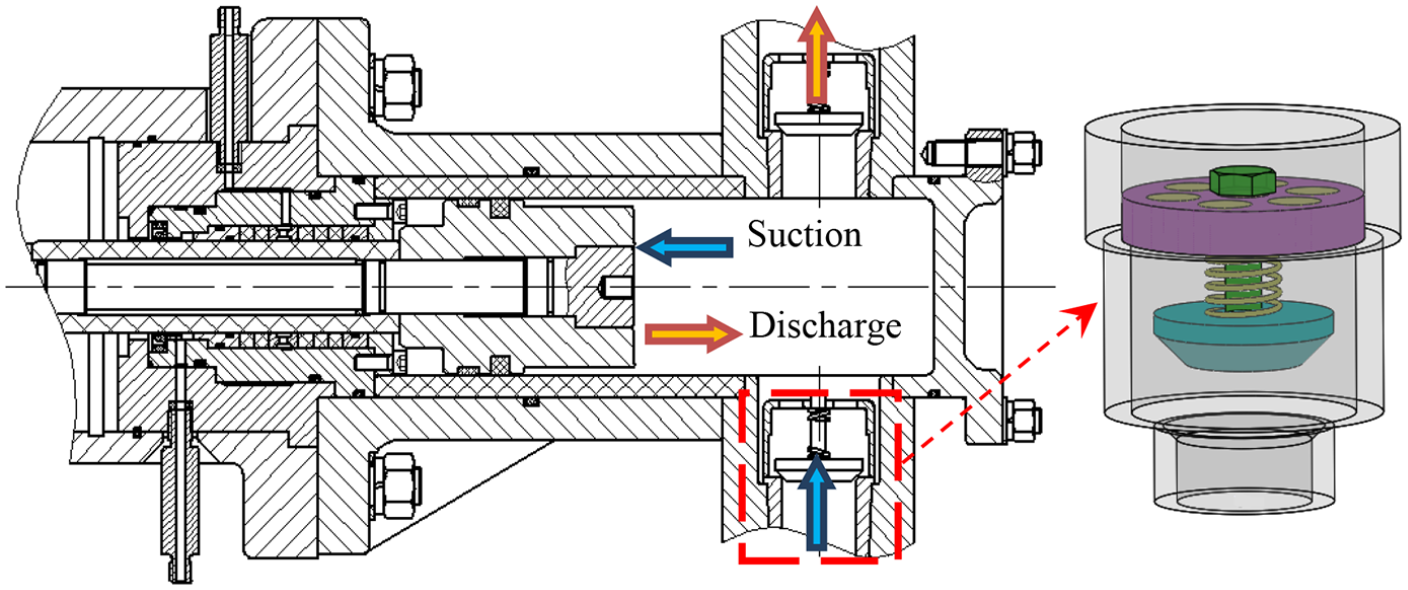
Schematic representation of hydraulic end and valves of a reciprocating multiphase pump.
A number of numerical or experimental studies4–7 have been conducted on the gas–liquid two-phase flow or compressible gas flow through the common valves such as the orifice valves and the relief valves. Their research methods and ideas on the gas–liquid two-phase valves can provide a basis for this study.8,9 However, the structural characteristics and the operating conditions of the multiphase pump valves are quite different from those of the above valves. The relevant research methods and results are not fully applicable to predicting the complex flow field and pressure drop inside the multiphase pump valves.
Moreover, the current studies on the multiphase pumps mainly focus on the macroscopic performances and the flow fields of the pumps,10,11 including the external characteristic,12,13 the pressure pulsation,14,15 and the main flow in the working cavities.16,17 These research works have contributed to the rapid development of the multiphase pumps. It can be noted, however, that even though the performances of the multiphase pumps have been greatly improved, the internal flow characteristics and resistance losses of the pump valves throughout the GVF range (0%–100%) and their correlations with the movements of the pump valves have not yet been deeply revealed. Therefore, it is necessary to comprehensively analyze the three-dimensional (3D) gas–liquid flow field, pressure drop loss, and flow capacity of the multiphase pump valves under multiple working conditions, so as to optimize the structure of the hydraulic end and improve the working stability of the multiphase pumps.
In this study, the objectives were to predict the gas–liquid two-phase flow and pressure drop characteristics of the typical valves used in the multiphase pumps. Based on the theoretical analysis of the valve performance and movement, the 3D steady-state and dynamic simulations of the two-phase flow fields in the valves were carried out by the computational fluid dynamics (CFD) method. The flow structures, vortex distributions, and the pressure drops in the valve cavities, as well as the pressure fluctuations during the transient opening of the valves, were analyzed, and a valve test system was built to realize the particle image velocimetry (PIV) visualization and the pressure drop test. The experimental results were compared with the simulated results to verify the reliability of the simulation, thus helping the design and development of the multiphase transport systems.
Object and theory
Object
The valves investigated in this study were the spring-loaded ball valve, cone valve, and disk valve used conventionally in the multiphase pumps. Figure 2 shows the structures and sizes of these three valves for a single-acting reciprocating multiphase pump. The valves consist of a valve body, a moveable core that is loaded by a spring and a guide bar, a limiter with six circular holes in a circumferentially uniform distribution, and a fluid director. The differences between the ball valve, cone valve, and disk valve are mainly the shapes of the valve cores and the heights of the main valve cavities.

Structures and sizes of multiphase pump valves: (a) ball valve, (b) cone valve, and (c) disk valve.
Key valve coefficient
The flow coefficient CQ is an important parameter evaluating the performance of the valves. It can be expressed as

where Q is the flow rate, ΔP is the pressure drop between the inlet and the outlet, and ρm is the density of the two-phase mixture, given as

where ρG is the gas density and ρL is the liquid density.
Av is the flow area of the valve clearance. For the cone valve and disk valve, the cone angles of the valve seats are the same as those of the valve cores. Av can be given as

where
For the ball valve, Av can be given as


where Rb is the radius of the ball,
Valve movement
The movement of a valve core can be determined based on a single degree of the freedom model owing to the setting of the axial guide bar. The valve core is mainly subjected to the gravity of the moveable component, the spring force, and the changing hydraulic force on the surfaces of the valve core.
Based on the force balance, the motion equation of the valve core is given as

where
And the velocity

The initial displacement is set as 0, and the maximum lift of the valve is set according to the actual working conditions.
Based on the above movement equation, this study used the user-defined function program to compile the boundary conditions of the moving valve cores in the CFD software. The continuous opening process of the valves was divided into the multiple time steps analyzed, and the movements of the valve cores were recorded in real-time. Correspondingly, the moving meshes near the valve cores were updated, thereby realizing the dynamic simulations of the two-phase flow fields in the multiphase pump valves.
Numerical methodology
Models and meshing
According to the sizes of the pump valves in Figure 2, the 3D flow runner models of the three multiphase pump valves were established by the Solidworks software, as shown in Figure 3(a). Considering that the diameter of the guide bar as shown in Figure 2 is less than one-eighth of the diameter of the main valve cavity, the structure of the guide bar was ignored when modeling. In addition, the influence of the spring behind the valve disk was simplified during the steady-state simulation, while the real-time force of the spring on the valve disk was considered during the dynamic simulation.

Models and grids of fluid domain for three valves: (a) sectional view of the models and (b) grids.
The meshes of the valves were generated using the ANSYS ICEM software, as shown in Figure 3(b). Due to the complicated structure of the flow regions near the valve core and the limiter, a hybrid mesh division method consisting of the structured hexahedral grids and adaptable tetrahedral grids was adopted, and the nodes were merged on the interfaces between the structural grids and the unstructured grids.
In the transient simulations, the dynamic grid technique was used with the user-defined functions to realize the regeneration of the grids in the domains near the moving boundaries of the valve cores. The initial computational regions and valve movements were defined first, and then the grids of the valve clearances were automatically updated with the changes of the dynamic boundaries in each iteration step by the schemes of smoothing, layering, and remeshing.
Turbulence model and boundary conditions
The Reynolds-averaged Navier–Stokes equations (RANS) with the RNG (Renormalization Group) k–ε turbulence model were solved in ANSYS FLUENT for the numerical simulations of the multiphase pump valves. The RNG k–ε turbulence model is a typical two-equation model, which has been proved to have relatively good stability, computational accuracy, and economics in the simulations of the valves and multiphase flow.18–20 It adds the extra terms and functions in the governing equation and has a greater degree of nonlinearity than the standard k–ε model. Moreover, the effect of the swirl on the turbulence is included in the RNG k–ε model, enhancing the accuracy for the swirling flows. Therefore, the RNG k–ε turbulence model was adopted in the following simulations.
In addition, the mixture model and the pressure-based solver were chosen to deal with the two-phase flow through the valves. The mixture model is a typical multiphase model using the Eulerian–Eulerian method, which mathematically treats the different phases as the interpenetrating continua. The mixture model solves for the mixture momentum equation and prescribes the relative velocities to describe the dispersed phases. It has been widely used to predict the gas–liquid flow over a wide range of gas contents.21,22
The boundary conditions were specified according to the working environment and flow capacity of the multiphase pump valves. The suction process of a reciprocating multiphase pump was selected for the numerical simulations. The reference pressure over all the domains was defined as the atmospheric pressure. The velocity and GVF were defined as the inlet condition, and the cavity pressure of the reciprocating multiphase pump was defined as the outlet condition of the valves. The initial conditions were set as Qi = 18 m3/h, GVF = 80%, and Po = 0.3 MPa. The dynamic boundaries of the valve cores were controlled to move in a single direction by the UDF program. The maximum valve lift hmax was set as 9 mm.
Grid independence check
The number and quality of the grids determine the computational accuracy and efficiency in the numerical simulations. The grid independence studies of the three valves with six different grid scales were performed, and the grid sizes were changed based on the reference value of the scale factor, as shown in Table 1.
Grid number for independence verification.
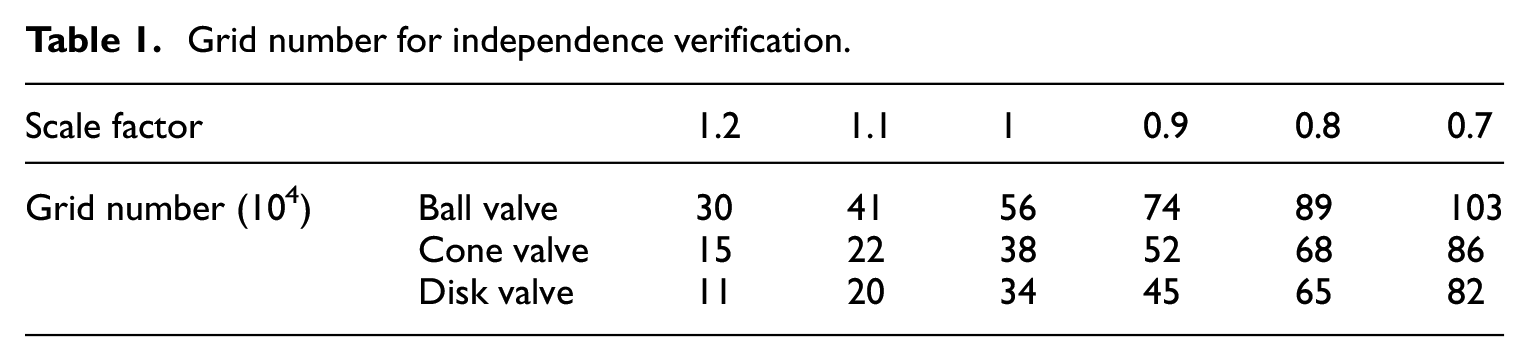
Figure 4 shows the grid-sensitive check results for the simulated flow coefficients of the multiphase pump valves. It could be seen that the CQ of these three valves does not change more than 0.2% when the grid-scale factor is 0.9. Therefore, the grid number of 74 × 104, 52 × 104, and 45 × 104 was adopted in the following simulations for the ball valve, cone valve, and disk valve, respectively.

Grid independence check for valve flow coefficients.
Experimental methodology and verification
In order to verify the accuracy of the flow simulation methods for the multiphase pump valves, a valve test system was built for the PIV visualization and pressure drop test. Considering the high level of the safety requirements for crude oil and methane, the PIV and pressure drop tests were carried out using the water or the water and air instead. The verified numerical simulations were performed with the same media conditions as the experiments.
PIV verification test
The PIV schematic diagram and test device for the valves are shown in Figure 5. The pipeline system mainly included a water tank, a pump, a frequency converter, a flow meter, a test valve made of plexiglass, and the other parts. The arrangement of the pipelines and the installation of the pressure gauges and valves were referred to GB/T 8107-2012 “Measurement of pressure drop-flow characteristics of hydraulic valves.” The tracer particles were evenly spread in the water tank, and the inlet flow rate and the outlet pressure of the test valve were adjusted by the frequency converter connected to the pump and the opening degree of the control valves in the pipelines, respectively.

PIV schematic diagram and test device of the valves: (a) schematic diagram and (b) test device.
The measurement system mainly included a camera of charge coupled device (CCD), a laser transmitter, a synchronous trigger, and a computer. The synchronous trigger controlled the laser emitter to emit a certain wavelength of the light source to illuminate the test plane of the transparent valve, and the CCD camera equipped with the filter performed the particle image acquisition. The double-frame single-exposure method and adaptive correlation were used to record and process the particle images in the test.
The flow vectors of the symmetry sections in the three valves were obtained by the PIV test and compared with the CFD simulation results, as shown in Figure 6. It can be seen that the vector fields inside the valves obtained by the numerical simulation have a good consistency with those obtained by the PIV visualization test, and the flow distributions in the longitudinal sections are very similar for the three kinds of valves. Specifically, the fluid injected from the inlet spreads around when flowing through the narrow valve clearance and forms a high-speed flow region near the surface of the valve core under the action of inertia. At the same time, the separation flow and vortexes occur with sudden changes in the flow cross section inside the valve cavity. The mainstream eventually flows out of the channels on the limiter. Therefore, the CFD simulation can be used to predict the actual flow patterns inside the multiphase pump valves.
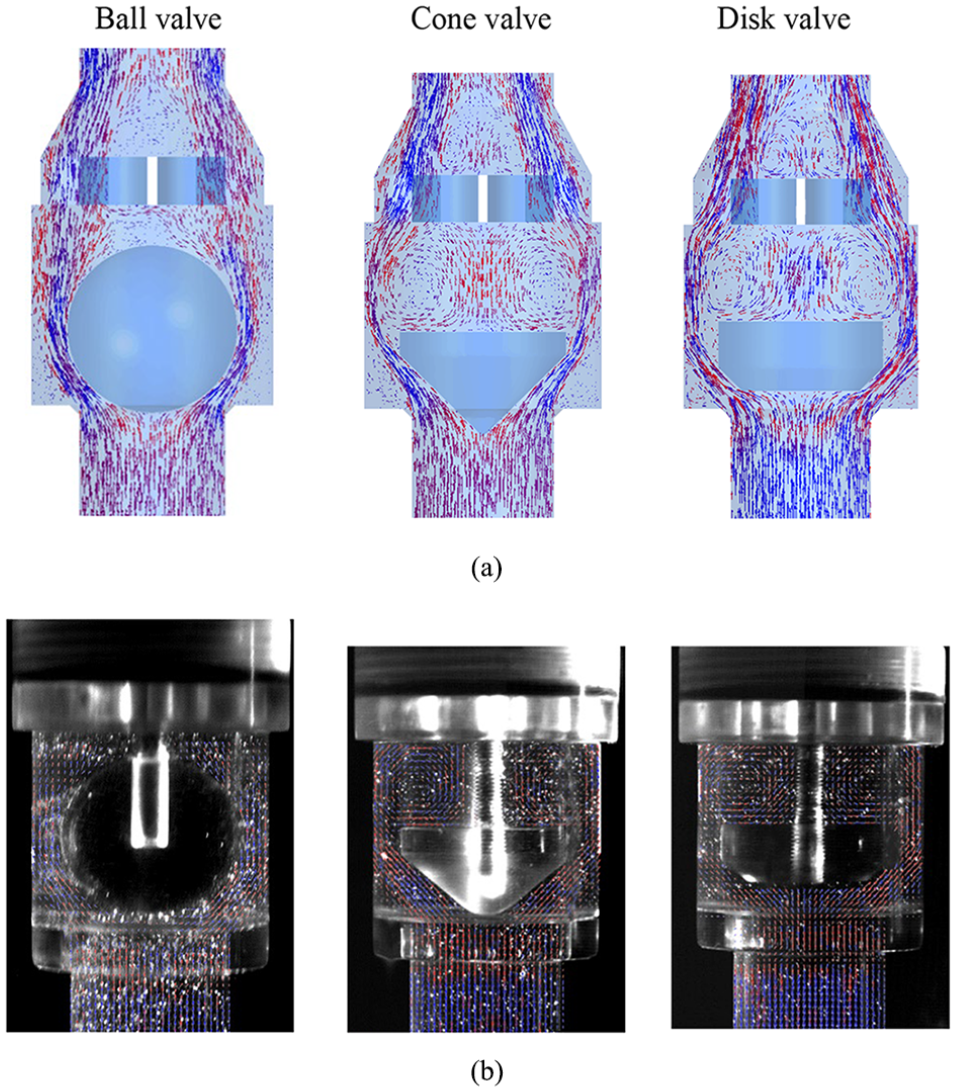
Comparisons of vectors in the three valves: (a) CFD simulation results and (b) PIV test results.
Furthermore, the values of the local flow velocities were extracted from the test vector diagrams. Taking the ball valve as an example, the experimental velocities at the inlet of the valve were compared with the theoretical and simulated values first, as shown in Figure 7(a). The dimensionless average velocities at the maximum cross section of the valve core relative to the inlet velocity were compared with the CFD simulated values under different valve lifts, as shown in Figure 7(b).

Comparison of the theoretical, simulated, and experimental velocities of the ball valve: (a) inlet velocities and (b) average velocities at the maximum cross section of the core.
The simulated velocity values at the inlet section of the ball valve basically coincide with the theoretical values, and the experimental velocities fluctuate slightly along the theoretical velocity line. The maximum error between the experimental, simulated, and theoretical velocities is within 5%, and the variations of the simulated average velocities in the valve cavities are roughly consistent with those of the experimental average velocities. When the ball valve is half opened (h/hmax = 5/9), the simulated values agree well with the experimental values, and the relative error does not exceed 9.5%. When the ball valve is fully opened (h/hmax = 1), the simulated values are less than the experimental values at a small flow rate
Two-phase pressure drop test
Based on the above PIV test system, an air pipeline system was added in parallel with the water pipeline system to build a gas–liquid two-phase pressure drop test device for the valves. The air pipeline system mainly included a compressor, a flow meter, and a control valve. A multi-hole gas–liquid mixer was installed at the junction of the water pipelines and the air pipelines. The gas enters into the pipeline from the small holes to form a bubble flow with a uniform two-phase distribution, which also effectively avoids the disturbance caused by the large bubbles to the liquid flow. The setting of the pressure measuring points conformed to the regulations of ISO9110-2 and the pressure values in front of and behind the valve on the pipeline were read by the pressure gauges separately. According to the calculation method of the pressure difference of the pipe connection in GB/T 8107-2012, the actual pressure drop of the fluid flowing through the valve cavity could be obtained by subtracting the pressure drop of the pipeline from the total pressure drop between the two pressure measuring points.
Figure 8 shows the simulated and experimental single-phase and two-phase pressure drop results of the ball valve under the lift h/hmax = 5/9. The changing trend and values of the simulated pressure drops are in good agreement with those of the experimental pressure drops. By the comparisons, the experimental single-phase and two-phase pressure drops are slightly larger than the simulated values when

Comparison of simulated and experimental pressure drops of the ball valve.
Results and discussions
Two-phase flow in the valves
Two-phase flow characteristic
Multiple characteristic cross sections were set to observe the internal flow characteristics of the multiphase pump valves in detail, and a full-scale view of the internal velocities and vortex distributions in the valve cavities were plotted under the conditions of h/hmax = 5/9, GVF = 80%, as shown in Figure 9. Since the tangential velocity vt was relatively small, only the radial velocity vr and the axial velocity vy were compared and analyzed in the following studies.
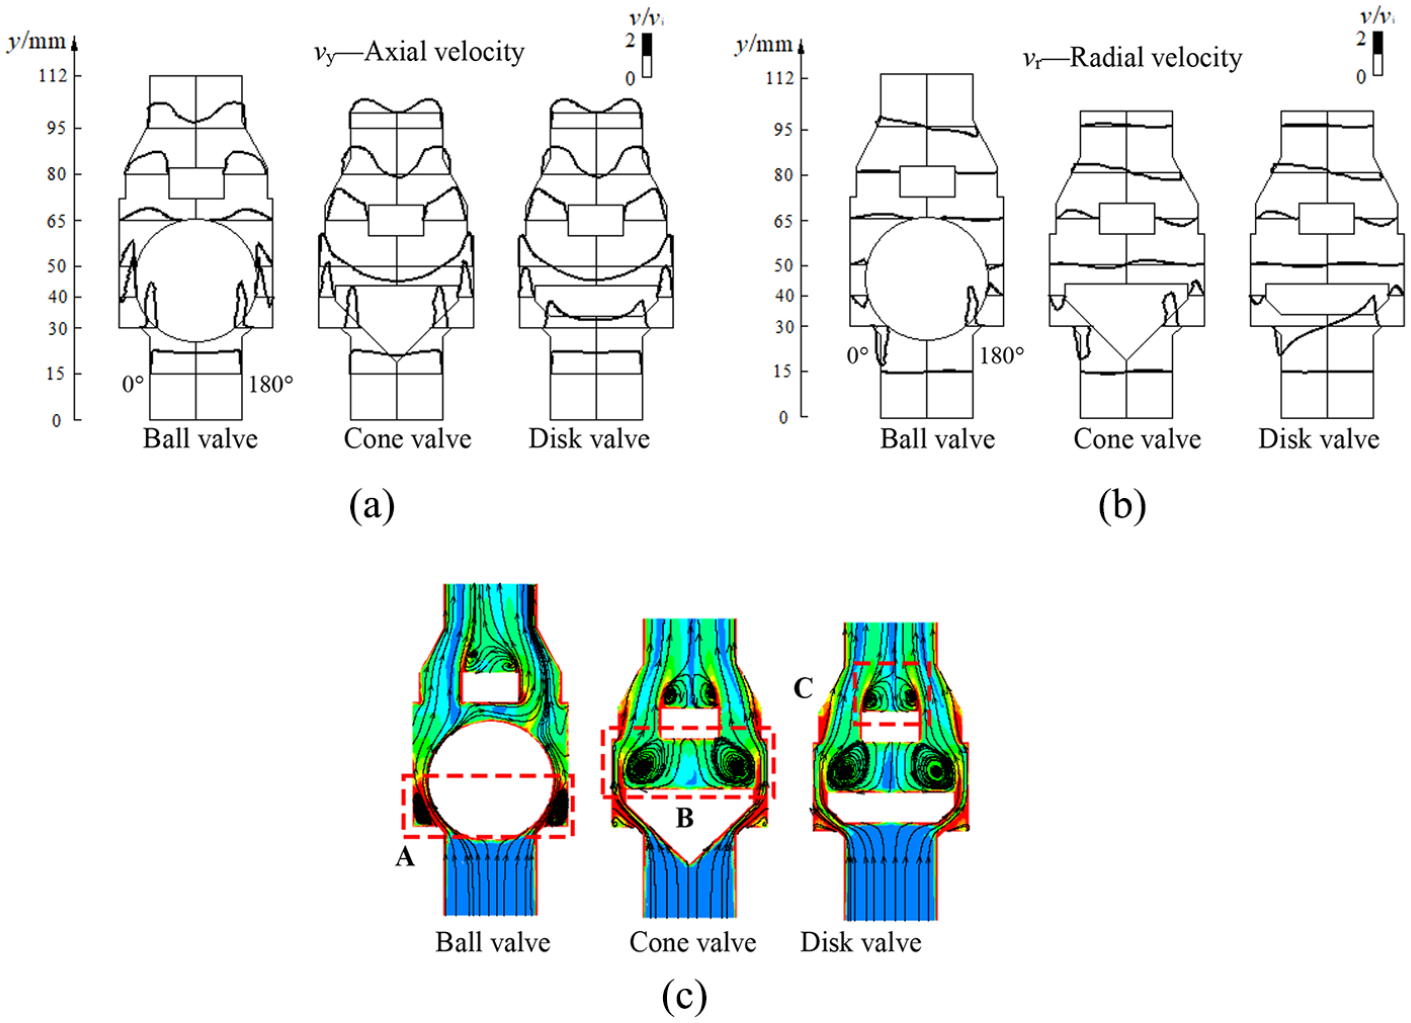
Two-phase velocities and vortex distributions (h/hmax = 5/9, GVF = 80%): (a) axial velocity, (b) radial velocity, and (c) vortex distributions.
Affected by the internal 3D turbulent flow patterns, the fluid flow center of a valve does not always coincide with its geometric center. The accelerating effect of the variable cross section of the narrow annular clearance between the valve core and the valve seat (i.e. the first throat) makes the fluid flow velocities reach their maximum values of the entire valve cavity. Especially, when a valve is just opened (h/hmax = 1/9), the clearance velocity magnitude can be 8.5 times the inlet velocity. With the two-phase circumferential jet around the core, a symmetrical separation vortex region (vortex A in Figure 9(c)) is generated above the valve seat (y/Y > 0.3). Limited by the flow area of the valve cavity, the vortex A is relatively closed to the top corner of the valve seat (for the ball valve, y/Y = 0.27–0.44, r/R = 0.72–1; for the cone valve and disk valve, y/Y = 0.3–0.43, r/R = 0.72–1), and it does not spread downstream. After the mainstream passes quickly through the maximum section of the valve core (i.e. the second throat), the boundary layer on the surface of valve core separates, especially for the blunt valve disk. A high-strength, large-scale vortex B appears in the central region behind the valve cores of the cone valve and the disk valve (y/Y = 0.41–0.59, r/R = 0–0.8). Similarly, blocked by the central entity of the limiter, a low-speed vortex region (vortex C) appears (for the ball valve, y/Y = 0.73–0.87, r/R = 0–0.4; for the cone valve and disk valve, y/Y = 0.69–0.84, r/R = 0–0.4). Due to the interference caused by the uneven flow at the back of its valve core to the mainstream, the vortex C in the ball valve alternates over a small range with a typical non-axisymmetric property.
The occurrence of the boundary layer separation and the formation of the vortexes constantly convert the useful mechanical energy of mainstream into the useless friction heat, and the total flow losses increase in the valve cavities. 23 Especially, for the vortex B behind the cores, part of the fluid has a large negative axial velocity and the gas phase is easily gathered and retained in this region. The same phenomenon can be observed in the experiment. In order to highlight the status of the valve core and the bubbles, a white plastic disk printed by the 3D printer was used instead of the previous plexiglass disk in the experiment, and the gas–liquid two-phase distributions in the disk valve were recorded at different times, as shown in Figure 10. When the two-phase fluid just enters the valve cavity, the gas and liquid phases are evenly distributed in the form of a bubble flow (Figure 10(a)). As the flow time increases, the bubbles begin to accumulate in the triangular region below the core and the cylindrical region above the core (Figure 10(b)). If the gas pipeline is temporarily closed, it can be seen that the bubbles continue to stay in the region of the vortex B (Figure 10(c)), which is likely to form certain cavitation and seriously affects the valve’s flow efficiency and service life.
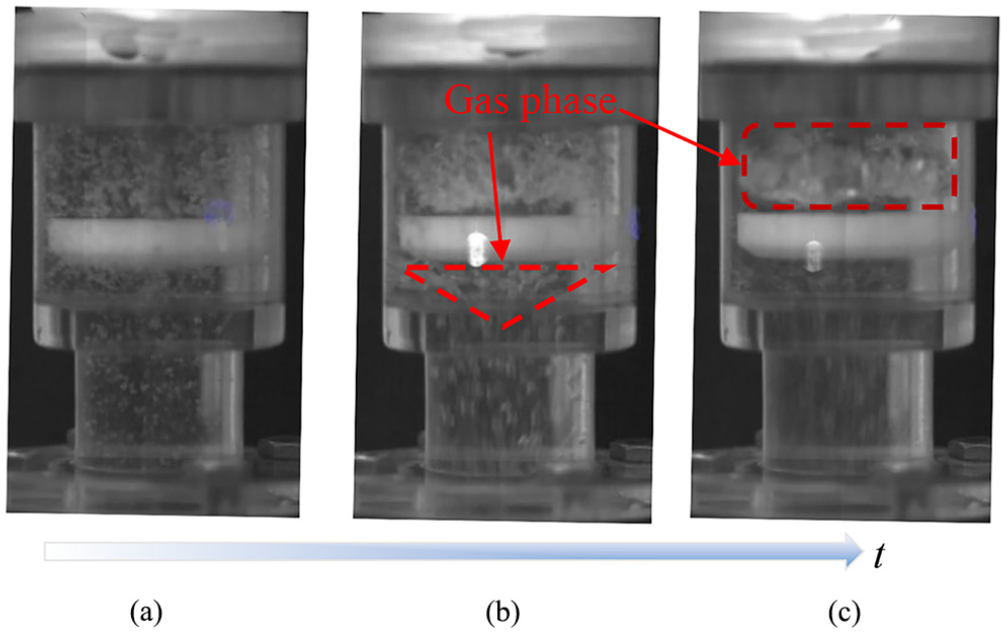
Changes of gas–liquid distribution in the disk valve with time (h/hmax = 1) (a) bubble form of the first stage, (b) bubble form of the second stage, (c) bubble form of the third stage.
Furthermore, the centers of the three vortexes in the valves were tracked to analyze the evolution of the vortexes during the opening of the valves. The point at which the local static pressure in each vortex range was the lowest was defined as the vortex center,24,25 and the changes of the axial and radial positions of the vortex centers with the lifts of the three valves were obtained, as shown in Figure 11.
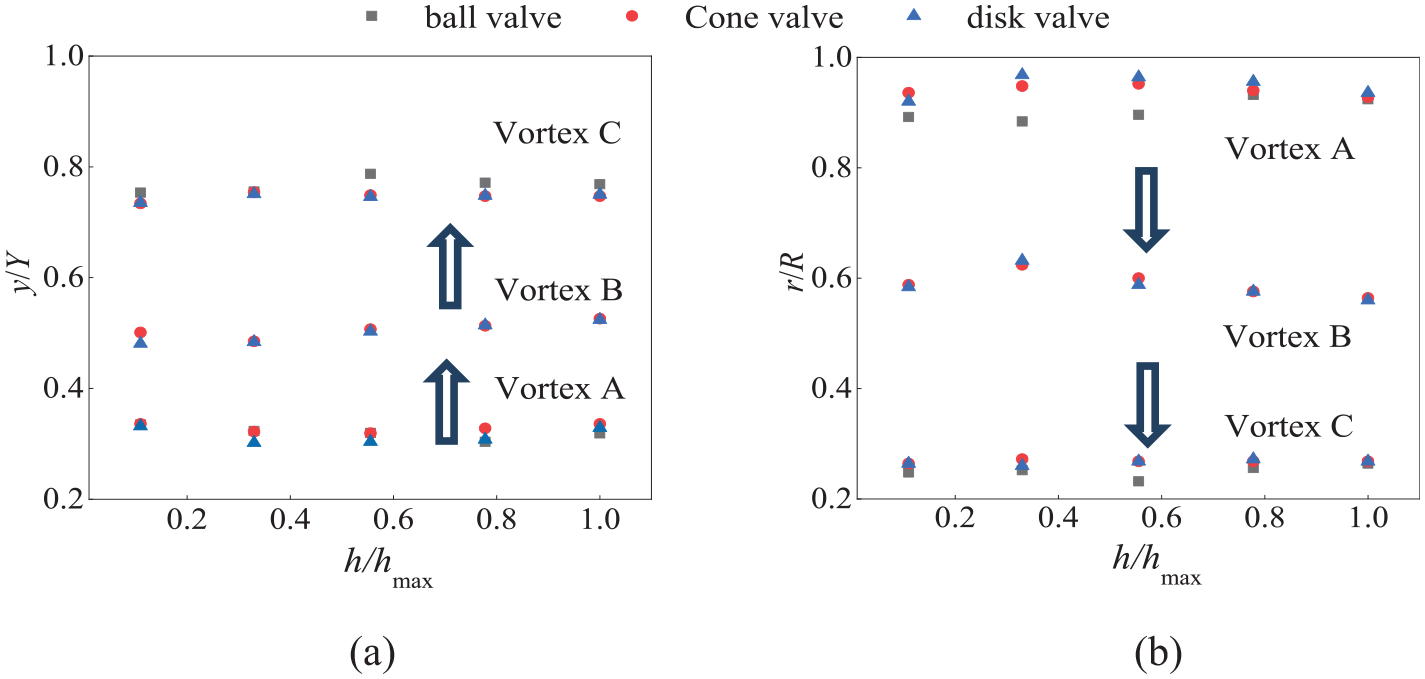
Axial and radial positions of vortex cores under different valve lifts: (a) axial position of the vortex and (b) radial position of the vortex.
For the cone valve and the disk valve, the main vortex A is closer to the valve wall of the main cavity under the parallel guidance of the first throat. As the valve opens from h/hmax = 1/9 to h/hmax = 1, the secondary vortex B gradually moves up and inward and the gas retention zone at the back of the valve core shrinks in the main valve cavity. However, the migration and evolution of both vortexes B and C have great uncertainty during the opening of the ball valve. It corresponds to the results of the vortex distribution contours. Obviously, the fluctuating vortexes in the ball valve will adversely affect the valve’s open–close process. Therefore, the gas–liquid two-phase flow fields in the three pump valves are easily disturbed by multiple factors such as the valve structure, working condition, and the physical property. Moreover, the unstable interactions between the fluid and the solid interface may cause the changes in the hydraulic forces on the valve cores and the pressure fluctuations of the valves.
Two-phase flow coefficient
Figure 12 shows the two-phase flow coefficient CQ of the three valves under different Re number and GVFs. As the Reynolds number increases, the flow coefficient CQ of the cone valve and disk valve gradually increase to a relatively stable value. However, under the influence of the asymmetric flow interference behind the core, the flow coefficient CQ of the ball valve still has a certain fluctuation when Re > 6000; and due to its smaller axial core length and friction loss, the flow coefficient CQ of the disk valve (about 0.989) is greater than those of the ball valve and the cone valve (about 0.864). It is consistent with the conclusions of Duan et al. 19 about the disk valve and cone valve. Moreover, the flow coefficients of the three valves are basically unaffected by GVF except for the gas-phase condition. The main reason is that the density of the gas phase is far less than that of the liquid phase, and the increase in GVF has little influence on the two-phase flow capacity of the valve cavity under the steady-state conditions.

Flow coefficients of valves under different Re and gas volume fractions.
Two-phase pressure drop and multiplier
Two-phase pressure drop
Figure 13 shows the changes of the pressure drops for the two-phase flow through the three valves as a function of GVF from 0% to 100%, for the different valve lifts (h/hmax = 1/9, 5/9, 1).

Two-phase pressure drops of three pump valves.
The pressure drops between the inlet and outlet of the three valves under different lifts are all strictly linearly negative-correlated with GVF within the full range of 0%–100%. The direct reason is that the gas–liquid two-phase density and viscosity decrease obviously with the increase of the gas content. Similar to the pressure characteristics of the conventional pipelines and local fittings,26,27 the pressure drops of the three valves increase quadratically with the increase of the inlet flow rate; that is, the sudden throttling of the narrow valve clearance and the irregular flow path of the main cavity result in a large amount of the energy loss of the two-phase flow, which is more obvious as the initial flow velocity increases.
The two-phase pressure drop decreases approximately exponentially during the opening process of the valves. The trend observed in the results is consistent with Hemamalini et al. 28 On the one hand, the fluid flow resistance in the first throat of the valve cavity is significantly reduced with the continuous upward movement of the valve core. On the other hand, the secondary vortexes shrinking at the back of the core further weaken the dissipated energy of the main flow in the valve.
When the valves are just opened (h/hmax = 1/9), the first throats of the cone valve and disk valve form an inclined annular clearance flow with the uniform cross sections, which are in sharp contrast to the clearance flow with the decreasing cross sections in the ball valve. This results in the larger flow resistances of the fluid in the clearances of the cone valve and disk valve. In addition, coupled with the influence of the large-scale vortex B at the back of the valve cores, the pressure drops of the cone valve and disk valve under the liquid-phase condition are about 25.2% and 27.6% greater than that of the ball valve, respectively. However, because of the severe disturbance and destruction of the clearance flow to the vortex A, the disk valve has the smallest pressure loss among the three valves when it is half opened (h/hmax = 5/9). After the valve is fully opened (h/hmax = 1), the upward movement of the jet center not only reduces the fluid velocity in the clearances but also provides more space and conditions for the existence of vortexes, so that the disk valve regains a greater pressure drop than the ball valve. The differences of the pressure drops between the cone valve, the disk valve, and the ball valve are up to 32.4% and 24.1% under the liquid-phase condition, respectively. By comparison, the cone valve always has a large amount of resistance loss during the valve’s opening because of its tapered guiding core and vortex intensity, and the ball valve has a relatively smaller pressure drop among the three kinds of multiphase pump valves under the steady working conditions.
Two-phase multiplier
According to the above studies, the two-phase pressure drops of the valves are significantly different from the single-phase pressure drops due to the mixture property, vortex intensity, and interphase coupling. Moreover, it can be known from the two-phase flow characteristics in the valves or the pipes that the frictional pressure drop caused by various reasons is the most important part of the total pressure drop.8,27 This means that the pressure drops in the valves are largely related to the friction between the two-phase fluid and the sidewall of the valve body, the collision loss between the fluid, the valve core and the limiter, and the energy dissipation of the fluid in the vortex zones.
A pressure drop multiplier

where
Figure 14 shows the changes of the two-phase pressure drop multipliers with the GVFs for the three valves. The two-phase multiplier increases slightly in the range of 1–2 and varies little with the valve lift when GVF ≤ 50%, and then increases sharply especially when GVF ≥ 70%. Due to the fact that the gas–liquid density ratio

Changes of two-phase multipliers with GVF under different valve lifts.
It can be seen that the two-phase pressure drop multiplier of the disk valve is the largest among the three types of valves over the entire range of the gas fraction, followed by the cone valve and the ball valve; that is, affected by the hysteresis zone before the disk and the large vortex region behind the disk, the resistance loss of the fluid flow inside the disk valve has the highest sensitivity to the physical properties of the fluid medium.
Currently, several correlation models of the two-phase multipliers in the pipelines or fittings have been proposed and obtained a certain academic and engineering recognition, such as the homogeneous model, 29 the Simpson et al. model, 30 the Chisholm model, 31 and the Morris model, 32 as shown in Table 2. In addition, researchers such as Alimonti et al. 5 and Zeghloul et al. 6 have studied the accuracies of these models in describing the relationship between the single-phase pressure drop and two-phase pressure drop of an orifice valve or the other valve. In order to further analyze the applicability of these mature models for the multiphase pump valves, the simulated two-phase multipliers of the valves were compared with the predicted results of the correlation models under different valve lifts and gas mass qualities x, as shown in Figure 15.
Typical correlation models of two-phase pressure drop multiplier.


Comparisons of simulated multipliers with correlation models.
It can be seen that the simulated two-phase multipliers of the three valves are always in the region between the lines predicted by the homogeneous model and the Simpson model. When the valves are just opened (h/hmax = 1/9), the sudden changes in the flow paths of the valves disturb the uniformly injected bubble flow, and the two-phase multipliers of the three valves are close to the predicted values of the homogeneous model. As the valve opens, the simulated multipliers gradually move away and downward. The two-phase multipliers of the ball valve are basically consistent with the predicted values of the Morris model 32 under h/hmax = 1, while those of the cone valve and disk valve have the smallest differences with the predicted values of the Chisholm model. 31 These results have some similarities with the conclusions obtained by Zeghloul et al. 6 Therefore, the above correlation models can predict the two-phase pressure drops of the pump valves to a certain extent, but they cannot fully describe the changes of the two-phase pressure drops under the complex working conditions and valve-opening processes.
Pressure drop fluctuation during dynamic valve opening
Further research works on the transient valve movements and dynamic pressure characteristics were carried out. A multiphase pump valve can be regarded as a valve-spring mass vibration system in the two-phase fluid, and the opening of a valve is a process of forced vibration and gradual stabilization by the excitation of the external flow field. Figure 16 shows the changing curves of the valve lifts and pressure drops for the three valves with the time t under the two typical gas fractions (GVF = 40% and 80%).

Dynamic valve lifts and pressure fluctuations of three pump valves: (a) GVF = 40% and (b) GVF = 80%.
The movement and vibration of a valve are inseparable from the gas–liquid two-phase flow characteristic in the cavity, which in turn affects the dynamic change of the pressure drop between the inlet and the outlet of the valve. Under the low gas fraction GVF = 40%, the hydrodynamic forces generated by the gas–liquid two-phase flow on the cores make the three valves open to the maximum in a very short time (about 0.004 s). Due to the smaller closing force caused by the core weight, the cores of the cone valve and disk valve move quickly and reattach to the limiters after a short rebound. Thus, the valve cores are in the optimal opening positions, and the dimensionless pressure drops of the two valves remain at about 0.1. This indicates that the cone valve and the disk valve can work stably at a low gas content.
However, influenced by the dynamic unbalanced secondary vortexes behind the core, the core of the ball valve continues to make the unstable non-contact oscillation in the lower part of the main cavity after being bounced back by the limiter. It then gradually suspends near the lift h/hmax = 2/9 after t = 0.1 s, so that the two-phase flow resistance of the ball valve is more obvious at such a small lift, and the pressure drop of the ball valve after stabilization can be up to four times that of the cone valve and disk valve. It can also be noted that the core of the ball valve finally reciprocates back and forth in the changing dynamic medium to find a balance point, so the valve core and the guide bar will always be in a state of high-frequency micro-vibration. It not only increases the flow resistance loss and pressure fluctuation rate of the valve but also seriously affects the life of the guide bar and its accessories. The resulting long-term wear of the guide bar will also have a significant impact on the centering and sealing between the valve core and the valve seat, which will lead to the premature failure of the valves.
Under the high gas fraction GVF = 80%, the increase in the compressibility of the mixture exacerbates the movement oscillations and pressure drop fluctuations of the three valves. The oscillation time of the ball valve is significantly prolonged, and the valve lift and pressure drop are gradually stabilized at t = 0.16 s. The core of the ball valve eventually stagnates at approximately one-third of the maximum lift hmax, which is slightly higher than the steady lift at GVF = 40%. Therefore, the pressure drop of the ball valve is reduced by 65.3% after being relatively stable, which is still much larger than those of the cone valve and disk valve under the same gas content.
Unlike the clinging characteristics under the low gas fractions, the cores of the cone valve and disk valves maintain the unstable contact oscillations near the limiter for a long time. Correspondingly, the pressure drops of the cone valve and disk valve are attenuated over a period of time until t = 0.15 s and then continue to fluctuate with an amplitude of 0.08. The frequent collision between the valve core and the limiter and the continuous change in the pressure drop will cause the vibration and noise of the valves, which can easily provoke the flow and pressure pulsations of the whole pump cavity. This will result in the reduced efficiency of the multiphase pump and the increased energy consumption and vibration of the pipeline system. Therefore, although the steady pressure drops of the cone valve and the disk valve are relatively smaller under the high gas fraction conditions, the working stabilities of the first two valves are not as good as that of the ball valve.
Conclusion
In this work, the steady-state and dynamic characteristics of the gas–liquid flow and pressure drop in the typical valves of the multiphase pump were studied by the numerical simulation and experiment. The CFD-simulated results of the valve flow field were validated with the experimental results by the PIV system and the two-phase pressure drops, and a good agreement was obtained. The flow coefficient CQ (about 0.989) of the disk valve is greater than those of the other valves (about 0.864) under the steady flow with a high Reynolds number. The two-phase multipliers at the full opening of the ball valve (h/hmax = 1) are consistent with the predicted values of the Morris model, 32 while those of the cone valve and disk valve have the smallest differences with the predicted values of the Chisholm model. 31 And the two-phase pressure drops of the three valves fluctuate in different forms with the vibration of the cores during the dynamic opening of the valves. Through the comprehensive analysis of the flow performance, pressure drop, and dynamic stability of the three pump valves, the disk valve is most suitable for the multiphase pumps due to its smaller axial space, resistance loss, and better flow capacity. The ball valve has better working stability than the other two valves at high gas contents, while the cone valve is not recommended for the multiphase pumps.
Footnotes
Appendix
Declaration of conflicting interests
The author(s) declared no potential conflicts of interest with respect to the research, authorship, and/or publication of this article.
Funding
The author(s) disclosed receipt of the following financial support for the research, authorship, and/or publication of this article: We are grateful for financial support from the National Natural Science Foundation of China (grant no. 51975527) and Zhejiang Provincial Natural Science Foundation of China (grant no. LY18E060011).