
Abstract
In order to further improve the mixing performance of the mixing device, the structure of the agitator was optimized, and the effects of the diameter and pitch of the agitator on the solid-liquid suspension characteristics were analyzed by single factor method. Multiple reference frame (MRF), computational fluid dynamics, Euler multiphase flow model and standard K- ε turbulence model were used to investigate the effect of the height from the bottom of the agitator on the suspension characteristics of particles in the agitator was studied. The results show that reducing the height from the bottom of the agitator can promote the suspension of particles at the bottom of the tank, but too low height from the bottom will easily produce mixing dead zone at the bottom of the tank, and cause the accumulation of particles. Reducing the height of the agitator from the bottom will enlarge the clear liquid area of the flow field, cause uneven particle distribution and increase the stirring torque. With the increase of agitator diameter, the critical suspension speed of the flow field decrease, but the stirring power required by the flow field increase. Increasing the blade spacing in a certain range can promote the suspension of particles and make the distribution of particles in the flow field more uniform. Therefore, the mixing power and the uniformity of particle concentration distribution need to be considered together in order to make the mixing device more efficient and energy-saving.
Keywords
Introduction
All kinds of solid-liquid stirred tank equipment are widely used in petroleum refining, chemical technology, medicine, energy, food processing industries process and so on. It is the most economical stirring operation to accelerate the dissolution of solid particles when the sinking particles are completely suspended in the stirring flow field of particles and liquid. There is no significant change for the increase of particle dissolution rate if the stirring intensity is increased to uniform suspension, but it will result in the exponential increasing of stirring power
1
(the stirring power in uniform suspension is about 4∼10 times that in complete suspension usually). The stirring speed when the solid particles just reach the state of complete suspension from the bottom is called the critical suspension speed
Phase refers to the same kind of substances with the same boundary conditions and dynamic characteristics in the flow field or geopotential field. And phases are generally classified as solids, liquids and gases. Multiphase flow is a fluid motion that contains two or more different phases at the same time. The current methods for numerical simulation of multiphase flow include Euler-Lagrange and Euler-Euler methods. Li et al. 3 simulated the solid-liquid two-phase flow field of an intermix impeller agitator with a new structure by using the Euler multiphase model and the standard k-ε turbulence model. Gu et al. 4 used Eulerian multiphase flow and combined with the standard k-ε turbulence model to numerically simulate the solid-liquid flow field under different structures of impeller agitators and analyzed the effects of impeller speed, power consumption, impeller type, aperture ratio, solid particle diameter and liquid viscosity on the suspension effect of solid particles. Li et al. 5 used the Eulerian two-fluid model as well as the RNG k-ε turbulence model to study the suspension characteristics of floating and sinking particles in the stirred tank and found a large difference between two. Chang et al. 6 performed the lattice Boltzmann simulation combined with unknown-index algorithm for the convective heat transfer problems of an impeller stirred tank, and focused on three types of motion of the heating impeller are adopted in this study, including rotation with constant angular velocity, oscillation and oscillating rotation. Kleiner et al. 7 used computational fluid dynamics to simulate a generic reaction in a stirred tank and studied the temperature control of the reactor, and found that the simulation approach is very well suited for a reaction-specific of the stirred tank. Li et al. 8 carried out a simulation of an unbaffled stirred tank reactor driven by a magnetic stirring rod by Euler-Euler model coupled with the volume of fluid (VOF) method, and results showed that LES model and RNG k-epsilon model can predict the better tangential velocity and axial velocity. Luo et al. 9 investigated the effects of geometrical and physical factors on light particles dispersion in stirred tank by agitation characteristic curve, and found that the agitation characteristic curves reflect the tendency of power consumption and particles distribution well in stirred tank. In addition, there are many researches10,11 about simulation theory and methods of multiphase flow and corresponding case analysis. However, it is rare to apply the flow field analysis method to the engineering application of multiphase flow to optimize the relatively optimal parameters.
Therefore, in this paper, we study the solid-liquid two-phase flow field of particles (sinking particles) and water, and analyze the velocity field distribution, particle concentration distribution, and stirring shaft torque of the flow field at different heights from the bottom of the agitator by means of numerical simulation to get the most suitable height from the bottom of the agitator. And at this height from the bottom, the particle concentration distribution in the flow field is analyzed to obtain the critical stirring speed and the stirring shaft torque by adopting different stirring speeds for numerical simulation when the particles are completely suspended, which can be used as the production process parameters (speed) and the basis for the design of the stirring motor.
Physical geometric model and meshing
Stirring device
The stirring device is usually composed of a stirring tank, agitator, a transmission mechanism, internal and external accessories in the tank, and its structure is shown in Figure 1.

Stirring device: extrusion tube, 2. Stirring tank, 3. Stirring shaft, 4. Agitator, 5. Baffle plate, 6. Entry hole, Agitator shaft seal, 8. Transmission device.
The agitator is a key component of the stirring device and has an important influence on the effect of stirring, therefore, the selection of the agitator is very important.
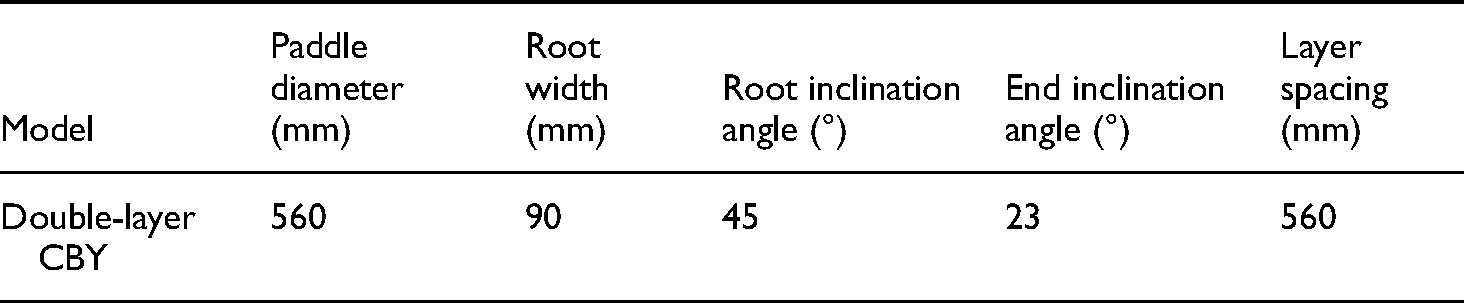
CBY agitator is a new type of axial flow agitator designed by Beijing University of Chemical Technology, which has the characteristics of low stirring power and high stirring efficiency. At present, and has been produced by many domestic manufacturers. 12 The stirring characteristics of CBY agitator are also widely studied, and Min et al. 13 studied the mixing characteristics of CBY agitator using CFD method and found that the stirring performance is good. CBY agitator is an efficient axial flow agitator suitable for low viscous fluid, therefore, CBY agitator meets the design standards. Secondly, considering that the ratio of the liquid level H to the tank diameter T is greater than 1.0, the double-layer CBY agitator is selected in this paper as the physical diagram shown in Figure 2, and the specific parameters are shown in Table 1.

CBY agitator.
Agitator parameters.
Geometric model
The elliptical bottom vertical cylinder stirred reactor and CBY type agitator were selected to model the fluid calculation domain. As shown in Figure 3(c), the stirring tank is cylindrical with an elliptical bottom, the diameter of the stirring tank is T = 1400 mm, the height of the straight section is h1 = 1300 mm, the depth of the elliptical bottom is h2 = 250 mm, and the total liquid level is H = 1550 mm. The agitator is a double-layer CBY three-blade paddle, the diameter of the blade is D = 0.4 T, the width of the root is W = 90 mm, the inclination angle between the root of the blade and the horizontal direction is β1 = 45°, the front inclination angle is β2 = 23°, the spacing of the blades K = D. Four baffles are evenly distributed inside the stirring tank, and the width of the baffles is T/12. The height C of the agitator from the bottom is C1 = 220 mm, C2 = 250 mm, C3 = 280 mm and C4 = 310 mm.

Establishment of finite element model.
Meshing and time step
As shown in Figure 3 (a) below (Height is expressed by ch), the suspension effect obtained by setting the speed of 150 rpm and time step to 0.01 s is the average volume fraction distribution of particles in 9 radial sections with different heights under three different grid numbers (A1, A2 and A3, grid numbers 502,415, 651,276 and 803,526 respectively). It can be seen from the figure that the trend of A2 and A3 in the whole figure is basically the same, while the trend of A1 is completely different from that of the other two curves. Therefore, it can be explained that the suspension effect of the number of grids at 650,000 and 800,000 is basically the same. Considering the two aspects of calculation cost and calculation accuracy, the grid division method of 650,000 is selected.
As shown in Figure 3(b) below, the suspension effect obtained by setting the speed of 150 rpm and the number of grids to 650,000 is the average volume fraction distribution of particles in 9 radial sections with different heights under three different time distributions (B1, B2 and B3 are time distributions of 0.001 s, o.01 s and 0.05 s respectively). It can be seen from the figures below that the trend of section curves at different heights under three different time distributions is basically the same. In order to facilitate the simulation experiment, the distribution time step is selected as 0.01 s.
Through the comparison and analysis of the above two figures, considering the calculation cost and accuracy, about 650,000 grids and 0.01 time steps are selected as the calculation method.
The calculation model is meshed by Fluent Meshing software, and the calculation model is divided into two areas, namely the rotational movement area and the static area. The rotational movement area includes the upper blade rotation area and the lower blade rotation area, and the rest are static areas. The whole area is divided by a grid with a hexahedron as the core, and local mesh refinement is performed on the rotating area, which helps to improve the calculation accuracy. The meshing is shown in Figure 3(d), where the number of grids ranges from 600,000 to 650,000.
CFD calculation model
Multi-phase flow model
In Euler-Euler method, both liquid and solid phases are considered as continuous media filled with flow field and interacting at the same time. Since the volume occupied by one phase can no longer be occupied by other phases, the concept of phase volume fraction is introduced. The volume fraction is a continuous function of time and space, and the sum of the volume fractions of each phase is 1.0. Compared with the Euler-Lagrange method, the Euler-Euler method has a much smaller amount of calculation and more suitable for the numerical calculation of solid-liquid two-phase flows at higher solid contents.14–16In this paper, the Euler-Euler method two-phase flow model is used to calculate the stirred flow field using Fluent software. Its continuity equation is as follows.
The momentum conservation equation of liquid phase is expressed as follows:


Drag model
In this paper, the Gidaspow drag coefficient model is used, which is suitable for the solid-liquid flow field with high solid holdup.17–19 The Wen-Yu model is employed when the solid content of the flow field is lower than 20%, and the equation form is as follows:


Turbulent flow model
At present, the most representative turbulence model is the k-ε turbulence model of the Reynolds time-average method, which is widely used in stirred flow field. This model defines ε (turbulent energy dissipation rate) as:

The k-ε model includes the standard k-ε model, Realizable k-ε model and RNG k-ε model. Among them, the standard k-ε model has higher economy, stability and calculation accuracy, so the standard k-ε turbulence model is adopted in this paper. The equation form is as follows.


Calculation results and discussion
Numerical simulation method
The solid-liquid flow field is numerically simulated by using Fluent software, and the Euler two-phase flow model with standard k-ε stirring model is employed in this paper, where the liquid phase is liquid water with a density of 998.2 kg/m3, the solid phase is urea particles with a particle diameter of 2 mm, a density of 1335 kg/m3, and a solid volume fraction of 26.5% (calculated by the production process concentration (32.5%) based on the vehicle urea solution). The Gidaspow model is used for the solid-liquid inter-phase drag model.
The rotation area uses the multiple reference system method (MRF), and the initial conditions are set to the urea particles with a phase volume fraction of 26.5% are uniformly suspended in liquid water, and the Phase Coupled SIMPLE algorithm based on pressure and velocity coupling is used for unsteady calculation, with an iteration step of 30. the convergence condition is that the residuals of all equations are less than 10−3, and the calculation is completed by monitoring the velocity and solid phase volume distribution in the stirring flow field without changing with time.
Influence of the agitator height from the bottom on the flow field
Velocity field
As shown in Figure 4, they are the vector diagrams of the axial speed of different stirrers height from the bottom C (220 mm, 250 mm, 280 mm and 310 mm) at a rotation speed of 200 r/min. Local vortex are formed at the bottom of the tanks of the four flow fields. As the height from the bottom decreases, the range of the vortex will become smaller. When the height from the bottom is 220 mm and 250 mm, the vortex range in the middle of the tank bottom is smaller, and the particles in this area are also more difficult to suspend.

Axial velocity vector diagram at different heights from the bottom (XOZ plane).
Particle volume fraction
Figure 5 is a cloud diagram of the axial distribution of particle concentration at different heights from the bottom of the agitator at a speed of 200 r/min. At the four heights from the bottom, the maximum local concentration of particles appears at the bottom of the stirring tank. When the height from the bottom increases from 280 mm to 310 mm, the high concentration area of the bottom particles increases; when the height from the bottom increases from 220 mm to 280 mm, the high concentration area of particles is reduced. It shows that reducing the height from the bottom can make the velocity of the bottom flow field greater, thereby promoting the suspension of bottom particles and reducing local accumulation. However, a too low height from the bottom can easily form a stirring dead zone, which will cause the accumulation of particles. In addition, as the height from the bottom increases, the axial distribution of particle concentration gradually increases. When the height from the bottom is 220 mm and 250 mm, there is a larger clear liquid area near the liquid surface of the flow field, and the clear liquid area of the back flow surface of the baffle is also larger; when the height from the bottom is 280 mm and 310 mm, the axial distribution of particle concentration is higher near the liquid surface, and the particle concentration of the flow field is more uniformly distributed at this time, This is because when the height from the bottom increases, the upper paddle is closer to the liquid surface, so that the axial flow range of the fluid is larger and the suspension height of particles is higher. Therefore, reducing the height of the agitator from the bottom will result in a larger clear liquid area near the liquid surface, making the particle suspension effect of the flow field is poor.

Cloud diagram of the axial distribution at different heights from the bottom.
Table 2 shows the average volume fraction of particles at the bottom of the tank at four heights from the bottom. It can be seen from the table that when the height from the bottom is 280 mm, the average volume fraction of bottom particles is the lowest, which is 0.2803 and is the closest to the average volume fraction of the flow field.
Average volume fraction of particles at different heights from the bottom.

Distribution uniformity of particle
In order to study the uniformity of particle concentration distribution in the flow field, 9 radial sections along the axial height were intercepted for the flow field at four different heights from the bottom, and the height ch is 0.1 H~0.9 H (total liquid level H = 1550 mm), and calculate the average particle volume fraction of the cross section respectively, and compare with the initial particle phase volume fraction (26.5%). In addition, the concentration standard deviations A of the four flow fields are calculated by the average particle volume fractions of the 9 cross-sections. When the standard deviation is smaller, the particle concentration distribution in the flow field is more uniform, which is used as the uniformity judgment of the flow field particle distribution. And the standard deviation formula is: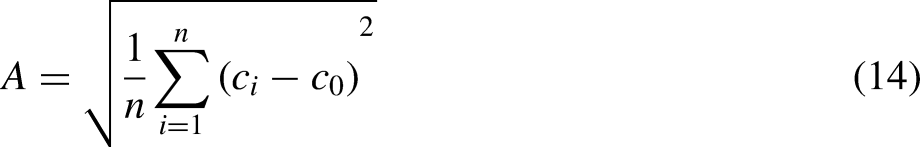
As shown in Figure 6, it is a distribution diagram of the average volume fraction of particles of 9 radial cross-sections at four different heights from the bottom (C1, C2, C3, C4 are 220 mm, 250 mm, 280 mm, and 310 mm from the bottom, respectively). It can be seen from the figure that when the height from the bottom is 280 mm and 310 mm, the particle concentration curve in the area with a cross-sectional height of 0.3 H~0.8 H is close to a straight line, indicating that the particle concentration distribution in this area is relatively balanced, and the two curve is closer to the straight line of the average concentration of the whole tank, indicating that the height from the bottom at this time has a better suspension uniformity. Secondly, in the area of 0.8 H~0.9 H, the particle concentration at the four heights above the bottom is much lower than the average concentration of the whole tank. However, with the increase of the height above the bottom, the particle concentration in this area also increases relatively. Which is due to the increase of height from the bottom, the upper blade is closer to the liquid surface, which makes the velocity near the liquid surface increase (which can be observed from the velocity field).

Average volume fraction distribution of particles in radial section.
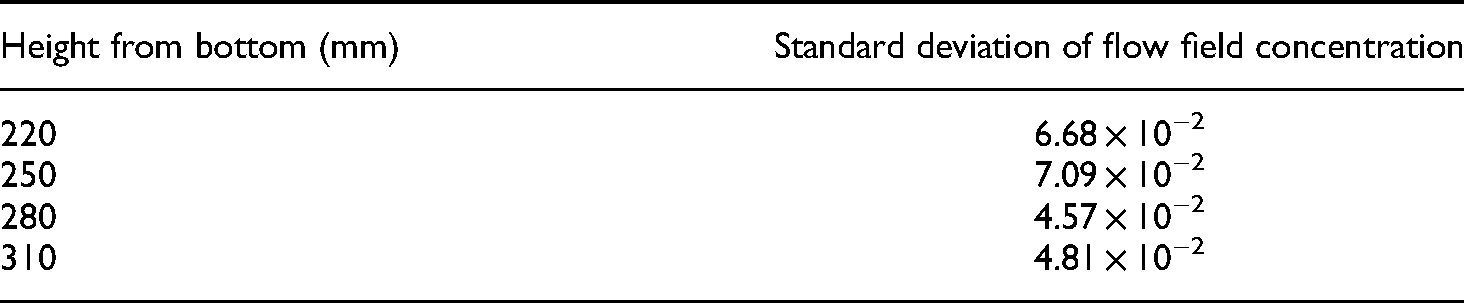
The standard deviation A of the flow field concentration at four off-bottom heights is calculated and counted in Table 3., as shown in the table, the standard deviation of the flow field concentration is the smallest at 4.57 × 10⁻² when the off-bottom height C is 280 mm, indicating that the particle distribution of the flow field is the best at this time, which is conducive to the dissolution of particles. Combined with Figure 6, it is found that the average concentration of particles in the cross-sectional area from 0.2 H to 0.7 H is high at this time, and the concentration of particles in the cross-sectional area from 0.7 H to 0.9 H is relatively low, resulting in a large difference in the concentration of particles in the upper and lower areas of the flow field, which is the reason for the large standard deviation, and the suspension effect is not ideal at this time.
Standard deviation of concentration.
Determination of the height from the bottom
Table 4 shows the particle suspension effect and stirring torque of the flow field at four heights from the bottom. At the same stirring speed, as the height from the bottom decreases, the stirring shaft torque will increase. Among them, the stirring torque is the lowest when the height from bottom is 310 mm, followed by the height from the ground 280 mm. From the viewpoint of the suspension effect, the standard deviation of particle concentration and flow field concentration distribution at the bottom of the tank is the smallest when the height from bottom is 280 mm, therefore, the solid-liquid suspension effect is the best when the height from bottom is 280 mm, which is beneficial to the dissolution of particles. Combining the particle suspension effect and the stirring shaft torque, better particle suspension effect with limited stirring shaft torque can be obtain when the height from bottom is 280 mm.
Suspension effect and stirring shaft torque.

Influence of the diameter of the stirring paddle on the suspension characteristics
Determine of the model and the critical speed of full suspension
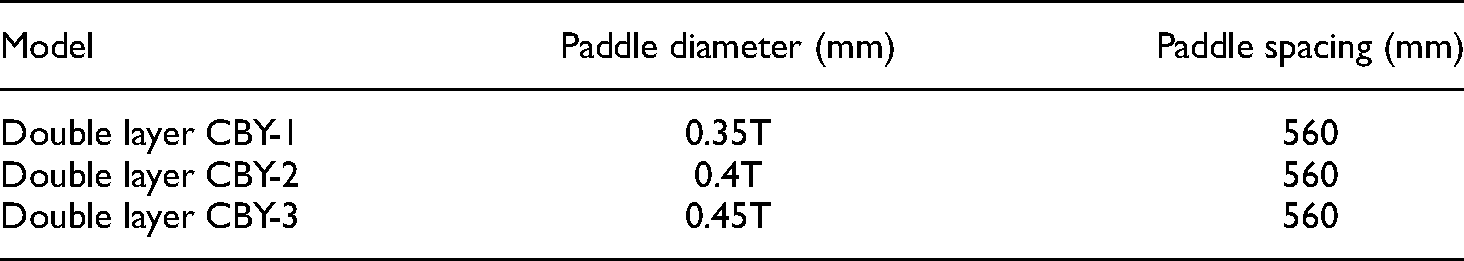
The diameter of the double-layer agitator is 0.35 T and 0.45 T respectively, and the comparative agitator model (0.4 T in diameter). The specific agitator structure parameters are shown in Table 5.
Structure of agitator.
Currently, one of the commonly used numerical simulation criteria for the critical speed
Figure 7 is a graph showing the relationship between the rotational speed N of the three types of paddles in the runoff field and the maximum volume fraction of particles at the bottom of the tank. It can be found that with the increased diameter of the stirring blade, the critical suspension speed of the flow field gradually decreases, indicating that the large diameter of the blade can enhance the suspension of particles.

Relationship between rotational speed and maximum volume fraction of bottom particles.
Velocity field
Figure 8 shows the axial vector diagram of the flow field velocity at speed

The diagram of velocity vector.
Figure 9 shows the velocity cloud diagram of the flow field at speed

Velocity cloud diagram.
Particle volume fraction
Figure 10 is the cloud diagram of axial distribution of particle concentration of agitators with three diameters at a rotating speed of

Axial particle concentration distribution.
Finally, from the point of view of the uniformity of the axial particle concentration distribution, the axial particle concentration distribution uniformity is poor when the blade diameter is 0.45 T. Because the particle concentration at the bottom of the tank is higher, it is quite different from other areas, which will cause dissolution of particles at the bottom of the tank slowly; the uniformity of the axial particle concentration distribution is better when the diameter of the blade is 0.35 T and 0.4 T, although there are still high concentration areas in some areas, this is unavoidable when completely suspended.
Suspension effect and power consumption
Ten radial sections of the flow field (section heights ch 0.1 H to 0.8 H, 0.85 H, and 0.9 H, respectively) were intercepted and the average volume fraction of particles and the standard deviation of particle concentration A of the flow field were calculated for each section (Equation 14 Calculated). Figure 11 is a distribution diagram of the average particle volume fraction of 10 radial cross-sections of the flow field under the blades with different diameters. It can be seen from the figure that in the area with cross section height of 0.2 H~0.7 H, the concentration distribution curve of particles when the diameter is 0.4 T and 0.45 T is closer to the straight line of average concentration of the whole tank than the diameter is 0.35 T; in the area of section height from 0.8 H to 0.9 H, the concentration of particles with a diameter of 0.45 T is higher, indicating that the suspension height of the particles is higher at this time, which reduces the clear liquid area of the flow field; in the area where the cross-sectional height is 0.1 H~0.2 H, the particle concentration distribution is closer to the average concentration of the whole kettle at a diameter of 0.35 T, so the particle suspension effect in this area is better.

Distribution diagram of average particle volume fraction in radial section.
Table 6 shows the suspension characteristics and stirring power of the flow field under different diameters. As shown in the table, when the three kinds of flow fields are respectively at the speed of
Suspension characteristics and stirring power.

Influence of blade layer spacing on suspension characteristics
Determination of model and critical speed of full suspension
The optimal diameter (0.35 T) is analyzed, and analyze the influence of the blade spacing on the solid-liquid suspension characteristics under this diameter. The fluid calculation domain remains unchanged, only the paddle spacing of the agitator is changed. The specific values are shown in Table 7. Firstly, the maximum particle volume fraction at the bottom of the tank is used as the basis for judging complete suspension, the critical suspension speeds of different paddle spacing were calculated respectively, and compare the particle concentration distribution and stirring power of each flow field at speed
Agitator structure.

Figure 12 is a graph showing the relationship between the rotational speed

Relationship between the rotation speed and the maximum particle concentration at the bottom of the tank.
Velocity field
It can be seen from Figure 13 that the velocity vector diagrams of the flow field for the three paddle spacing of the agitator at the speed

Velocity vector image.
The velocity cloud diagram of the flow field with three paddle spacing at this time is shown Figure 14. It can be found from the figure that when the paddle spacing is 490 mm, the flow range above the flow field is the smallest, the connection flow effect between the upper and lower paddles is the most obvious, and the velocity distribution is more uniform. With the increase of the paddle spacing to 630 mm, the flow range above the flow field is the largest Therefore, increasing the paddle spacing will make the flow range above the flow field larger, which is conducive to the suspension of particles higher and the particle distribution more uniformly. Thus increasing the particle dissolution speed, the connecting flow speed between the upper and lower blades has a gradient decrease, and the speed is lower when it is closer to the lower blade.

Velocity cloud image.
Particle volume fraction
Cloud diagrams of the axial distribution of the particle volume fraction of the agitator with three paddle spacing at the rotating speed with

Axial particle concentration distribution.
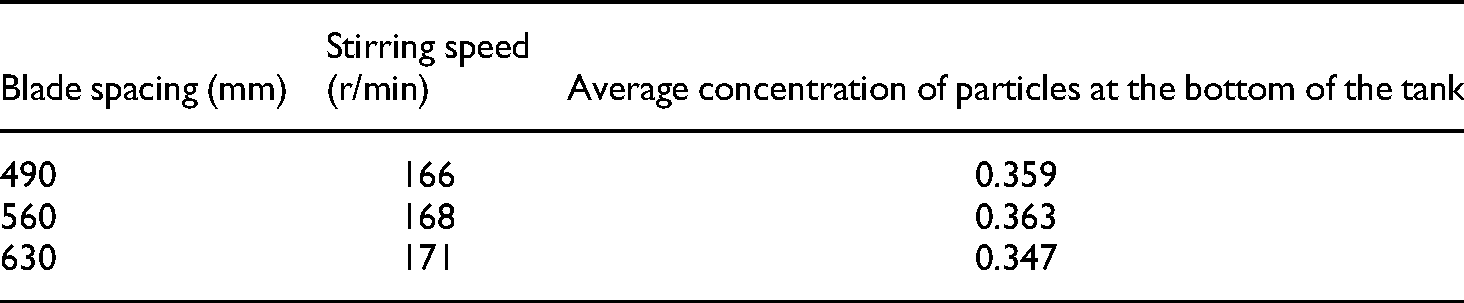
The elliptical cross section of the flow field with the bottom of the stirring tank offset 1 mm inward is intercepted, and analyze the distribution of the particle volume fraction at the bottom at this time. As shown in Table 8, the average concentration of particles at the bottom of the tank with a paddle spacing of 630 mm is the smallest, indicating that the suspension of particles at the bottom of the tank is good and are conducive to the dissolution of particles.
Average concentration of particles in the bottom section of the tank.
Suspension effect and power consumption
Figure 16 is a distribution diagram of the average particle volume fraction of 10 radial cross-sections of the flow field under different paddle spacing. It can be seen from the figure that the concentration of particles with paddle spacing of 560 mm and 630 mm is higher in the area of section height from 0.4 H to 0.5 H, which is caused by the effect of connecting flow between the upper and lower blades decreases after the paddle spacing increases. The accumulation of particles appeared in the area. In addition, the concentration of particles with a paddle spacing of 630 mm is greater in the area of cross-sectional height from 0.8 H to 0.9 H, and it can be seen that increasing the paddle spacing can make the particle suspension height higher and reducing the clear liquid area of the flow field.

Average volume fraction distribution of particles in radial section.
Table 9 shows the suspension characteristics of the flow field and the stirring power under different paddle spacing. It can be seen from the table that three flow fields are increased, the stirring power required by the flow field at this time gradually increases with the increase of the paddle spacing under the condition of the speed of
Suspension characteristics and stirring power.

Comparison before and after optimization
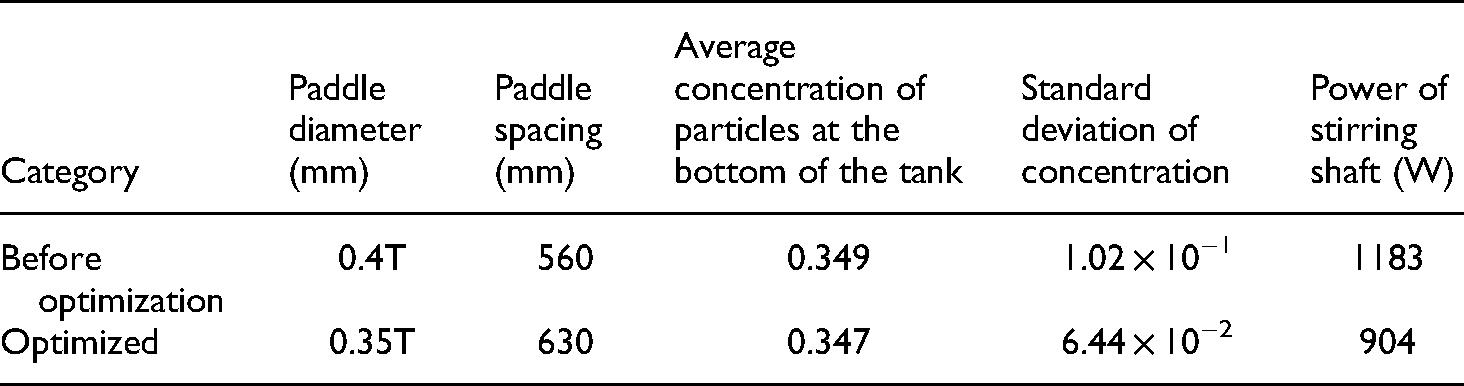
The particle distribution uniformity and stirring power of the flow field before and after the optimization of the agitator were compared, as shown in Table 10, the average concentration of particles at the bottom of the tank of the optimized agitator (paddle diameter 0.35 T, paddle spacing 630 mm) is almost the same as before optimization, but the uniformity of the particle concentration distribution in the flow field is greatly improved, and the stirring power has been saved by 23.5%, which has a great improvement effect.
Comparison before and after optimization.
Conclusions
The computational fluid dynamics method is used to study the influence of the height of the agitator from the bottom on the suspension characteristics of the urea particles in the stirring device by modeling the stirring device. The results show that reducing the height from the bottom will promote the suspension of particles at the bottom of the tank, but a too low height from the bottom will easily produce a stirring dead zone at the bottom of the tank, which will cause the accumulation of particles.
Decreasing the height of the agitator from the bottom will increase the clear liquid area of the flow field, resulting in poor particle distribution in the flow field and increased torque of the stirring shaft. The particle concentration distribution in the flow field is most uniform when the height from the bottom is 280 mm.
In order to further improve the stirring performance of the stirring device, the structure optimization of agitator, the key component of the stirring device, was conducted. The single factor method is used to analyze the influence of the diameter and paddle spacing of the agitator on the solid-liquid suspension characteristics of the flow field. The results show that increasing the diameter of the agitator will reduce particle concentration in the flow field, but the stirring power required by the flow field will increase; increasing the blade spacing within a certain range can increase the suspension height of particles and make the particle distribution in the flow field more uniform.
The optimal diameter and blade spacing of the double-layer CBY agitator are 0.35 T and 630 mm respectively when the solid-liquid flow field just reaches the fully suspended state, and the uniformity of particle concentration distribution in the flow field is greatly improved and the stirring power is saved by 23.5% compared with that before optimization, which provides a reference for the subsequent optimization of the integrated equipment.
Footnotes
Funding
This work is financially supported by National Natural Science Foundation of China (52005118), Science and Technology Plan Project of Guizhou Province (Grant No. QKHJC[2020]1Y234) and High-level Talents Research Initiation Fund of Guizhou Institute of Technology (2019066).
Declaration of conflicting interests
The author(s) declared no potential conflicts of interest with respect to the research, authorship, and/or publication of this article.