
Abstract
Identification of the vulnerabilities in the structural stiffness is one of the most crucial issues in improving this property of machine tools. In this paper, the Flexibility Matrix Diagonal element method, based on hammer testing, is proposed as an effective approach to identifying the stiffness weakness of cantilever structures. To verify the proposed method, the element stiffness weakening is used to simulate the weak parts regarding stiffness. Several scenarios, with single and multiple weakness points, including various noise levels, are studied, using finite element simulations. Next, a novel method, to measure the accuracy of the algorithm and quantify the weakness level, under noise conditions, is proposed. The advantage of this method, compared to the ones based on Flexibility Difference Method, is the higher identification accuracy under noise interference. Finally, the cantilever beam with elastic support is experimentally studied. The natural frequencies and modal shapes are obtained, according to the singular value decomposition method, to establish the flexibility matrix. In addition, using only the lowest three modes, a series of numerical examples and experiments are provided, to illustrate the validity and the considerable practical engineering value of the method.
Keywords
Introduction
In machine tools, the excellent machining performance is closely related to the dynamic performance.1,2 During machining, the deformation will not only affect the accuracy of the machine tool and the surface quality of the workpiece, but also reduce the productivity and the tool life, as well as remaining useful life of the machine tool.3,4 However, machine tool stiffness is one of the key indexes of machining stability and efficiency, while improved stiffness can effectively enhance the machining accuracy of parts. To enhance overall machine tool stiffness, the stiffness of each part of the tool needs to be known, so that the best effect can be achieved, by increasing the stiffness of the weakest parts. 5 Therefore, in this paper, the flexibility method is used to identify the weak parts of a cantilever structure.
In engineering applications, the weak parts of machine tool, referring to stiffness, should be identified quickly, simply, and accurately. The stiffness of the cantilever part of a machine tool is obviously the weak part, including elements such as, the tool holder system of the lathe. These cantilever parts are installed in the corresponding section of the machine tool, such as the bed, to form a cantilevered structure, while the fixed way does not always satisfy the fixed boundary condition. However, these cantilevered structures have a cantilever-end part, so this study considers the machine tool cantilever structure as a cantilever beam with elastic support and a bar structure, so as to explore the feasibility of the identification method.
The damage identification technology is similar to the research on the weak stiffness point identification of structure equipped with machine tool. The damage identification method is widely applied in beam bridges cases, given that damage usually occurs at a limited number of positions, during the stage of structural failure. Hence, we can refer to the identification algorithm of bridge stiffness to identify the weak parts of a cantilever structure, regarding stiffness. One of the most widely used methods for damage identification is the structural modal flexibility matrix method.6–11 Based on governing equations of structural dynamics, Lin 12 observed that higher frequency modes are conducive, regarding the stiffness matrix values, to a greater extent. Therefore, in order to obtain a good estimation of the effective matrix, it is necessary to measure all modes of the structure, especially the high frequency modes. Due to the obvious limitations of experimental instruments, it is even more difficult to acquire high frequency response data. This seriously restricts the success of the technique based on stiffness matrix estimation. In order to overcome several difficulties, Pandey and Biswas 13 developed a method to locate the damage of a beam structure, by changing the respective flexibility matrix. The advantage of using flexibility, rather than stiffness, is that only a few low frequency modes are required in order to accurately identify the flexibility matrix of the structure.12,13 They proved the validity of their approach, by numerical examples of different types of beams.
Ni et al. 14 used damage index, based on modal strain energy, to identify single damage state and experimentally tested it on a simply supported I-beam, in the laboratory. The flexibility of a structure is significantly affected by the low-order modal parameters and these are more conveniently obtained in practical engineering. At the same time, compared to the natural frequency and modal shape, flexibility is more sensitive to the structure damage. 15 Therefore, the damage identification method, based on flexibility change, shows high application value. Ni et al. 14 and Talebinejad et al. 15 studied the Relative Flexibility Change (RFC) of cable-stayed bridge, before and after damage. Under the condition of no-noise influence, the RFC index shows good localization performance, in the case of single and multiple damage. However, under the influence of simulated environmental noise, it is difficult to identify minor damage. Wickramasinghe et al. 16 proposed a method based on modal flexibility, which can detect and locate single and multiple damage of suspension bridge sling, at different positions and degrees of damages, while it is successfully verified by respective simulation cases. Catbas et al.17,18 used the flexibility matrix to accurately sense the variation in low-frequency mode of bridge structure, detecting and locating bridge deck damage of simply supported beams. However, this paper does not consider the degree of damage that can be detected. Li et al. 8 proposed a damage identification method, based on a generalized flexibility matrix. The frequency and modal shapes of damaged and undamaged structures were used to detect the stiffness changes of simply supported beams. Although only the first natural frequency and the corresponding modal shape can be used to determine the damage location and damage degree, in the actual test, the uncertainty factors will affect the accuracy of the natural mode, so it has not been verified in the actual application. Katebi et al. 19 developed an improved modal flexibility method to identify and quantify the modal flexibility of damage. But in the actual test, the input noise and output noise inevitably exist in the test system, and the noise will affect the identification effect of the detection method. Guo et al. 20 presented a novel approach using the reconstructed data and measured data to identify the low stiffness of the bar-shaped combined structure. Based on the above studies, the advantages and disadvantages of the above research methods are summarized, and the recognition accuracy method compared with the previous methods is proposed. The flexibility method is used to identify the weak part of the structural stiffness in a cantilever structure, as presented in this paper.
Theory
Weakness analysis
Machine tools are made up of structural parts with an infinite number of degrees of freedom. In dynamic analysis, the machine tool can be divided into several substructures of concentrated mass, based on the specific structure of the machine tool. The substructures are considered connected by an equivalent spring and a damper, composing a dynamic model.
21
In this paper, the machine tool is considered as a cantilever structure. Regions a, b, and e represent regions, excluding the joints, in substructures 1, 2, and n, respectively, while region

Simplified diagram of discrete structure of machine tool.
Identification method proposed
The existence of weak part in a structure will reduce the structural stiffness. Since flexibility is the reciprocal of stiffness, the decrease of stiffness will lead to the increase of structural flexibility. Considering mode shapes normalized to unit mass, as FTMF = I, the flexibility matrix, F, can be obtained from the modal data as 13 :

Where, k is the number of degrees of freedom, M is the mass matrix, Ø is the mode shape matrix, Ω represents the diagonal matrix composed by the square of natural frequency, and

After obtaining the flexibility matrices Fd and Fu for the intact and the weakened structure, respectively, the difference between the two matrices can be used to establish the change of structural flexibility:

Where, Fd and Fu are the flexibility matrices for the intact and the weakened cases, respectively, while ΔF is the difference among the two aforementioned flexibility matrices. s is the number of measured modes in modal survey;
For each measurement point j, Dj is the value of all diagonal terms extracted from ΔF, that is

Where, D(j) is the jth diagonal element in
To indicate the damage location more clearly, the diagonal terms of D(j) are referred to as the new index of damage detection, called Modal Flexibility Matrix Diagonal Index (MFMDI).
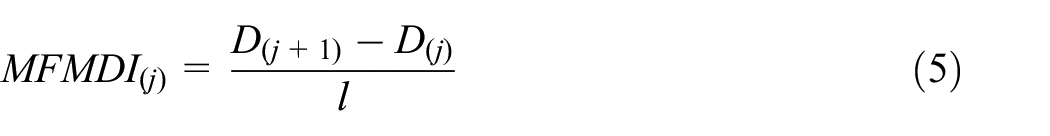
Where, MFMD(j) is considered as the index of each measurement point j, regarding weakness identification, while its value reflects the variation degree of change after structural weakness, and l is the distance between the measuring points.
When a local weak part appears in a structure, the matrix of change in flexibility will increase. If the values of MFMDI, at two adjacent measurement points, are much higher than others, the position between these two measuring points is a weak part.
Comparison of identification accuracy
Due to the existence of noise, even in the non-weak parts, there are also identification values. In order to measure the identification effect, this study uses the square of the weak position data and the square sum of each measuring point data, in order to measure the accuracy of the algorithm:

Where,
When there are two weak parts in the cantilever structure, the ratio of the two respective peaks is used to measure the accuracy of the identification algorithm in quantifying the level of weakness. The weak part in the local stiffness of a structure will reduce its overall stiffness and thus, lead to the increase of structural flexibility, since flexibility is the reciprocal of stiffness. Therefore, assuming that the stiffness, at a certain position in the cantilever structure, weakens by α, the relative flexibility at a certain position change by 1/α. Therefore, in theory, the quantification formula for the relative size of weakness is:

Where,
Numerical study
The influence of the existence of weak parts on the flexibility matrix is studied, using the FE model of the cantilever structure in a numerical approach. The purpose of the FE model is to verify the effectiveness of the identification algorithm. Then, the identification effect of MFMDI is verified by the shift of weak location and the uniform variation of weakness degrees. In actual cases of test systems, there is inevitable input and output noise, which affects the calculation accuracy of frequency and mode shape. Consequently, the measured vibration data are intentionally contaminated with noise, to investigate the behavior of the proposed MFMDI in noisy conditions, so as to ensure that the weak parts of structural stiffness can be accurately identified, based on the measurements.
Model of cantilever beam with elastic support
Test object description
A cantilever beam of uniform cross-section with elastic support (Figure 2) is used to verify the weak identification method, as previously described. The length of the beam structure is L = 1.2 m, uniformly divided into 20 Euler–Bernoulli beam elements with two nodes each, with three Degrees-of-Freedom (DOFs). Regarding notations, the kth node is associated with translational displacements uk, vk along the y- and x-direction, respectively, as well as with in-plane rotation θk. Furthermore, regarding the kth element, consisting of nodes k and k + 1, the element stiffness and mass matrices are shown in equations (8) and (9). The modulus of elasticity and mass density of all elements are E = 210 GPa and ρ = 7850 kg/

The FE model of beam.
The element stiffness and mass matrices acting in the Euler–Bernoulli beam theory are as follows. Then, according to the assembly principle of the stiffness matrix and mass matrix of the beam structure, the whole FE matrix is assembled. Because the left constraint of the beam model is the spring constraint, the supporting spring and the torsion spring are considered to be connected with the first node of the first element of the beam structure, the stiffness of the supporting spring is added to the first diagonal element of the element stiffness matrix, and the stiffness of the torsion spring is added to the third diagonal element of the element stiffness matrix.


Where, E, I, l, A,
Scenarios of weakness case
In this approach, the weak part is modeled by a flexural stiffness (EI) reduction in an element, represented as Flexural Stiffness Reduction Ratio (FSRR) value, defined as the ratio value of the reduced to the original EI. According to the numerical beam model, 21 nodes are selected at equal distances to simulate the actual dynamic test positions. Four cases of single and multiple weakness points (Table 1) are investigated, including both the noise and noise-free scenarios. The identification case without noise is represented by E-element, the identification case with noise is represented by EN-element.
Weakness scenarios for beam model.

The first three modal parameters of the beam structure are enough to simulate its dynamic performance under low frequency vibration. Natural frequencies and mode shapes, for the unweakened and weakened beams, as calculated based on FE analysis, provide an estimate of the MFMDI.
Results of weakness identification
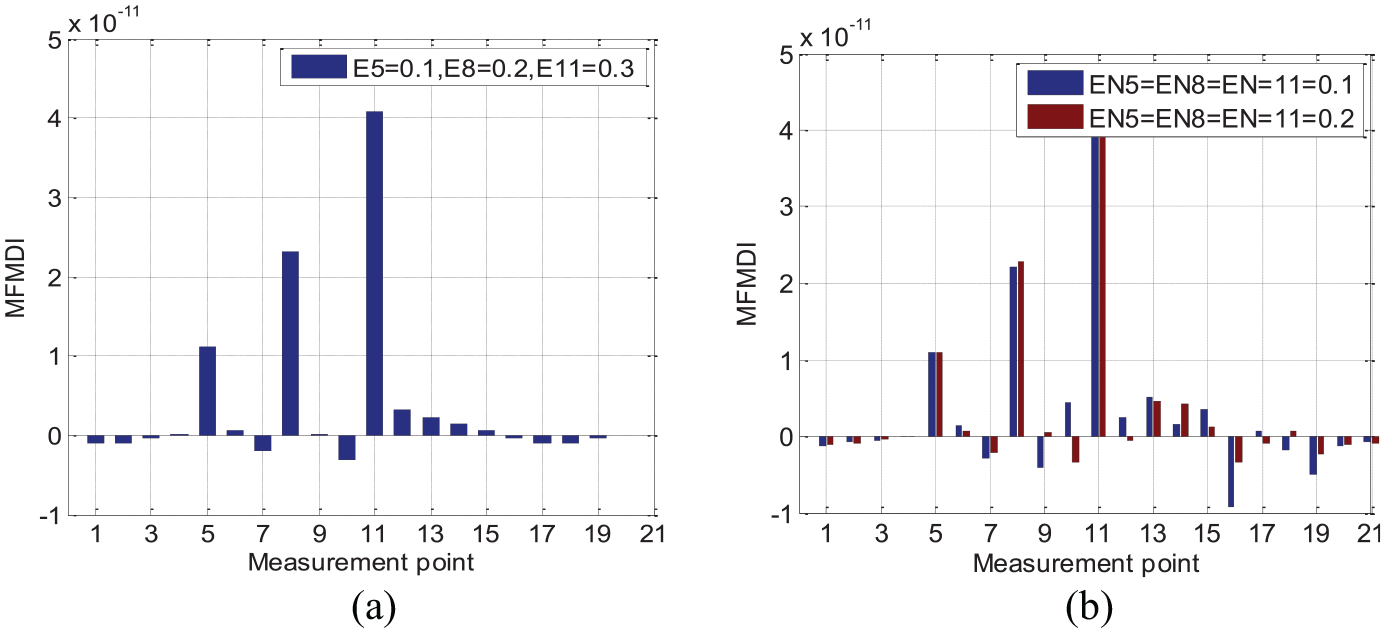
Figures 3(a) to 6(a) show that the MFMDI can accurately identify the weak parts of stiffness, without taking the noise into consideration. At the points of structural stiffness weakness, the graph shows a large mutation peak. As the weakness severity increases, from 10% to 40%, in the beam structure, the identification effect of the MFMDI becomes even more evident. Meantime, this increase also causes a slight change in the MFMDI values of other measurement points, but it does not affect the identification of the weak parts of stiffness.

Weakness points location results in Case 1: (a) identification result of single weak point location without noise and (b) identification result of single weak point location with noise.

Weakness points location results in Case 2: (a) identification result of two interval weak point location at a distance, without noise and (b) identification result of two interval weak points location at a distance with noise.
Weakness points location results in Case 3: (a) identification result of two adjacent weak points location without noise and (b) identification result of two adjacent weak points location with noise.

Weakness points location results in Case 4: (a) identification result of multiple weak points location without noise and (b) identification result of multiple weak points location with noise.
In order to verify that the MFMDI can identify the weak stiffness, even in the presence of noise, the modal properties of the structure were contaminated applying Signal to Noise Ratio (SNR) value of 5, 10, and 15 dB. The results demonstrate that the noise causes some irregular response fluctuation at the rest of the nodes, resulting in a drop in identification accuracy, shown in Figures 3(b) to 6(b). However, the noise interference does not considerably affect the identification result, in this case. The MFMDI can still provide the largest mutation peak in the weak parts of the stiffness.
Bar structure model
Test object description
An uniform cross-sectional bar structure (Figure 7) is used to verify the proposed weak identification method. The length of the bar structure is L = 1.2 m, uniformly divided into 20 elements with 2 nodes, each with a DOF. The modulus of elasticity and mass density of all elements are E = 210 GPa and ρ = 7850 kg/
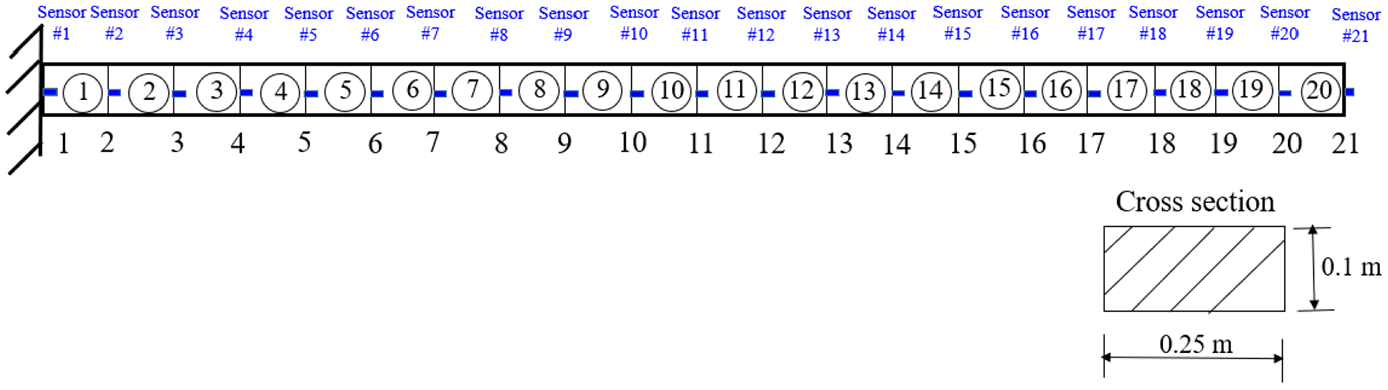
The FE model of bar structure.
The vibration analysis of the bar, with and without weakness, is carried out. The mass matrix and stiffness matrix of the structure are generated by using the FE method. The element matrices are as follows

Where,
Weakness scenarios
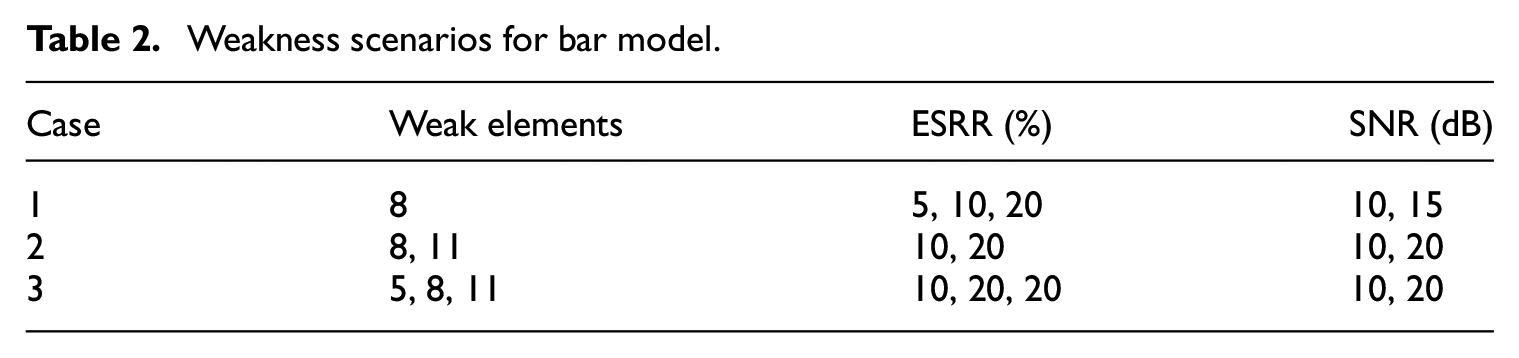
In this approach, the weak part is modeled by EA reduction in an element, represented as Extensional Stiffness Reduction Ratio (ESRR) value, defined as the ratio value of the reduced to the original EA. According to the numerical bar model, 21 nodes are selected, at equal distances, to simulate the actual dynamic test positions. The three single and multiple weak points scenarios are listed in Table 2, including both the noise-free and noise scenarios.
Weakness scenarios for bar model.
The first three modal parameters of the bar structure are enough to simulate its dynamic performance, under low frequency vibration. The dynamic characteristics (frequencies and mode shapes) before and after each scenario of induced weakness are calculated numerically.
Results of weakness identification
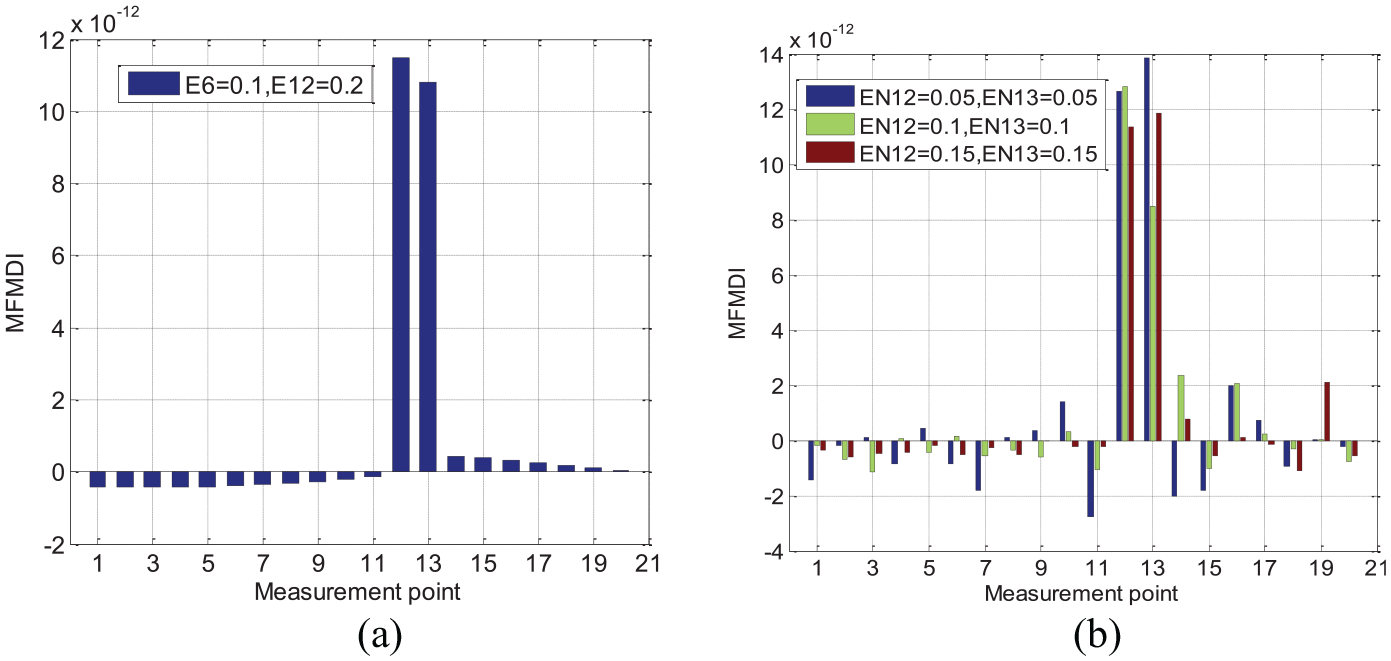
The results in Figures 8 to 10, show that the MFMDI can accurately identify the weak parts of stiffness, in a bar structure. The weak part of the structure corresponds to the peak position in the graph. As weakness severity increases from 10% to 40% in the bar structure, the identification results of the MFMDI produce higher peak at the weak parts. Although noise interference slightly affects the recognition accuracy, the MFMDI is not affected, regarding the identification results of the weak parts of stiffness.

Weakness points location results of Case 1: (a) identification result of single weak point location without noise and (b) identification result of single weak point location with noise.

Weakness points location results of Case 2: (a) identification result of two weak points location without noise and (b) identification result of two weak points location with noise.
Weakness points location results of Case 3: (a) identification result of multiple weak points location without noise and (b) identification result of multiple weak points location with noise.
Influence of different modal orders
Different weakness scenarios are used to explore the influence of different modal orders on the identification results. As shown in Figure 11, the higher-order mode of substructure demonstrates higher identification accuracy than the low-order mode. Considering the research objective of this paper is to identify the weak parts of cantilever structure, using the first three modal parameters proves enough to achieve this accurately, without the need for high-order calculations. In the following experimental verification, the first three modal parameters are directly used to identify the stiffness weak parts.

Identification results of different modal orders: (a) identification result of single weak point location and (b) identification result of multiple weak points location.
Based on the above analysis, the results from the numerical study show that the MFMDI method could identify the weak locations with reasonable accuracy. The method works perfectly in different weakness scenarios, in noise free environment and it shows acceptable accuracy in noisy conditions.
Comparison to the flexibility difference method
The Flexibility Difference Method (FDM) is a method already used to identify weak parts in structures.13,22 Based on equations (1)–(3), for each measurement point j, let uj be the maximum absolute value of the elements in the corresponding column of

Where,
For reasons of clarity in the indication of the damage location, the identification index of FDM is:

Where, the FDM(j) is considered as the index of measurement point j for weakness identification, whose value reflects the degree of change after induced structural weakness, and l is the distance between the measuring points.
In the weakness identification process, the FDM is considered for identifying the weak parts in a cantilever beam with elastic support, in comparison to MFMDI. The properties parameters of cantilever beam with elastic support are shown in Chapter 3.1.1. The weakness scenarios are listed in Table 3. Case 1 denotes the single weak location problem, and case 2 denotes the multiple weak location problem.
Comparison of scenarios of weakness.
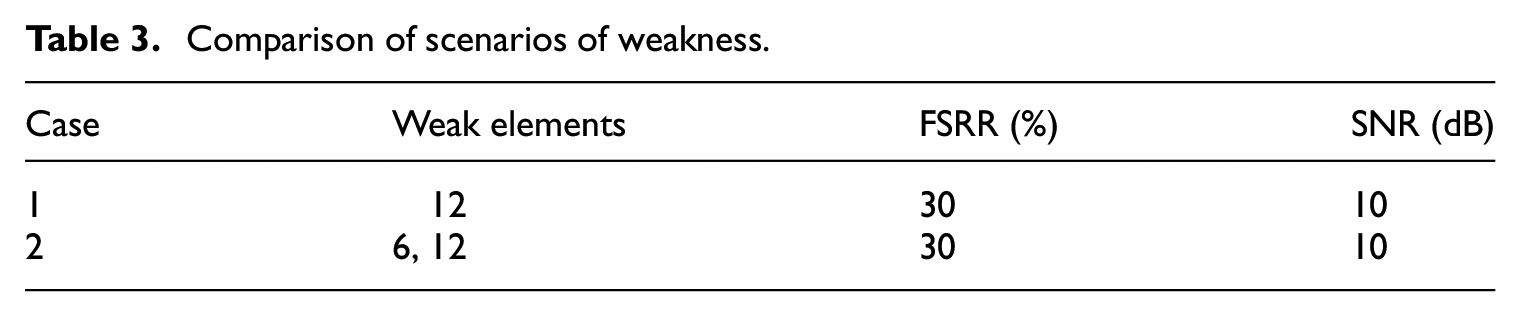
Noise with SNR of 10 dB has been added to the simulated data of the two identification methods, in a capability comparison among MFMDI and FDM. Figures 12 and 13 show a comparison of results obtained from the two methods. Although FDM can well identify the weak parts, the MFMDI produces more distinct peaks than the ones from FDM without noise.

Comparison results of Case 1: (a) identification result of single weak point location without noise and (b) identification result of single weak point location with noise.
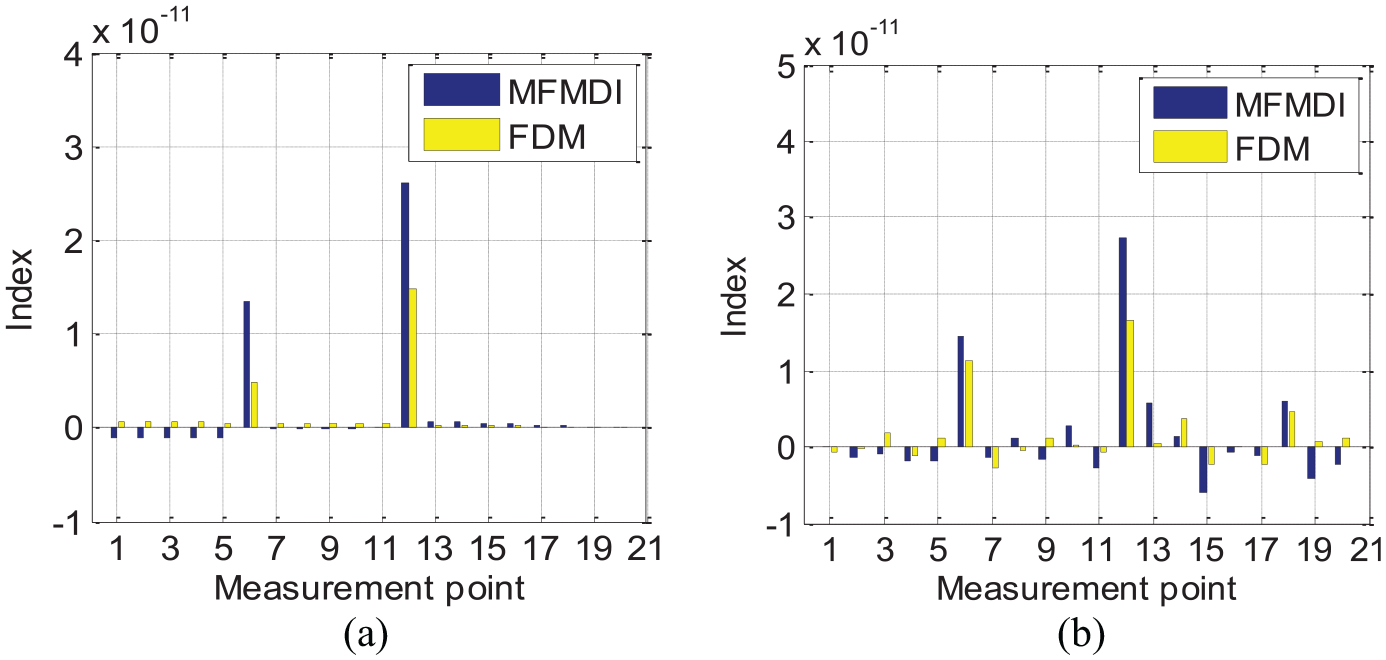
Comparison results of Case 2: (a) identification result of multiple weak points location without noise and (b) identification result of multiple weak points location with noise.
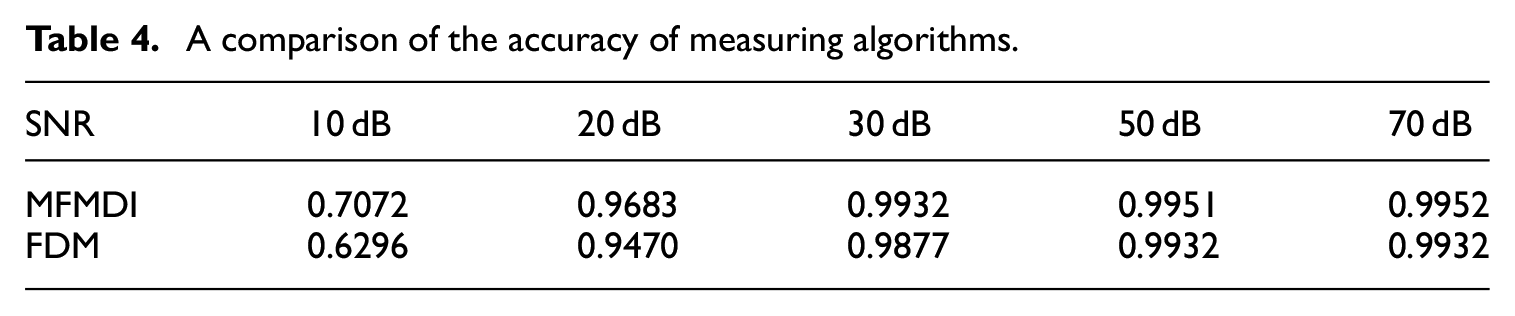
However, due to the noise interference, even in the non-weak parts, there are also identification values. In order to measure the identification effect of the two methods, in the case of the single weak position in the cantilever structure, the square of the weak position data and the square sum of each measurement data are used to evaluate the accuracy of the algorithm. The research results are listed in Table 4. Under the influence of different signal-to-noise ratio value, the anti-noise ability of the MFMDI method is slightly higher than that of the FDM method. Hence, the results show that the MFMDI method is more accurate than the FDM method in identifying the weak part of stiffness.
A comparison of the accuracy of measuring algorithms.
By setting weakness at 10% SRR, 20% SRR, and 20% SRR and 30% SRR data at the 6th and 12th elements of the cantilever structure. The research results are listed in Tables 5 and 6. As signal-to-noise ratio value increases, the relative size of quantifying weakness is gradually approaching the theoretical value, which verifies the feasibility of the quantitative formula. However, when using the FDM method, the relative magnitude of the quantified weakness is not stable, nor close to the theoretical value. Therefore, it is proved that MFMDI method is better in identifying two weak points position in a cantilever structure.
Comparison of quantifying relative sizes of 10% and 20% weakness at 6th and 12th location respectively.

Comparison of quantifying relative sizes of 20% and 30% weakness at 6th and 12th location respectively.

The comparison of the above results proves that the proposed MFMD is more accurate and has higher identification ability than FDM method.
Experimental verification
Experimental setup
To demonstrate the validity of the MFMDI, the cantilever beam structure with elastic support is taken as the test structure (Figure 14). The beam is connected to the exciter by bolt and spring pad on its left side, which plays the role of elastic support. The x-direction represents the length of the beam at a value of 0.96 m. Starting from the elastic support end, the equal distance is divided into eight segments of 0.12 m long each, while nine measurement points at each segment boundary are selected for sensor placement. An impulse hammer (SN38360) and accelerometers (B&K4514B-001) are used to excite the cantilever-end of the structure and measure the vibrations along the z-direction. All accelerometers are connected to an acquisition system (LMS-SCM05), which is used to collect the measurement data.

The experimental platform of the beam structure.
Due to the high accuracy of low-frequency signals, the sensitivity of the accelerometer needs recalibration with a sensor calibrator, prior to the experiment. In order to avoid torsional mode of the cantilever structure, the sensors are placed as far as possible, on the centerline of each beam segment. The natural frequency range of cantilever structure is calculated using a theoretical formula, to adjust the sampling bandwidth of the acquisition instrument. The parameters of the spectrum analysis are selected as listed in Table 7. The experiment uses a modal testing method, to obtain the frequency spectrum of each measurement point.
Spectral analysis parameters.

Figure 15 shows the cantilever beam with elastic support, as well as a typical EA weakness in the third and fifth sections, simulated by cutting a small piece of material with thickness of 0.015 m and length of 0.12 m, within the weak elements. Following, the dynamic test of the beam, with induced weak parts, is carried out.

The weak parts of stiffness produced by beam structure.
The pulse force hammer is used to hammer the cantilever end of the original and weakened beam structure, while the measured vibration data of each measurement point are measured by taking the average value of several hammerings. Next, Eigensystem Realization Algorithm (ERA) is used, 23 which is a method for global modal parameters identification, in input-output time domain, to solve the system identification problem of dynamical models, mathematically describing multibody mechanical systems. The key idea is to decompose the data matrix of the measured free impulse response, based on the Singular Value Decomposition (SVD) technique. The dynamic analysis is carried out in MATLAB, to extract the peak points of the first three natural frequencies of the structure, as shown in Figure 16, thus obtaining the modal shape data of the structure.
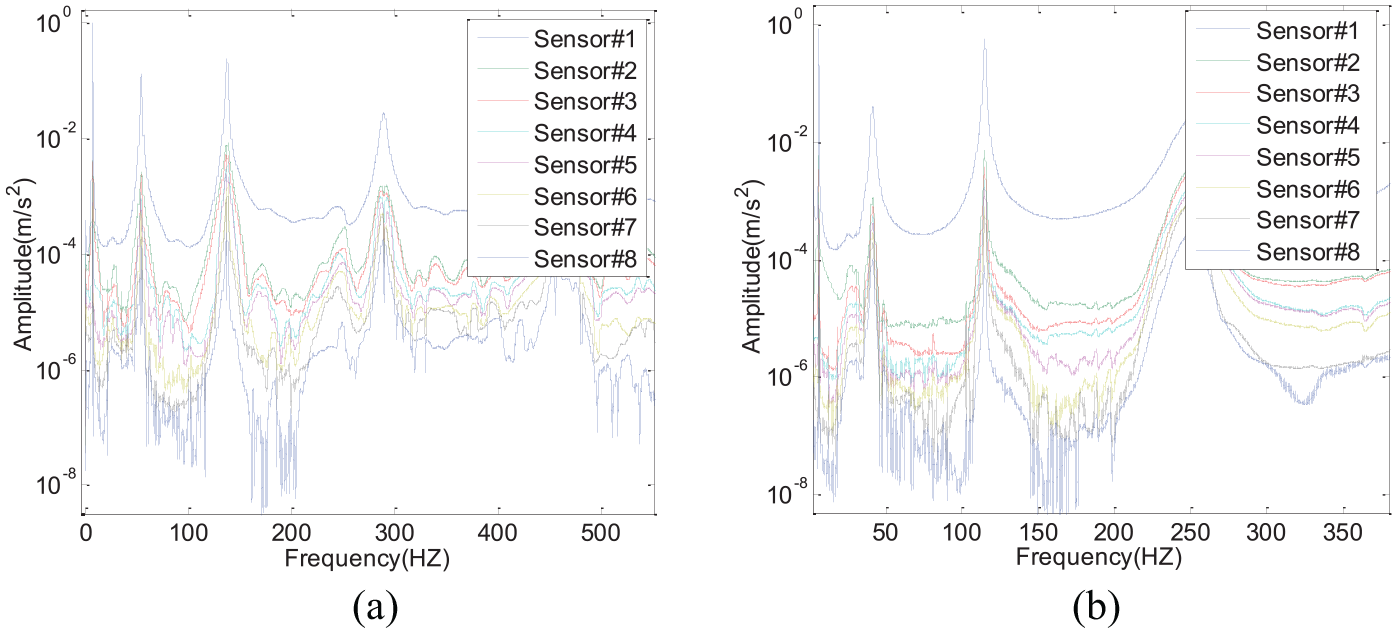
Frequency response curve of weakened and original beam structures: (a) frequency response of original beam structure and (b) frequency response of weakened beam structure.
Experimental results analysis
The frequency response curves of the original and the weakened beam structure are calculated. The flexibility matrix is calculated by using the natural frequencies and modal shapes of the original and the weakened structure, while then the flexibility matrix is used to establish the MFMDI to identify the weak parts, producing the results as shown in Figure 17. The weak parts in the third and fifth segments of the beam structure are accurately identified, by using the MFMDI. Although the accuracy of the third segment identification is not high, since the adjacent positions also produce false peaks, it does not affect the maximal mutation peak at the weak parts. Therefore, the feasibility of the weak index is experimentally verified.

The identification result of beam structure.
Conclusion and discussion
The MFMDI has been used to identify weak parts in cantilever structures, under different weakness scenarios, regarding either a beam or a bar structure. The performance of the method is compared to that of the FDM method, in order to evaluate the identification accuracy. Various noises are added to the measured data to study the behavior of the MFMDI in noisy conditions. Different weakness scenarios are used to explore the influence of different modal orders on the identification results
According to the numerical results obtained in this study, it is concluded that, the MFMDI can identify weak parts in single and multiple points locations, whose weakness degree reaches 90% and higher, under 5 dB noise level. By exploring the effect of different modal orders on the identification results, it is verified that the low-order modes of substructure can accurately identify the weak parts of structural stiffness.
Due to the existence of noise, even in the non-weak parts, there are also identification values. To measure identification effect, the paper uses the square of the weak position data and the square sum of each measurement point data to estimate the accuracy of the algorithm. In the case of two weak parts in the cantilever structure, the ratio value of the two peaks, in the identified weak parts, is used to measure the accuracy of the identification algorithm in quantifying the degree of weakness. The comparison of the above results proves that the proposed MFMD method shows better identification effect and higher accuracy than FDM method.
In the experiment, the vibration data of the original and the weakened structure are obtained during hammering, while the SVD is used to extract the natural frequencies and modes. This dynamic testing method can solve the complexity of FE modeling, as well as the deviations between the FE model and the actual machine tool structure, resulting in inaccurate results. Meanwhile, the proposed method shows certain practical engineering value and provides guidance in the optimization of machine tool stiffness.
Footnotes
Declaration of conflicting interests
The author(s) declared no potential conflicts of interest with respect to the research, authorship, and/or publication of this article.
Funding
The author(s) disclosed receipt of the following financial support for the research, authorship, and/or publication of this article: This project was financially supported by National Natural Science Foundation of China (Grant No. 51875009) and Natural Science Foundation of Beijing Municipality (Grant No. 3162005).