
Abstract
To find the weak link of the structural stiffness is important to improve machine tool stiffness. However, how to overcome the static deformation with difficulty acquisition is a difficult problem in machine tool structure. The article takes the cantilever beam structure as a numerical example, the weak link is modeled as EA reduction in stiffness. Thorough finite element simulations are performed to assess the robustness and limitations of the method in several scenarios with single and multiple weaknesses. The sensors are used to acquire the acceleration data, the structural modal parameters are obtained by the singular value decomposition technique, and the dynamic characteristics are systematically reconstructed by using the modal state-space method to obtain static stiffness. Then, an identification method proposed by measured data and reconstructed data to identify the weak link of stiffness of the cantilever structure. Furthermore, the comparison of numerical and experimental results validate the correctness and effectiveness of this method. The research has certain practical engineering value and provides an accurate guidance for the optimization of machine tool stiffness.
Introduction
The excellent machining performance of the machine tool is closely related to its dynamic performance. The deformation during machining will not only affect the accuracy of the machine tool and the surface quality of the workpiece, but also reduce the production efficiency and cutter lifespan, and it even reduces the useful life of the machine tool. The stiffness is an important parameter that affects the accuracy of CNC machine tools. Improving the stiffness of machine tools can effectively enhance the machining accuracy of parts. Static stiffness of machine tool is one of the key indexes of machining stability and efficiency. In order to increase the stiffness of the machine tool, it is necessary to understand the stiffness of each link of the machine tool, including the stiffness of structural parts and the stiffness of contact surface of structural parts. In order to increase the stiffness in the weakest part can achieve the best effect.1,2
The existing identification methods for the weak links of the machine tool structure are mainly divided into static stiffness method and dynamic stiffness method. There are two main methods based on static stiffness. The first method is the static stiffness test method, which is mainly to press the load on the key parts of the machine tool to measure the deformation of each structure of the machine tool. The weak link of the stiffness of machine tool can be calculated by the conversion center.3,4 In the static stiffness test, the static load is applied to the key parts of the machine tool, and the displacement is recorded by the dial indicator or eddy current sensor. The method of measuring the displacement need to select the test reference point and the clamping device to be fixed the test device. It is difficult for the clamping device to find a suitable position for installation, and the selected reference point is also prone to deformation, which affects the test accuracy. The second method is to calculate the position of the weak link of the stiffness through the static analysis of the finite element (FE).5,6 The modeling accuracy of the FE model in the joint of structural parts cannot be guaranteed, and the joint stiffness accounts for a large proportion in the machine tool. Hence, the results of the FE analysis will have a large error. In general, the static stiffness method is not simple and the accuracy is not high for static conditions.
The second is the dynamic stiffness test method, which is a combination of FE and experimental modal analysis. The dynamic test method needs to build an accurate FE model. Firstly, the preliminary FE analysis of the established machine tool model is carried out. Secondly, the actual machine tool is tested, and the parameters of the FE model are modified according to the experimental results. The FE analysis is performed again on the modified model, and the analysis results are compared with the experimental results again. This is repeated until the FE analysis results are consistent with the experimental results. The final FE model is used for analysis to obtain the weak parts of the machine tool structure.7,8 The machine tool is a composite structure, and the joint parameters between the modified structures are the main research objects. Then, the modified approach for the consistency between the results of FE analysis and experimental test may not be unique. Hence, the modified approach has complexity and blindness, resulting in complex algorithm and low accuracy of the analysis results.
In the engineering application, there are many cantilever structures in the machine tool structure such as the series structure of the crossbeam, the slide, the ram, and the guide rail combined in gantry machine tool, as shown in Figure 1. The cantilever combined structure can be regarded as fixed-end structure at one-end and free-end structure at the other-end. The cantilever structure may be the location of the weak link of the stiffness. In order to improve the stiffness of the machine tool, it is necessary to know the stiffness of each part and the contact surface. Therefore, the aim of the paper proposes a fast, simple, and accurate method to identify the weakest link of stiffness in practical application. The cantilever beam structure, which can be equivalent to the cantilever structure of machine tool, is taken as the research object. Hence, the identification method of the weak link of cantilever beam structure is studied to explore the identification of the weak link of the stiffness of the machine tool cantilever structure. There are a lot of researches on the mechanical properties of the cantilever structure in terms of material selection,9–15 but the research of this paper only wants to obtain the vibration data of each measuring point of beam structure by dynamic hammering test method. Using the measured data and reconstruction data to establish the identification index can identify the weak link of structural stiffness.

The machine tool cantilever structure.
The damage identification technology is similar to the research on the weak identification of machine tool combined structure. The application of the damage identification technique in beam bridges has attracted the most attention, given that damage usually occurs at limited positions in the use stage of structural failure. Hence, we can refer to the identification algorithm of bridge stiffness to identify the weak link of the stiffness of the machine tool cantilever structure. One of the most widely used methods for damage identification is structural modal testing and analysis,16–19 and according to the identification analysis, the changes of natural frequency and modal shape in the modal parameters are obtained to measure the size and location of the stiffness changes.
Fourth-order derivatives of the mode shapes were employed to detect and locate the damage in simply supported and cantilever steel-plate model structures but with the drawback of a heightened sensitivity to measurement noise. 20 In the absolute difference mode shape curvature (ADMSC) method, this method is based on the difference between the intact curvature mode shape and the damaged curvature mode shape to detect and locate the damaged location of the beam structure. The limitation of this method is that depends on undamaged modal response of the structure.21,22 Sha et al. 23 proposed a local damage detection and monitoring technology based on the relative natural frequency changes only. However, a possible limitation of the method is that it always yields possible damage locations symmetrically. Such limitation is common in natural frequency-based methods. Alshalal et al. 24 used the residual error defined based on the equations of motion to identify the damage of the FE model structure of one-dimensional bar and two-dimensional beam structures. The intrinsic parameters of the FE model can be known, once the identified objects become an actual model, the intrinsic parameters can be unknown in the model. Nguyen et al. 25 proposed a new damage identification method based on the ratio of the geometric modal strain energy to the eigenvalue, and the effectiveness and practicability of this method were verified by a numerical truss bridge example. However, the study only considers the damage identification method of the structure with constant cross-section. Wei et al. 26 proposed a new method for identifying the dynamics of the human body and the empty structure in a human structure system, based only on the measured FRF of the composite system. But zero-frequency response data cannot be extracted from dynamic test. Yan and Golinval 27 proposed a subspace identification technique applied for the identification of modal parameters, from which the measured flexibility matrix is constructed, but it is difficult to indicate exact damage location at a point where the change of diagonal entries of the flexibility matrix just appears. Kanta and Samit 28 utilized the change of mode shape and curvature to detect and quantify the damage in railway truss bridges, and the damage degree was evaluated by Bayesian damage identification algorithm with sensitivity. However, when the measured data is polluted by high-level noise, the accuracy of the modal parameters of the structure is affected.
There are two differences between the application of the weak identification algorithm and the damage identification. Firstly, the weak link exists at the beginning of the manufacturing process, not in the later use process. Secondly, even the machine tool structure which can be equivalent to the cantilever beam and bar structure is also complex and unequal cross-section. This paper proposes fast, accurate, and simple to implement identification index for identifying the weak link of the stiffness of cantilever structure of machine tool. The difference between the intact and the weak case is utilized to identify the location of the weak stiffness. The cantilever structure is used to demonstrate this characteristic of the identification index. The identification method provides a solution to overcome the problem that it is difficult to obtain the static deformation of the machine tool structure under study and therefore does not require using the static and dynamic stiffness of identification method of the machine tool structure studied above. In this identification method, the response of the internal structure of the system model can be obtained by reconstructing the state-space with the hammering dynamics test system, and the low-frequency data of the cantilever structure is extracted from the state space model. However, the static stiffness data are not obtained by using load pressure and FE static analysis. In addition, measured data and the reconstructed original data are utilized to identify the weak link of the stiffness of the cantilever structure. This paper mainly studies the low-frequency characteristics of the structure (i.e. 0 Hz signal) which can best reflect the machining characteristics of the machine tool. The proposed method can be applied to the cantilever combined structure of machine tool which can be equivalent to cantilever beam structure, to identify the weak link of structural stiffness using the hammer test.
In this study, we try to use the dynamic hammering test method to propose a new method to identify the weak link of stiffness of the cantilever structure, and solve the problem that the static stiffness is not easy to measure and is disturbed by noise in the actual measurement process. Following this introductory section, “Theory” section introduces the theory for the identification of the dynamics of cantilever beam model. In the “Weak link identification” section, the modal parameters are obtained by singular value decomposition technique (SVD), and the internal structural response of the system model is reconstructed by modal state-space method to extract the zero-frequency data of cantilever structure. Based on the measured data and reconstructed original data, the identification index is established to identify the weak link of stiffness. A numerical illustration of the working of the method is presented in “Numerical verification” section, whilst its experimental demonstrations are presented in “Experimental verification” section. Conclusions are drawn in “Conclusion” section.
Theory
Cantilever beam model
Machine tools are made up of structural parts with an infinite number of degrees of freedom. In dynamic analysis, according to the specific structure of the machine tool, the machine tool can be divided into several substructures of concentrated mass. The substructures are connected by an equivalent spring and an equivalent damper to form a dynamic model.
29
In this paper, the cantilever structure of machine tool is considered in this paper. Regions a, c, d, and e represent the regions excluding the joints in substructures 1, 2, 3, and 4, respectively, and region

Cantilever beam model.
Weak link analysis
Figure 3 shows the case where the cantilever beam structure has a weak stiffness, and the points represent the measurement points of the beam structure.
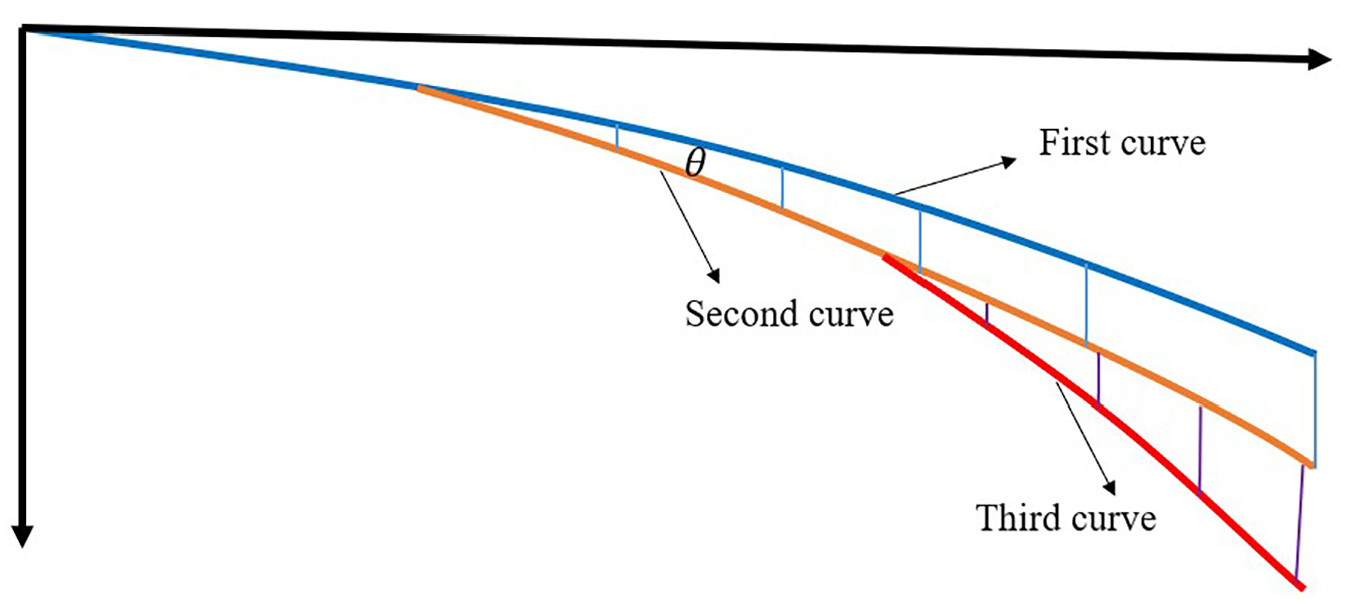
The analysis of the weak link of the cantilever beam.
During the dynamic test, the acceleration data under the inertial system is collected by placing the acceleration sensor on the cantilever beam. The first curve is the bending curve of the beam without the weak link of stiffness. The second curve is the deformation curve caused by a weak link in the beam structure, which has an obvious mutation at the weak link. The third curve shows that there are 2 weak links in the cantilever structure, and the second weak link will deflect based on the bending curve of the first weak link.
Weak link identification
The structure dynamic method of hammer testing is easy to be realized on cantilever structure. The acceleration sensor is a kind of vibration pick-up equipment with the characteristics of high precision, low requirements of environment, and installation condition. In this paper, the acceleration data of cantilever structure is collected by the acceleration sensor, the modal parameters of the structure are obtained by SVD, the modal state-space method is applied to reconstruct the dynamic characteristics of the cantilever structure and obtain the static stiffness data of the cantilever structure at zero-frequency, because zero-frequency signal can best reflect the machining characteristics of machine tool. Finally, based on the measured data and reconstructed data, the identification index is established to identify the weak link of stiffness.
Model parameters
This chapter uses ERA (eigensystem realization algorithm), 30 which is a method for global modal parameters identification in input-output time domain to solve the system identification problem of dynamical models that mathematically describe multibody mechanical systems. The key idea is to decompose the data matrix of the measured free impulse response by means of the SVD technique, the identification method can handle noisy signals properly, because it has a build-in noise rejection mechanism via the usage of truncated SVD. A computer program developed in MATLAB is used for performing the dynamic analysis to extract natural frequencies, damping ratios, and mode shapes.
System reconstruction
The state-space method is a powerful tool for solving differential equations. Design and analysis of most of modern dynamic control systems are also on the basis of this approach. 31 In the state space method, high-order differential equations are described by a set of first-order differential equations. The single differential equation or transfer function can not fully reveal the motion state of the cantilever structure system. The reconstruction of state space makes up for the lack of reflecting the change of internal parameters, and can completely determine the motion state of all internal variables of the cantilever structure.
Differential equation
It should be mentioned here that this section presents the vibration equation of the cantilever structure for the jth mode. The aim of this dynamic model is to provide the output data of the system that will be used in the identification simulation.

Where
State variables of system
The state variables of the vibration system is

Where Z is the state variable,
Input variables of system
The external input variable of the vibration system is the pulse excitation acting on the free-end of the beam. The input variable of the system is related to the position of the excitation.

Where U is input variable,
Output variables of system
The output variable is determined by the research objective of the cantilever beam. Therefore, the displacement is the output variable of the selected system.

Where
By using the definition of the system state vector, the equations of motion and the measurement equations of the system can be easily rewritten in the state space form as follows


Where Y and U are the output variable and the input variable of the system, respectively. A, B, and C are the system matrices with certain dimensions, respectively.
The matrices A, B, and C which can be explicitly obtained as follows


Where M is the system mass matrix, C represents the system damping matrix, K denotes the system stiffness matrix, I is an unit matrix,
When the external structure is non-uniform cross-section beam or does not know whether it is uniform cross-section structure in advance, the system information can not be obtained from A matrix, so the response of the internal structure of the system model can only be obtained by state space reconstruction of the testing system, and then the zero-frequency data of cantilever structure can be successfully extracted from state-space model.
Curve corner index
To compare the stiffness of each part of the cantilever structure, the stiffness of the uniform cross-sectional beam is used as the measured standard in this paper. The static deformation equation of the cantilever beam under the hammering force at the free end is as follows 32

Where V is the deflection of the beam, L is the length of the beam, a is the distance from the fixed position, P is the applied static load, E is the modulus of elasticity, and I is the moment of inertia of the cross-section.
Under vibration test, due to the measurement range problem of the force sensor, the determined value of the force load P at zero frequency cannot be obtained and the material properties of the cantilever are not known, but we can think of these unknowns as a whole with dimensionless H.

Selecting the first measuring point at the fixed position of the cantilever beam as the standard point. According to the data of the first measuring point, the H value under a low-frequency signal can be calculated and recorded as

Where
Taking

Where
Using

Where
The test data at zero frequency is represented by a matrix.

Where
According to equations (13) and (14), the curve corner index (

Where
According to the above analysis, when a weak link appears in the cantilever structure, the curve corner index between two measured points of weak location will change dramatically compared with other positions. The mutation location evaluates the stiffness of the weak link of the structure. Its relative magnitude reflects the size of the weak link of the beam structure stiffness.
Numerical verification
The purpose of using the FE model is to verify the validity of the identification algorithm, because the intrinsic parameters of the FE model can be known and adjusted to verify the accuracy of the identification algorithm. Once the identified object becomes an actual model, many intrinsic parameters in the model are not known, and the accuracy of the identified results cannot be known. Therefore, the analysis of the FE model of beam structure is highly significant.
In the model, the weak link is modeled by a constant stiffness EA reduction in an element, where the stiffness reduction is represented by a stiffness reduction ratio (SRR), defined as the ratio between the reduced and original EA. The identification effect of the index is verified with the shift of weak location and the uniform change of weak degrees. In practical cases, Input noise and output noise inevitably exist in testing system. Thus, the measured vibration data are contaminated with noise to investigate the behavior of the proposed index in noisy conditions, so as to ensure that the weak links of structural stiffness can be accurately identified in measured. To make better use of the index to identify the weak links of the cantilever structure. The dynamic characteristics of the cantilever structure are reconstructed by the modal state-space method to eliminate noise interference and solve the problem that the static stiffness data is not easy to measure at zero-frequency. The first three modal parameters of the beam structure are enough to simulate the dynamic performance of the beam under low frequency vibration.
Simulation model
The simulation structure is shown in Figure 4. Dimensions and material coefficients are listed in Table 1. The beam is uniformly divided into 20 Euler–Bernoulli beam elements with two nodes each with one degree-of-freedom (DOFs). Then, for the kth element consisting of node k and node k+1, the elemental stiffness and mass matrices are shown in equations (16) and (17).


Where E, I, l, A, ρ are the elastic modulus, inertia, element length, density, cross-sectional area.

Definition of nodes and elements along the beam.
Dimensions and material properties of the structure.

The mass matrix M and the stiffness matrix K of the beam model are assembled by the FE method. Proportional damping C = αM + βK (α = 10−12, β = 10−5) is assumed. Similarly, the FE model of the beam structure is constructed by state-space method. which can reflect the motion state of all internal variables of the structure. There is an impulse acting at the vertical direction of the 20th node. In the FE analysis, the sampling frequency is 10 kHz and the simulation analysis time is 15 s. The acceleration sensors are placed at each node of the cantilever structure to collect vibration data.
According to the vibration mechanics, the theoretical formula of the first three natural frequencies of the cantilever beam are
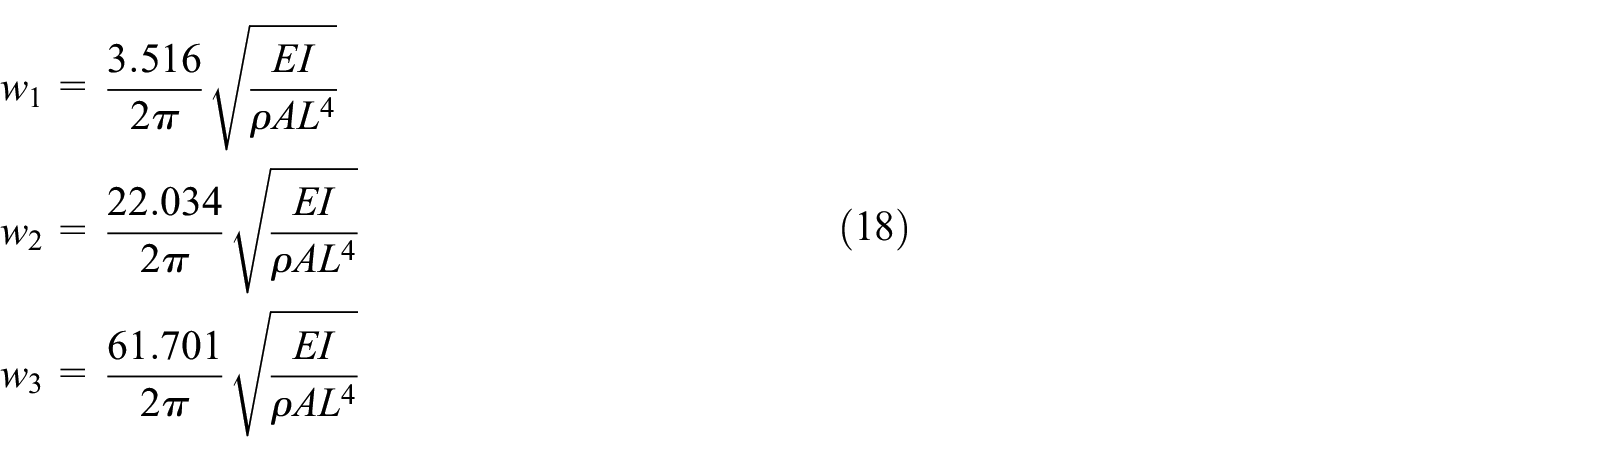
The theoretical calculation results and simulated results of natural frequency show a good agreement in Figure 5 and Table 2, indicating that dynamic modeling is reasonable. Figure 6(a) shows that the vibration curve of the cantilever beam is similar to the deflection curve under the static load at zero-frequency state. The cantilever beam can present static characteristics in the dynamic test, which verifies the validity of the theory. Based on the test data, the system identification method is used to obtain the response of the internal structure of the system model only through the state space reconstruction of the test system. Therefore, Figure 6(b) shows that the physical state of the original system can be fully expressed by state-space method to reconstruct the cantilever beam system.

Simulated results of natural frequency.
Comparison of natural frequencies between simulation and theoretical calculation.


Comparison between simulation results and theoretical results. (a) The comparison between theory and simulation. (b) The comparison between theory and reconstruction.
Weak identification
Four weak cases shown in Table 3 are investigated, including the noise-free scenario, the noise scenario, and the reconstruction response de-noising cases. Cases 1 denotes the single weak location problem, and cases 2 and 3 denote the 2 weak cases, Case 4 denotes the multiple weak location problems. The weak cases are used to verify the validity of the identification of weak elements. The case without noise is represented by E-element, the case with noise is represented by EN-element, and the system reconstruction is represented by ES-element.
Weak scenarios for beam model.
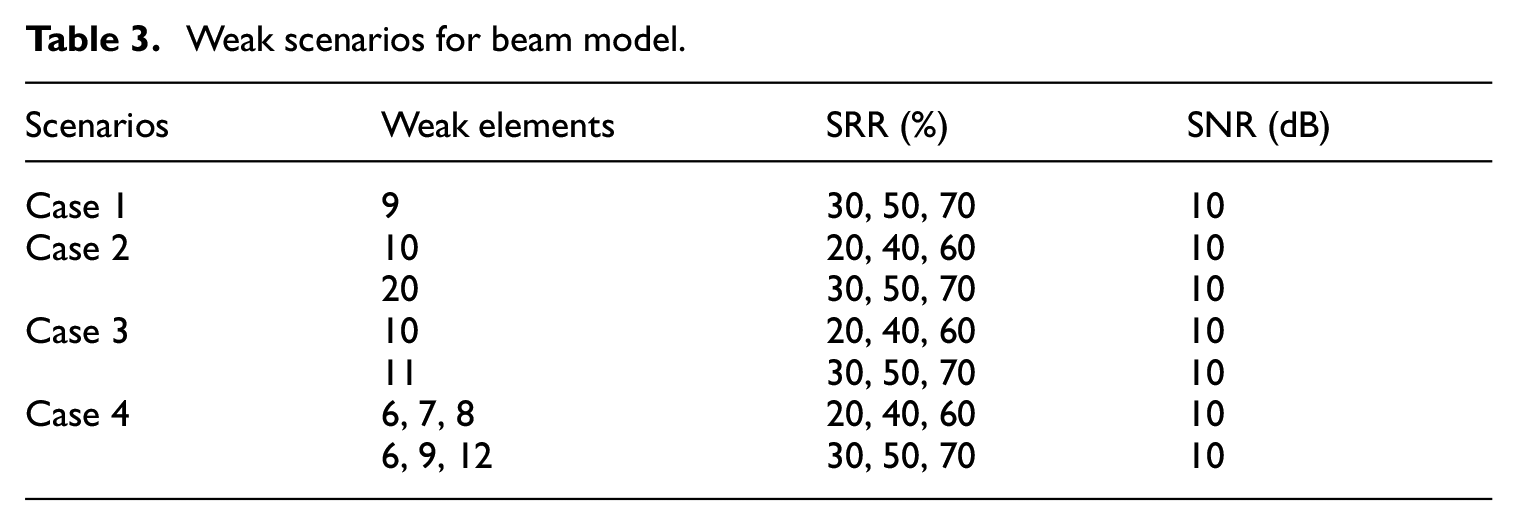
As showed in Figures 7(a)–10(a), it can be observed that the curve corner index can identify the weak link of stiffness accurately without taking the noise into consideration. At the location of the weak link of structural stiffness, there is a significant mutation in the weak stiffness compared with the intact stiffness. When the weak severity increases from 30% to 70% in the beam structure, the curve corner index becomes clearer as the mutation becomes larger, which gives an indication of the weak identification in the weakness simulated element as observed. Due to two adjacent weak elements, the node in the middle location appears a common node scenario that has weak stiffness in both elements, so only three of them have mutation values for two adjacent weak elements. Furthermore, the abrupt value has a cumulative effect, leading to the most mutation effect in a common node. Due to the 20th node is an edge element, the curve corner index cannot be calculated, only the 19th node is abruptly changed, each element of the beam has two nodes, so the curve corner index does not affect the identification effect of the edge element.

Weak location results of weak case 1. (a) Standard identification. (b) Noise identification. (c) Reconstruction identification.

Weak location results of weak case 2. (a) Standard identification. (b) Noise identification. (c) Reconstruction identification.

Weak location results of weak case 3. (a) Standard identification. (b) Noise identification. (c) Reconstruction identification.

Weak location results of weak case 4. (a) Standard identification. (b) Noise identification. (c) Reconstruction identification.
In order to verify that the curve corner index can identify the weak stiffness in the case of noise, so the 30% white noise with the signal to noise ratio (SNR) of 10 dB is used to contaminate the measured data, it can be seen that the noise causes some irregular response fluctuation at the rest nodes, resulting in poor identification accuracy, shown in Figures 7(b)–10(b). But the noise interference does not affect identification result too much in this case. The curve corner index can still show the largest mutation in the weak link of the stiffness.
However, we use the system reconstruction method which eliminates the noise effect to improve the identification accuracy, and the index value of other nodes does not change significantly, shown in Figures 7(c)–10(c). This fact may indicate that the proposed system reconstruction method can better solve the problem of noise interference. Therefore, the curve corner index can accurately identify single and multiple weak locations of the cantilever structure and evaluate the relative size of weak stiffness.
Based on the above analysis, the results from the numerical study showed that the proposed method could identify the weak locations with reasonable accuracy. It is worthwhile to note that the noise interference has a negative effect on the weak link of the identification stiffness, resulting in poor evaluation effect. But the reconstruction method has very high stability for the noise in testing data. Compared to Brasiliano et al., Frans et al., Sha et al., Alshalal et al., Nguyen et al., Wei et al., Yan and Golinval, and Kanta and Samit,21–28 the identification method in this paper is more rapid, simple, and accurate to identify the weak link of the stiffness. Meantime, the superiority of the application of this method in the engineering field is proved.
Experimental verification
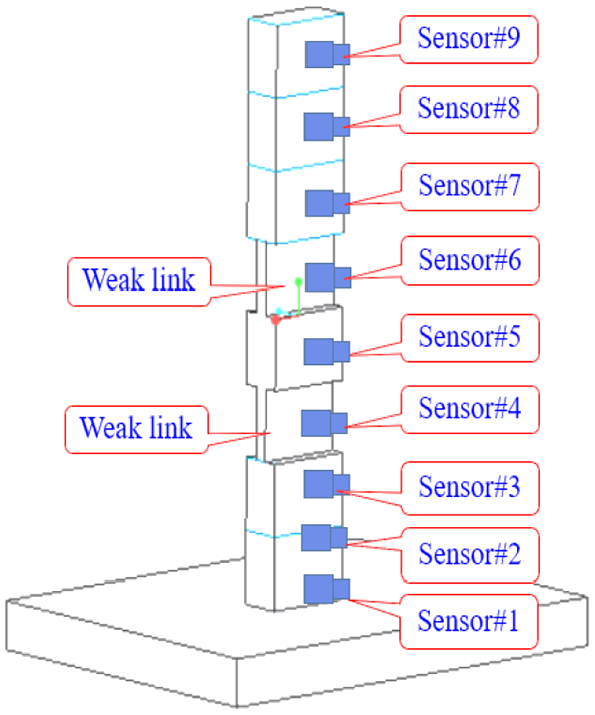
The tested structure is shown in Figure 11. The beam is fixed at one end and free at the other. The material of the beam is carbon steel with a length L = 0.84 m. Starting from the fixed-end of the beam, the beam is equally divided into eight segments, each of which is 0.12 m length, with a total of nine measuring points.

The experimental platform of beam structure. (a) Experimental set-up. (b) A schematic drawing of tested model.
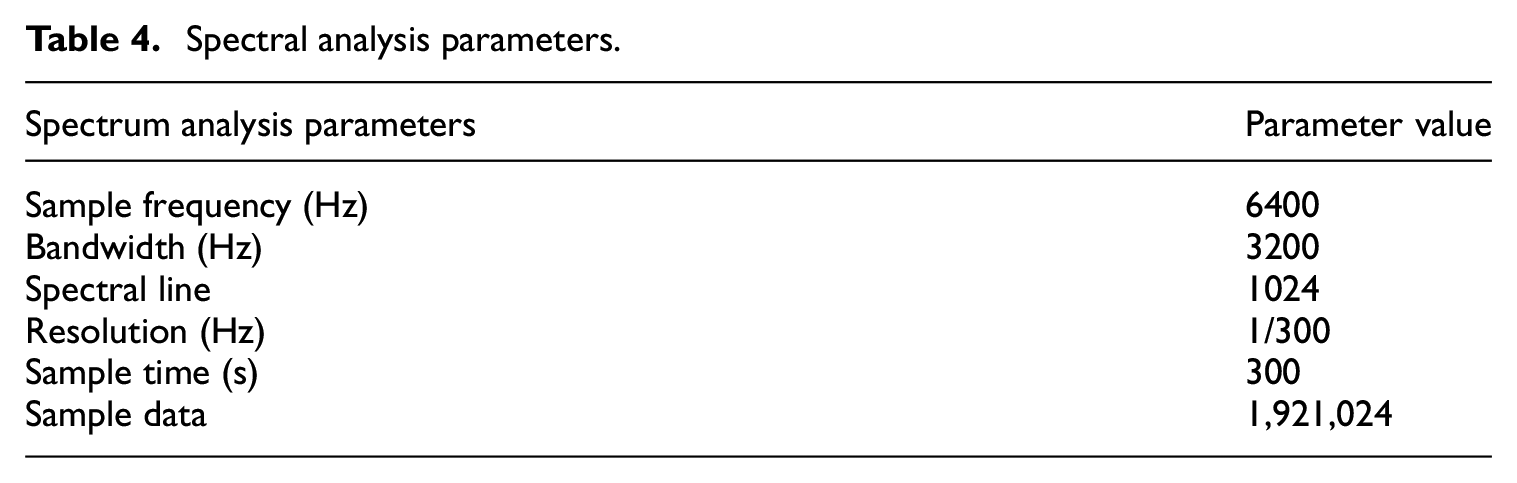
Due to the high requirements of low-frequency signals in the experiment, we recalibrate the sensitivity of the accelerometer with a sensor calibrator before the experiment. In order to avoid the torsional mode of the cantilever beam, the sensors are placed as far as possible on the centerline of each segment of the beam. Before the experiment is carried out, the natural frequency range of the cantilever beam is calculated using the theoretical formula to adjust the sampling bandwidth of acquisition instrument. The parameters of the spectrum analysis are selected as shown in Table 4. The experiment uses a modal test method to obtain the frequency response function and the time domain signal of the system.
Spectral analysis parameters.
In the experiment, the modal test of the intact cantilever beam is carried out to judge the similarity between the vibration mode and the shape characteristics of the real cantilever beam, in order to validate the rationality of the experimental beam structure.
An impulse hammer, SN38360, and accelerometers, BK4514B-001, are used to excite the structure and measure the response, respectively. The dynamic spectrum analyzer, LMS-SCM05, is used to acquire the measurement data. Figure 12 is the first third mode shapes of the test beam structure. According to the results of the modal analysis, the construction of the test beam conforms fixed method of cantilever beam at one-end, which proves that the construction of the beam structure is reasonable.
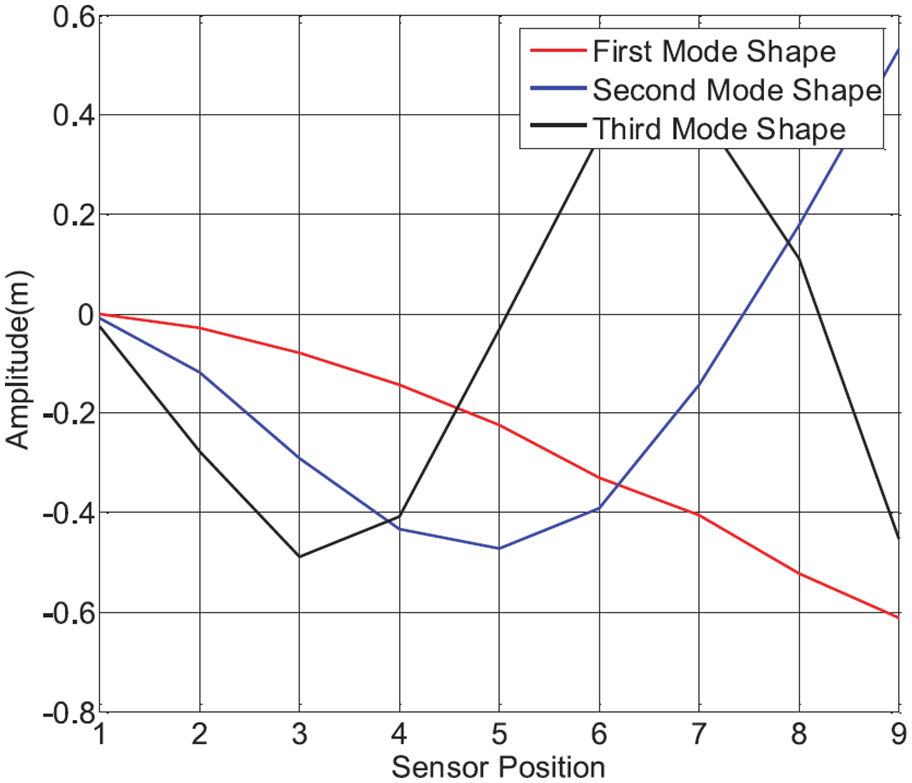
Vibration modes of cantilever beam.
Figure 13 shows the cantilever beam with elastic support as well as a typical EA weakness in the third and fifth sections which has been simulated by cutting a small piece of material with thickness and length equal to 0.015 m and 0.12 m in the weak element. Then the dynamic test of the beam with weak stiffness is carried out.
Typical EA weak model.
Figure 14 shows the comparison between the deflection curve of the intact beam under the low-frequency signal of the test experiment and the deflection curve of the theoretical calculation. Under the acquired low-frequency signal, the beam does not have strict static characteristics. The first reason is that the sensor cannot pick up the 0 Hz signal, so the mass term is involved in the calculation. The second reason is noise interference during the test. However, it does not affect the identification effect of the beam structure. The system reconstruction method can solve the above problems.

Comparison between the measured result and theoretical calculation.
The experiment via modal testing to obtain the frequency spectrum and the time-domain signal of the system. The first four modal parameters of the cantilever structure are enough to simulate the dynamic performance of the beam under low-frequency vibration. Figure 15(a) and (b) are the time-domain diagram and the frequency spectrum diagram of vibration test of cantilever structure, respectively. It can be seen from the Figure that the influence of noise interference is relatively large and the curve is not smooth enough.

Response of cantilever structure. (a) The measured time-domain. (b) The measured frequency spectrum.
The modal parameters of the structure are obtained by the SVD technique, the system matrix of A, B, and C in modal state-space equation can be obtained by using the first four modal parameters, the modal state space method is used to reconstruct the dynamic characteristics of the cantilever structure. The reconstructed time-domain diagram and spectrum diagram is as shown in Figure 16(a) and (b), and the response curve becomes smooth and free of burrs. However, the difference in time-domain is that some of the participating modes are intercepted, some of the higher-order modes are eliminated, and some of the modes connected with the main structure are also eliminated due to the small participation factor. In the process of frequency domain construction, the method of displacement construction is used, and the measured data is acceleration signal. The signal measured by the acceleration sensor does not affect the measurement of modal parameters, but affects the frequency response curve. In addition, as with time-domain signals, there is a case that the mode is eliminated and the frequency response is different from that measured.

Reconstructed response of cantilever structure of machine tool. (a) Reconstructed time-domain. (b) Reconstructed frequency spectrum.
The static stiffness data at zero-frequency of each measuring point is extracted in the system reconstruction. Finally, the identification index established by the measured data and the constructed data is used to identify the weak link of the cantilever beam structure. Due to the sensor of the pick-up range and noise interference. Figure 17(a) shows that the weak link of stiffness cannot be effectively evaluated. As shown in Figure 17(b), the identification index can accurately identify the position of the weak link in the third section of the beam structure by system reconstruction. But the identification effect of the weak link of the fifth is not sensitive. Compared with the original system, the accuracy of the identification index is greatly improved.
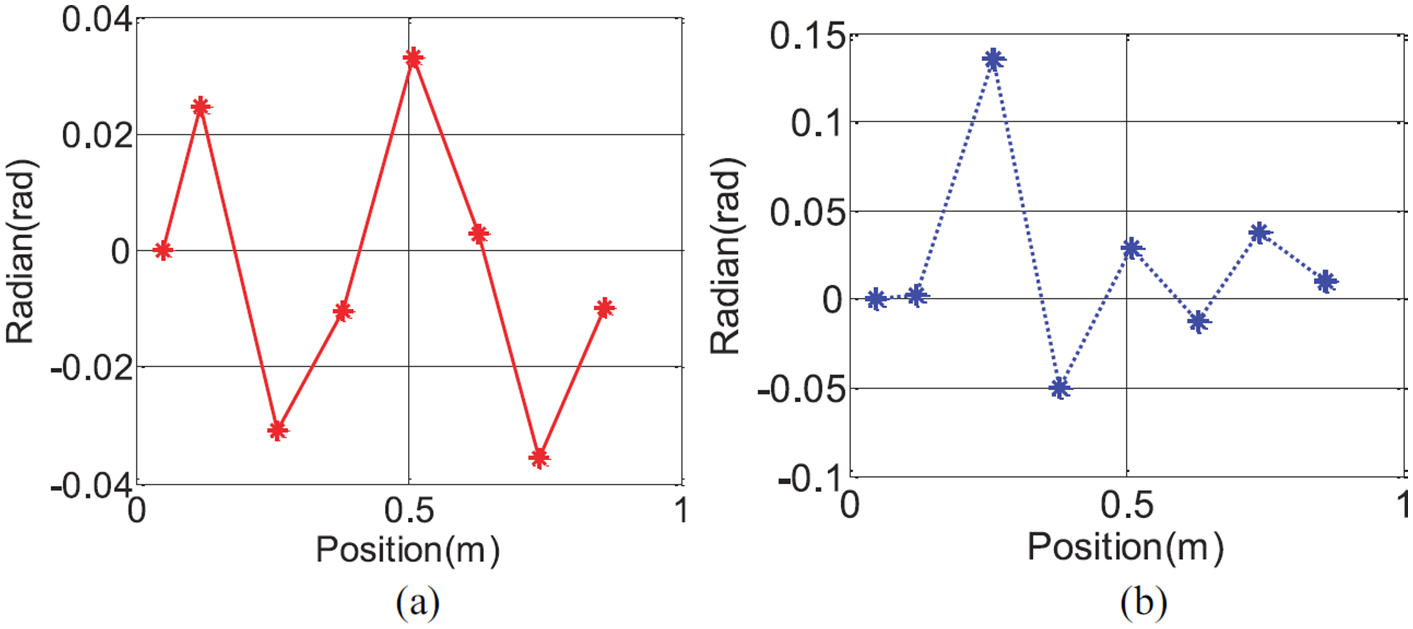
Identification results of system reconstruction. (a) Identification of measured data. (b) Identification of reconstruction data.
Conclusion
In this article, the curve corner index proposed can accurately identify single and multiple weak links of stiffness and evaluate the relative magnitude of weak stiffness for cantilever structure, and its correctness and practicability have been validated in the verification example and the case study. Most extraction methods of the static stiffness studies were drawn by using load pressure and FE static analysis, which made it difficult to obtain analysis results as accurately as possible. However, the article uses the hammer testing to obtain the measured data, which combines the techniques of SVD and systematic reconstruction, the measured data and constructed data are used to explore the identification effects. This study has found noise interference and static deformation with difficulty acquisition in actual measurement to be the two most important factors affecting the identification accuracy. Hence, in order to eliminate the effects of the two most important factors, the modal state space method is used to reconstruct the dynamic characteristics of the cantilever structure, which can greatly improve identification accuracy. In addition, the merit of the identification method is that the parameters of each surface are not known exactly, so the study of the contact surfaces are skipped. Under the condition of low-frequency vibration, the curve corner index of static characteristic is used to identify the weak link of machine tool stiffness considering only the dynamic test data. Hence, the identification index proposed in this paper is a fast, simple, and effective identification method. Meanwhile, only this identification method can solve the complexity of FE modeling, the blindness of identification, and the difference between FE modeling and machine tool structure.
The main purpose of the method is to qualitatively evaluate the weak link of cantilever structure. The future research will accurately locate the specific components of weak link and further assess the size of weak components.
Footnotes
Declaration of conflicting interests
The author(s) declared no potential conflicts of interest with respect to the research, authorship, and/or publication of this article.
Funding
The author(s) disclosed receipt of the following financial support for the research, authorship, and/or publication of this article: This work was supported by National Natural Science Foundation of China (grant no. 51875009), Beijing Municipal Natural Science Foundation (grant no. 3162005).