
Abstract
Determining the weak parts of a structure is one of the key issues in the field of machine tool stiffness improvement. However, studies show that overcoming the static deformation with acquisition difficulty is a complex problem in practical structures. This study considers the machine tool cantilever structure, as a cantilever beam and bar structure, where the objective is to propose a weakness index, to identify the weak part, using system reconstruction to extract the measured static deformation data and the fitting data. Stiffness reduction is used to simulate weak parts, while the effectiveness of the method is evaluated, in the case of various weakness values and of different noise levels, using the finite element simulation approach. The validity of the proposed method is illustrated through comparison of the theoretical results to the experimental ones, using the cantilever structure of a test machine tool. The research content provides some means of improving the machining accuracy of machine tools.
Keywords
Introduction
In the machine tools field, studies show that the machining performance is closely correlated to the dynamic performance. 1 The deformation, caused during the machining process, will affect the accuracy and the finished surface quality of the workpiece. Furthermore, it will reduce the productivity and lifespan of the cutter, 2 resulting in reduced useful life spam. Further investigations show that the machine tool stiffness directly affects the machining accuracy. Therefore, it is essential to study the stiffness changes of the structural parts and joint surface of the machine tool, in order to achieve the best improvement in the stiffness, by increasing the stiffness at the weakest parts of the machine tool. 3
The prior art literature indicates that the existing methods for identifying low stiffness of the machine tool can be distinguished into static and dynamic stiffness methods. In this paper, the dynamic testing method is used to study the identification of static stiffness of machine tools. There are two common methods to obtain the static deformation of the structure. First, there is static deformation testing, where the applied static load to the key parts of the machine tool is recorded by a dial indicator 4 or eddy current sensor, 5 in order to acquire the corresponding deformation displacement. It is worth noting that both methods require a fixed measurement point as the reference, which bears a significant effect on the measurement results. However, it is an enormous challenge to find an appropriate location to install a clamped device during the measurement. Moreover, the selected reference position is prone to deformation, which affects the testing precision.6,7 According to the second method, the maximum deformation location is determined through Finite Element (FE) static analysis. However, further investigations show that it is a challenge to calculate the static deformation with high accuracy, based on the FE static analysis method. Due to the parameters of the joint between structures being unknown, the accuracy of the joint surface in the FE modeling is not high. In general, the test method of static deformation is a relatively complicated scheme.
In engineering applications, it is necessary to identify the low stiffness quickly, simply and accurately. The stiffness of the cantilever part of the machine tool obviously reflects the weak stiffness parts, such as the tool holder system of the lathe. These cantilever parts are installed in the corresponding section of the machine tool, such as the lathe bed. The lathe bed is mainly made of large mass and large transverse cast iron. Compared with other structures on the bed, it is not easy to deform or the amount of deformation is very small, which can be ignored. Therefore, it can be regarded as a fixed-end structure. Hence, this paper studies the machine tool cantilever structure, which can be equivalent to cantilever beam and bar structure, in order to identify the weak part of stiffness.
The weakness identification method of machine tool can refer to the damage detection method of a bridge structure. One of the most widely used methods for damage identification is structural modal testing and analysis,8–10 according to which, the changes of natural frequency and modal shape in the modal parameters are obtained, to measure the size and location of the stiffness changes. Guo et al. 11 developed a novel approach, based on the reconstructed data and measured data, to identify the low stiffness of the cantilever beam structure. The establishment of this method lies in the acquisition of modal parameters. Lu et al. 12 proposed an approach for damage identification, using static test data, in which sparse regularization was introduced, to implicitly strengthen the sparse constraint of damage location. Rahai et al. 13 proposed a sensitivity based Singular Value Decomposition (SVD) model updating method for the subset of transfer functions. The method takes into account the first second-order changes of SVD parameters, to detect the damage degree and location in beam structures. Guo et al. 14 proposed a dynamic hammer testing method, to identify the weak parts of machine tool structure with an elastic support, by using measured data and fitted data. This method can not only identify the weak parts of the cantilever beam structure with elastic support, but can also identify the weak parts of the machine tool structure with variable cross-section. The method is well verified, using an elastic supporting structure. Guo et al. 15 proposed a weakness index, based on measured data and reconstructed original deflection data, to identify the weak parts of stiffness of the bar-shaped combined structure of a machine tool. The weakness index approach verifies its effectiveness, in several scenarios with single and multiple weakness points, including the noise case. This method has been applied to the identification of bar-shaped combined structures. Alshalal et al. 16 studied a new method to locate the damage, by combining the nodes with different vibration modes, and quantified the damage, by using the damage index, based on transfer function. It should be indicated that the internal parameters of the FE model can be adjusted at will. However, when the research object is a real test structure, its internal parameters may be unknown, so the accuracy of the identification algorithm cannot be verified. Zhu et al. 17 researched a two-step damage detection method, based on the structural static and dynamic coupling response. However, the method of this study is only suitable for damage detection in homogeneous structures. The variation of the flexibility matrix of dynamic measurement is used, to detect the characteristic parameters decomposition of structural flexibility change. However, the disadvantage of this method is that it relies on the historical data of structural testing. 18
The proposed identification approach is different from the aforementioned damage detection method. First, low stiffness exists at the initial stages of the workpiece process. Moreover, the cantilever part of the machine tool is a complex structure with non-uniform section stiffness. In the present study, it is intended to propose a simple, accurate, and fast method to identify the weak stiffness areas. This method overcomes the complexity of traditional methods, used in studying the static deformation of machine tools. It should be pointed out that, the static and dynamic stiffness identification approaches are not used in the proposed method. The identification process obtains vibration data through hammering test, while the state-space method is used, to reconstruct the internal vibration state of the structure and the static deformation (0 Hz) data set of the cantilever structure is extracted. It is no longer necessary to extract the static deformation, using existing methods. Furthermore, the weak part of the cantilever structure is identified by using the measured data and fitting data. This research mainly studies the low frequency characteristics of the structure that can better reflect the machining characteristics.
The content of the article is organized as follows: Section 2 introduces the equivalent relationship between the discrete model of machine tool and the beam structure. Section 3 introduces the basic theory of weakness index (WI), combining the measured zero-frequency data, and least square fitting data. Section 4 introduces the FE simulation analysis of bar model and beam model, which verifies the effectiveness of the WI method in identifying weak parts. Section 5 verifies the proposed method, using the measured data in the machine tool cantilever structure. Conclusions are drawn in Section 6.
Equivalent model analysis
Based on the specific structure of the machine tool, the dynamic model of the cantilever structure is composed of various substructures, each of which is connected by multiple equivalent springs and dampers in parallel. 19 In the present study, joint regions are considered as the weak parts of stiffness, Hence, this study proposes a weakness index to identify the weak stiffness. Regions a, b, c, and d represent the regions excluding the joints in substructures (1)–(4), respectively. Moreover, Region bi, i = 1,…, n represent the region of joints, as shown in Figure 1.

Simplified diagram of the machine tool discrete structure.
Development of the weakness index
Model parameters
The Eigensystem Realization Algorithm (ERA) 20 is a method for identifying modal parameters in the input-output time domain. In this section, by constructing the cross-power spectral density matrix at each frequency and using Singular Value Decomposition (SVD), the frequency response curve of each measuring point can be obtained. The peak value of each natural frequency is extracted, using MATLAB programming, to obtain the mode shape data and damping ratio.
Response reconstruction theory
In this section, considering a general FE model to describe the structure under analysis, the system dynamics equation is as follows:

where,
The general state of the system model is identified by the system state vector z(t) of dimension 2

where,
Equation (1) can be expressed in the following state-space form:

where, A, B, and C denote the system state matrix, the input matrix, and the output matrix, respectively. Moreover, v(t) and u(t) represent the output vector and the input vector, respectively.
The corresponding state representation is:


where, M, C, and K denote the system of mass matrix, viscous damping matrix, and stiffness matrix, respectively. Moreover, I,
When the research object structure is a heterogeneous structure, the system information cannot be obtained from A matrix. Therefore, only the reconstruction of the test system state-space can provide the response of the internal structure of the system model.
The proposed identification method
It is assumed that, during the machining process, the action point on the cantilever structure is generally at the top of the cantilever-end. Therefore, there is only one acting point in the state-space equation, while the position of the applied force to the cantilever structure should be determined according to the placement of the sensor. The data of the static stiffness at zero-frequency are obtained by the system reconstruction. The number of used sensors is often more than the number of unknown ones, during the testing process. Therefore, a unique solution cannot be calculated. Meanwhile, in this study, the least-squares analysis is used to approximately fit an exponential model, where there are more than the required data points, to fit the assumed number of exponential terms. The proposed method can effectively fit the trend model of the measured data. Therefore, the static deformation data set is fitted with the highest cubic curve of the least squares procedure, without higher-order terms. The model equation can be written as the follows:

where, y is the measured static deformation data;
The coefficients of the polynomial, expressed in the matrix S, is as follows:

Next, equation (6) is expressed in matrix form as:

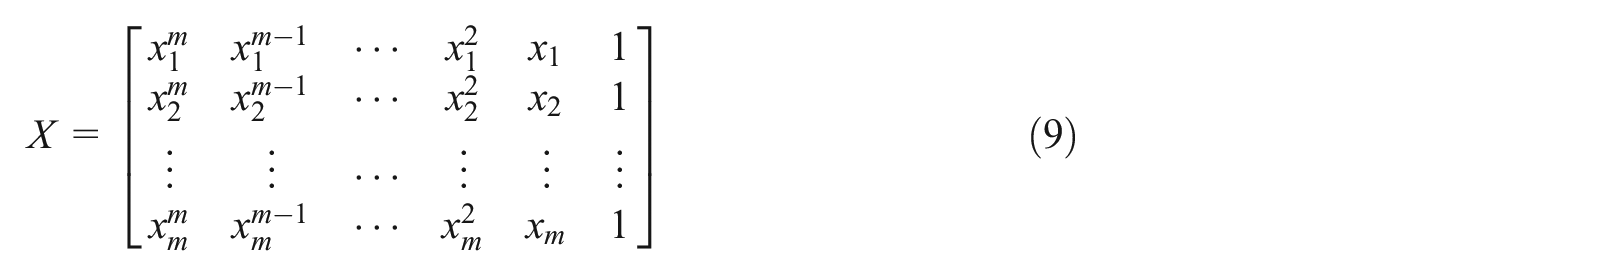
where, Y is the array of measured static deformation data at zero-frequency and
The transposed matrix of both sides of equation (8) simultaneously multiplied by X provides:


Setting the coordinates of the measured data points as

The array
where,
The array
where,
According to the measured data and the fitting data, as derived from the least squares method, the WI, is defined as:

where, WI is the calculated weakness index and r is the distance between adjacent measured points.
The WI values of each node can be calculated according to the proposed method. If the calculated WI of the left and right nodes of an element is significantly higher than that of other elements, the location of this element with the highest peak value is the weak part of the structure.
Based on the aforementioned study, when weak parts appear in the cantilever structure, the data of the fitting curve, related to the weak location, change significantly, compared to other positions. The present study uses a standard deformation curve of the uniform cross-section structure, to measure the weak parts, in both cases of uniform and non-uniform cross-section, in the cantilever structure. However, most of the machine tool structures are not uniform cross-section structures, such as the case of the measured structures of this study.
Identification process
Figure 2 illustrates the example of a cantilever beam structure with weak stiffness in space, where the green points on the curve indicate the number of nodes of the beam structure. During the dynamic test, the sensors are installed on the cantilever nodes, to collect acceleration data of inertial system.
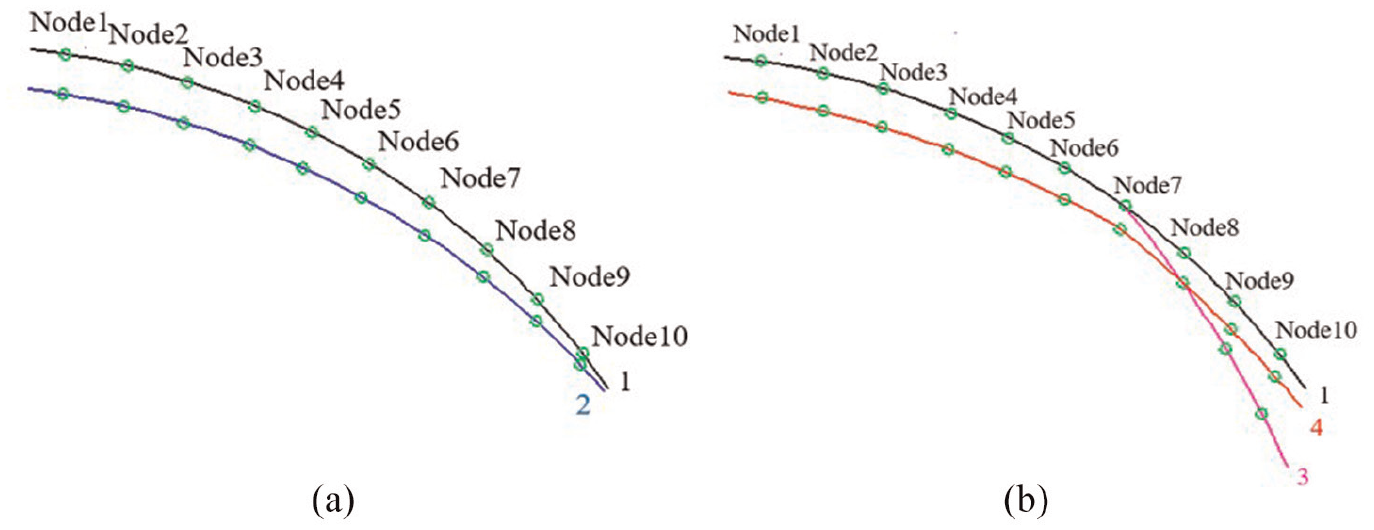
Identification process of the cantilever structure: (a) fitting deformation process of the beam and (b) fitting deformation process of weak stiffness.
Curve 1 shows the deformation process of an intact beam with uniform stiffness. Curve 2 illustrates the infinitely approaching deformation curve, fitted according to the least squares approach. However, the beam structure in curve 3 has a weak location, which obviously deviates from the ideal curve 1, at the two nodes corresponding to the weak location, while curve 4 is based on the weak data of the beam. The cubic curve is obtained based on the highest fitting term. It is observed that the curve fitting approximates the abrupt node 7 on the left. Moreover, compared to the fitting data of other intact positions, the curve fitting data between the two measuring points, at the weak position, will have a significant mutation, as the fitted curve will again approximate curve 1 after node 8. Finally, using the data of the measured beam structure as a standard, in case of beam structure with weak parts, the fitting data and the measured data are used to establish the relevant index, to identify the location with the largest mutation in the structure. In other words, the location in the cantilever structure, where the largest mutation occurs, is the weak part of the stiffness.
Simulation verification
In the following simulation model, the mass matrix and the stiffness matrix of the structural model are assembled. Proportional damping is assumed as C = αM + βK (α = 10−12, β = 10−5). There is an impulse acting at the free ends of the bar and the beam structure. The sampling frequency is 10 kHz and the simulation time is 15 s. Acceleration sensors are placed on each node of the cantilever structure, to collect respective data. The first three modal parameters of the structure are sufficient to simulate the dynamic performance, under the low-frequency case under research.
The bar structure
Figure 3 shows the bar structure model, used to verify the weak identification index, as described above. The length of the bar structure is L = 1.2 m, uniformly divided into 20 elements. Each element has two nodes and one DOF. The modulus of elasticity and mass density of all elements are E = 210 Gpa and ρ = 7850 kg/m3, respectively. In addition, the cross-sectional dimensions are b = 0.25 m and h = 0.1 m.

The simulation model of bar structure.
Figure 4 shows that the results of curve fitting by least squares are consistent with the simulated results, which verifies the validity of the theoretical analysis. As shown in Figure 5, when the bar structure appears in the weak part of the nineth element, the curve fitting by the least squares method does not coincide with the deformation curve of the intact beam. Moreover, it is found that the weak part of data differs from the measured data, significantly. After passing through the weak element, the fitting data coincide with the weak data, infinitely approximating the curve without weak data. Therefore, the identification method, as proposed in this study, is functional for the identification of the weak parts of the stiffness.
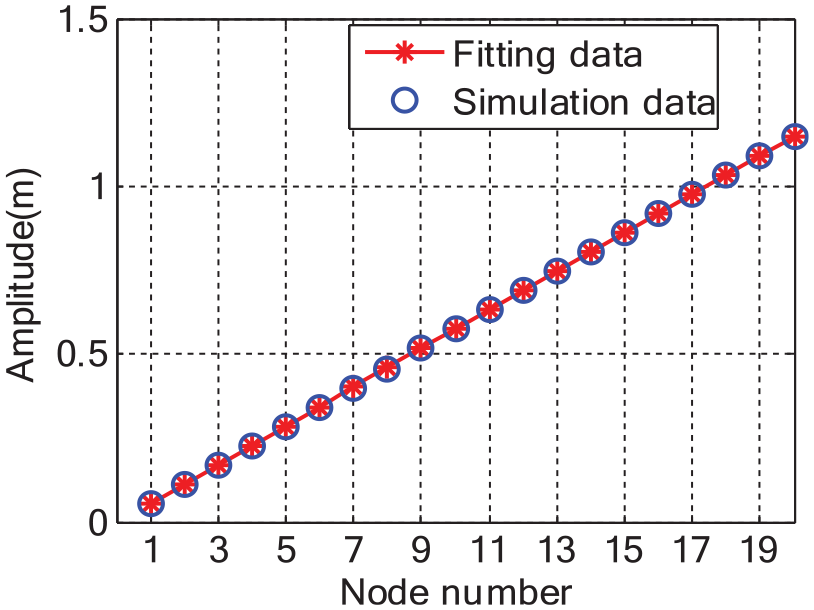
Comparison between fitting data and simulation data.

The correlation of the deformation curve for weak stiffness: (a) the process of deformation curve and (b) deformation relation of weak location.
Weak location identification
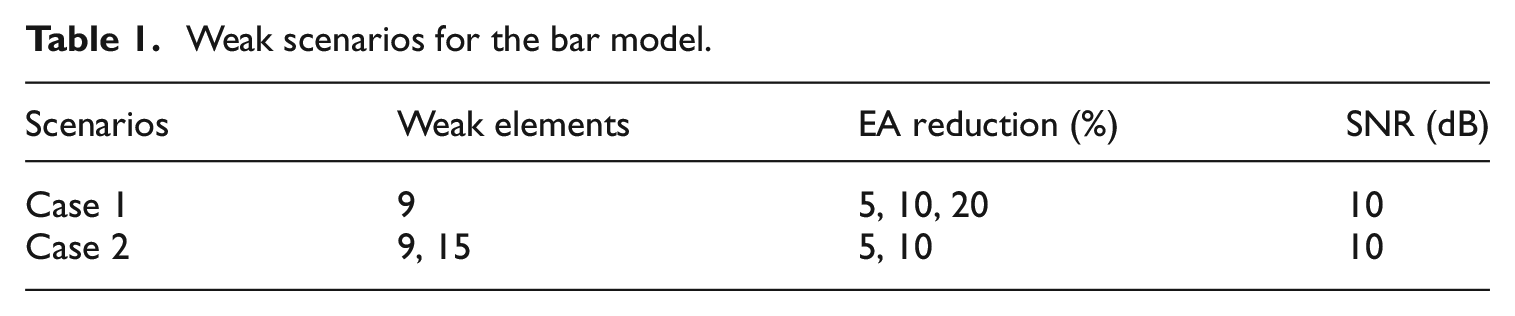
The weak part is simulated by a tensile stiffness (EA) reduction in an element. Two weak cases of the bar structure are shown in Table 1. The case without noise, the case with noise, and the system reconstruction are represented by E-element, EN-element, and ES-element, respectively.
Weak scenarios for the bar model.
Identification results
Figures 6(a) and 7(a) show that the WI can accurately identify the weak parts, without considering the noise. The WI values at the weak position are obviously different, compared to other positions, while the peak values increase along with the weakness severity.

Identification results of case 1: (a) weakness identification result and (b) weakness identification result under noise.

Identification results of case 2: (a) weakness identification result and (b) weakness identification result under noise.
As illustrated in Figures 6(b) and 7(b), the measured data are contaminated with signal-to-noise ratio (SNR) of 10 dB, representing measurement noise. It is evident that, the noise interference has little influence on recognition ability. Hence, the WI can accurately identify weak part of stiffness, even in the case of noise. Since the WI has a strong anti-noise ability on the bar structure, there is no need to use reconstruction response, in order to eliminate the noise influence.
The cantilever beam
The simulation structure is illustrated in Figure 8. The length of the beam structure is L = 1.2 m, divided into 20 beam elements. Each element has two nodes and each node has two DOFs. In addition, the elasticity modulus and mass density of all elements are E = 210 Gpa and ρ = 7850 kg/m3, respectively. Moreover, the cross-sectional dimensions are b = 0.25 m and h = 0.1 m.

FE model of the beam.
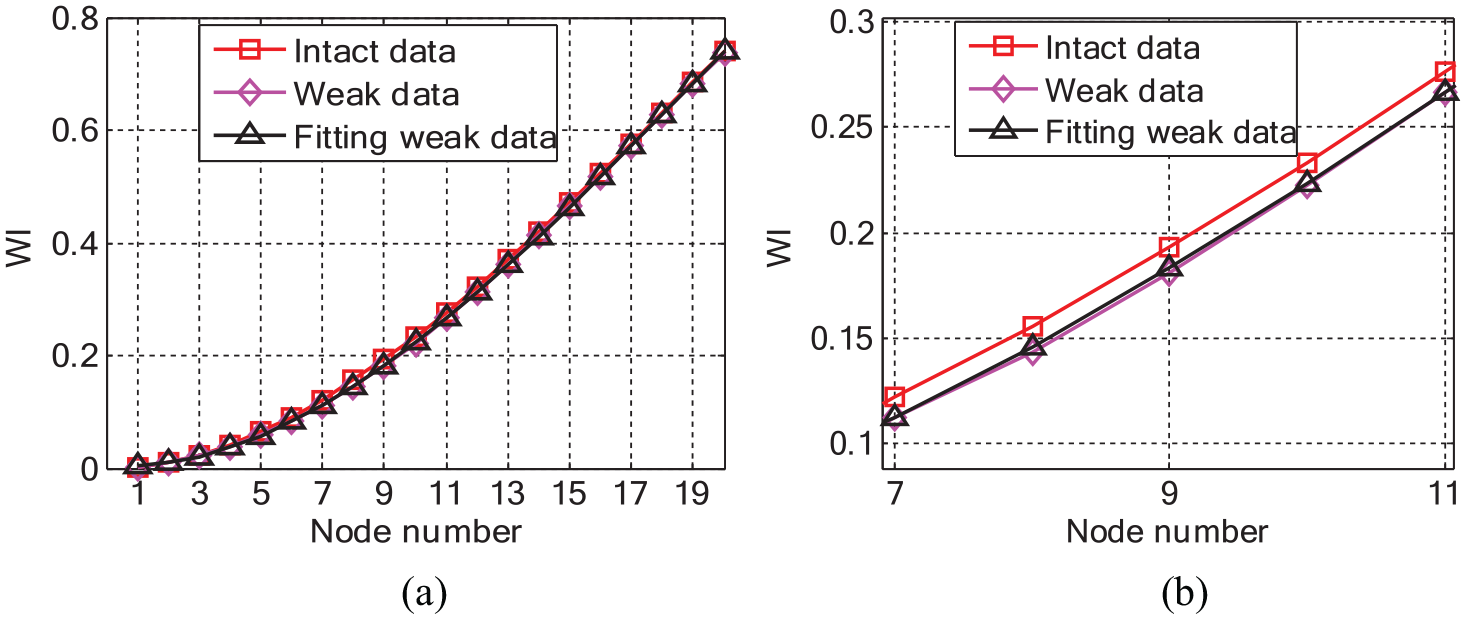
In a similar way, the results of curve fitting by least squares and simulated results are in good agreement, as shown in Figure 9, which verifies the validity of the theoretical analysis. According to Figure 10, when the beam structure exhibits the weak part in the nineth element, the curve fitting, based on the least squares method, will not coincide with the deformation curve of the intact beam, while the difference between the weak part of data and the measured data is quite significant. After passing through the weak element, the fitting data coincide with the weak data, infinitely approximating the curve without weak data. Therefore, the proposed identification method is effective in determining the weak parts of the stiffness.

The comparison between the fitting data and the simulation data.
The relationship of deformation curve between fitting and weak stiffness: (a) the process of deformation curve and (b) deformation relation of weak location.
Identification results
Two weakness cases of the beam structure are shown in Table 2. Figures 11(a) and 12(a) show that the WI can accurately identify the weak parts, without considering the noise. The WI values in the weak position show significant mutation, compared to other positions. As the degree of weakness increases, in the beam structure, the identification effect of WI method becomes more evident. However, there is a slight mutation at the position of the first element of the beam structure. The main reason is that, the fitting data, as generated from the least squares process, at this initial position, are slightly distorted. Nonetheless, this does not affect the identification result.
Weakness scenarios for beam model.


Identification results of case 1: (a) weakness identification result, (b) weakness identification result under noise, and (c) weakness identification result under reconstruction.

Identification results of case 2: (a) weakness identification result, (b) weakness identification result under noise, and (c) weakness identification result under reconstruction.
In practical cases of testing system, input and output noise inevitably exist. Considering the influence of environmental noise, the measurement data was contaminated by 30% white noise with SNR of 10 dB. Figures 11(b) and 12(b) show that the index values of other measuring points slightly fluctuate, due to noise interference, but the recognition results are not seriously affected.
However, Figures 11(c) and 12(c) show that the system reconstruction method eliminates noise interference, in order to improve the recognition accuracy. In addition, index values of other measuring points showed no significant changes. Therefore, WI can more accurately identify the weak parts of cantilever beam, by using the system reconstruction method.
The non-uniformly distributed bar structure
The bar structure model of the simulation example is shown in Figure 13, used to verify the identification with less sensors on the structure and in the case of non-uniformly distribution. The length of the bar structure is L = 0.9 m, non-uniformly divided into eight uneven bar elements. The length of the second element is 0.2 m, while the length of the remaining bar elements is 0.1 m. Each element has two nodes and one DOF. The modulus of elasticity and mass density of all elements are E = 210 Gpa and ρ = 7850 kg/m3, respectively. In addition, the cross-sectional dimensions are b = 0.25 m and h = 0.1 m. Table 3 shows the weakness scenarios for the non-uniformly distributed bar model.

The simulation model of non-uniformly distributed bar structure.
Weakness scenarios for the non-uniformly distributed bar model.

Identification results
Figures 14 and 15 show that the identification effect of the weakness index, under the condition of less sensors and non-uniform distribution, is well verified by using single and multiple weakness scenarios. The WI can accurately identify the weak parts, with or without considering the noise. The weak position shows obvious maximum mutation, whereas the higher the weakness degree is, the greater the mutation degree of WI value is. It can be seen that the added noise does not affect the identification result on the structure. Therefore, the WI can still accurately identify the weak parts of stiffness, even in the case of less sensors and non-uniform distribution, with noise present.

Identification results of case 1: (a) weakness identification result and (b) weakness identification result under noise.

Identification results of case 2: (a) weakness identification result and (b) weakness identification result under noise.
Experimental verification
Beam structure experiment
The test specimen, used in this study, is a cantilever beam (Figure 16). Starting from the fixed-end, the beam is divided into eight equal portions, 0.12 m long. Moreover, nine measurement points, at each segment boundary, are used for sensor placement. An impulse hammer and accelerometers are used to excite the specimens and measure the transverse vibrations of the beam, respectively. All accelerometers are connected to an acquisition system, which is used to obtain the measured data. In spectrum analysis, the sampling frequency is set as 2048 Hz.

Experimental platform of beam structure.
The third and fifth sections of the cantilever beam act as the weak parts (Figure 17), where a small piece of material with thickness of 0.015 m and length of 0.12 m is cut from the beam structure. The vibration data set, considering weak parts, is acquired by using the accelerometers. Figure 18(a) and (b) illustrate the time domain diagram and the frequency spectrum diagram of the cantilever beam, respectively. Due to the pick-up range of the sensor and the noise effect in the testing environment, the curve is not smooth enough.

Typical EA weak model.

Response of cantilever beam: (a) the time-domain and (b) the frequency spectrum.
Figure 19(a) shows that, the weak parts of the beam structure cannot be effectively evaluated. Hence, the modal parameters are acquired by SVD. Moreover, by using the first four modal parameters, the A, B, C matrix in the modal state-space equation can be obtained, while the static deformation data at zero-frequency can be extracted through simulation. Finally, the weak parts of the cantilever structure are identified by using the static deformation data and polynomial fitting data. The identification results of the weak parts of the structural stiffness are shown in Figure 19(b). Based on system reconstruction, the WI can accurately identify the weak positions of the third and fifth sections of the beam structure. Compared to the original system, the accuracy of the identification index is significantly improved. Therefore, the WI can accurately identify the weak parts of the beam structure, verifying the validity of the theoretical analysis.

Identification results of cantilever beam structure: (a) identification of measured data and (b) identification of reconstruction data.
Cantilever structure of the machine tool
The present study focuses on the machine tool part of the cantilever beam and bar structure. The main issue is that the cantilever structures of machine tools are of non-uniform section stiffness. Therefore, the proposed method is used to identify the weak parts of the cantilever structure, assembled by the tailstock and bed of the machine tool, while the feasibility of applying the proposed weakness index to the actual machine tool is also verified.
Vibration test
The test object is the joining structure of the tailstock and the bed of the machine tool, which has two joint surface structures as follows: The joint surface 1 is coupled with a pair of planes and connected by bolts, while the joint surface 2 is the joint surface of the sliding guide rail. It should be indicated that the bottom of the tailstock is connected to the bed through the joint surface 1, while the middle and the upper parts are connected through the joint surface 2, overall conforming to a beam structure. An impulse hammer is used to excite the cantilever end, along the X-direction, while seven accelerometers are placed to measure X-direction response data, as shown in Figure 20.

The drawing of the test structure: (a) a schematic drawing of machine tool model and (b) the cantilever structure of the machine tool.
Results and discussion
The whole experiment adopts the modal test method with a sampling frequency of 2048 Hz. The first four modal parameters are sufficient to simulate the dynamic performance, under low-frequency characteristic. Figure 21(a) and (b) illustrate the time-domain and the frequency spectrum diagram of the machine tool cantilever structure, respectively. The graphs show that the noise influence is relatively high and the distribution is not smooth enough.

Vibration response diagram of the cantilever structure: (a) the measured time-domain and (b) the measured frequency spectrum.
However, the described system reconstruction method succeeds in acquiring the static deformation data with acquisition difficulty and eliminates noise interference, as shown in Figure 22. Finally, the weak part of the cantilever structure is identified by the WI, as established by the measured data and the fitting data. The identification result is shown in Figure 23. The largest mutation location reflects the weak parts of stiffness. It is evident that the degree of variation between measured points 2 and 3 is smaller than that of measuring point 5 and 6. The contact region between testing points 2 and 3 is the joint surface of the guide rail, while the contact area between testing point 5 and 6 is the joint surface of the middle and the upper part of the tailstock. It is found that the joint surface is the area where the weak parts of stiffness occur, which is consistent with the actual case. The joint surface 1 is the weak part of the cantilever construction stiffness, which corresponds to the location of the joint surface between the middle part and the upper part of the tailstock. Therefore, the WI can accurately identify the weak parts of the cantilever structure of the machine tool.

Reconstructed response diagram of the cantilever structure: (a) the reconstructed time-domain and (b) the reconstructed frequency spectrum.

Identification results of experiment.
Conclusions
In the presented study, a novel local stiffness identification method, called simultaneous WI, based only on fitting data and the measured data, is proposed to identify the weak parts of stiffness. The following conclusions are derived:
The WI method performs a satisfactory identification, according to experimental and simulation results, which verifies the accuracy of the theoretical analysis;
To solve the static deformation with difficulty in acquisition, it is a novel idea to extract static deformation data of each measuring point in the cantilever structure, by system reconstruction. Compared to the measured original system, higher recognition accuracy for cantilever structure is demonstrated;
The WI can be used to identify the weak parts of beam and bar structures. It can also be used to identify the weak part of machine tool cantilever structure with non-uniform distributed stiffness. In addition, this method is suitable for identification based on few and non-uniformly distributed sensors;
The proposed method is used to identify weak parts, taking advantage of the dynamic hammer testing method, for the facilitation and reliability of the measurement. The identification method can solve the complexity of the FE modeling and the blindness of identification, as well as the differences between the FE modeling and actual machine tool structure, resulting in inaccurate results. Moreover, the merit of the WI method is that it does not need to know the exact parameters of each joint surface, thus rendering their study redundant.
The main purpose of the proposed method is to identify the weak parts of the stiffness in cantilever structures. However, the weakness degrees of the weak parts have not been quantified, which is a focus point of future research.
Footnotes
Declaration of conflicting interests
The author(s) declared no potential conflicts of interest with respect to the research, authorship, and/or publication of this article.
Funding
The author(s) disclosed receipt of the following financial support for the research, authorship, and/or publication of this article: This project is supported by National Natural Science Foundation of China (Grant No.51875009), Beijing Municipal Natural Science Foundation(Grant No. 3162005).