
Abstract
In the present work, the working state of the crane leg is analyzed and discussed, and its structure is optimized. SolidWorks software is used for modeling; ANSYS software is used for finite element analysis. First of all, the constrained finite element method (CFEM) is used to analyze the linear eigenvalue buckling and geometric nonlinear buckling of outriggers with different cross-section shapes. Prove that the curved leg has certain advantages in buckling. At the same time, analyzing the leg along a different path of buckling condition and stress changes provide the basis for the design of the subsequent reinforcement. After selecting the best cross-section shape of the outrigger, the agent-based multi-island genetic algorithm is used to optimize the structural parameters of the outrigger under the transverse stiffened plate reinforced structure and the longitudinally stiffened plate reinforced structure respectively. It is proved that the outrigger with the transverse stiffened plate has a significant effect in improving the bearing capacity and in the lightweight of the structure. Finally, the gap between the movable leg and the fixed leg was changed, the stress of different gaps was analyzed by using the finite element method, and the appropriate gap value was selected according to the high-order fitting curve.
Keywords
Introduction
In order to reduce the consumption of petroleum energy to protect the ecological environment, countries around the world are vigorously developing large-scale wind power projects and hydropower projects. Therefore, large cranes with good lifting performance and reliability are increasingly favored by the construction machinery market. The leg is an important part of the crane. During operation, the vertical force and overturning force on the vehicle are loaded on the four legs. The design of the legs directly affects whether the crane can operate safely and reliably. So the outrigger work state of transverse bending and outrigger structure optimization study on the use of crane safety and stability is of great significance.
The research on the working state of the crane leg belongs to the buckling problem of the plate shell. In recent years, it has become more and more common to use the finite element method to analyze plate and shell buckling. Finite element analysis methods for buckling include linear eigenvalues, nonlinear statics, nonlinear transients, and explicit dynamics.1–10 Ngamkhanong et al. 11 used the method of eigenvalue buckling analysis to study the phenomenon of cross rail buckling, analyzed the deformation of cross rail, and put forward the possibility of using the discrete method to reduce the track buckling, which provided the basis for the design of track and sleeper. Silva et al. 12 used linear and nonlinear methods to study the buckling of sheet steel with different types of holes and determined the optimal geometric configuration. Vu et al. 13 used linear and nonlinear finite element methods to study the influence of web reinforcement on the ultimate strength of the steel plate beam, analyzed the optimal number of reinforcement, and verified the correctness of the finite element method through experiments. White et al. 14 proposed a new design method of plane steel frame by studying the buckling analysis of inelastic eigenvalue based on inelastic stiffness reduction factor. Li et al. 15 used the geometric nonlinear buckling analysis method to analyze the buckling of the thin-walled arch. They discussed the influence of volume fraction index on buckling pressure, annular force, and bending moment. Liu et al. 16 used the display finite element method to simulate different structural parameters numerically and analyzed the dynamic buckling behavior of the submarine spherical shell structure during the collision, which provided a basis for the structural design of submarines and underwater domes. Zhao et al.17,18 used implicit and explicit finite element analysis methods to improve the local stability of box-type retractable legs. Yao et al.19,20 performed the buckling analysis of the crane’s last telescopic boom through field tests and implicit and explicit finite element methods. He obtained the sensitivity of the telescopic boom ultimate load to different defects and verified the reliability of the finite element method.
Research on structural optimization of outriggers is a structural optimization problem. In addition to the conventional simple solution method, criterion method, mathematical programming method, and a hybrid method that uses both the criterion method and the planning method, a genetic algorithm (GA), Neural network algorithm, simulated annealing algorithm, and other heuristic algorithms have been developed in recent years.21–26 Based on the ICM method, Du and Guo 27 used the full stress criterion method and the stress globalization method to perform topology optimization on the continuum structure considering the damage, respectively, and proved that the optimization effect of the full stress criterion method is better. Silva et al. 28 used the sequential linear programming algorithm to optimize the finite element model of partially interacting steel-concrete composite beams. Millan-Paramo and Abdalla Filho 29 proposed a new improved simulated annealing algorithm for truss structure shape optimization and verified that this method is more reliable, stable, and effective than other heuristic optimization methods. Solarte-Pardo et al. 30 combined genetic algorithm and artificial neural network to develop a cutting edge selection and cutting parameter optimization system. Liu et al. 31 used two neural network algorithms, BP and RBF, to analyze the collision response of the adjacent beam and pier beam of the bridge under earthquake, and proved that the RBF prediction effect is better. An et al. 32 used the BP neural network and genetic algorithm to dynamically optimize the lens structure parameters, reducing the weight of the lens while ensuring the hardness.
When the crane leg is working, the upper area is compressed and the lower area is tensioned. The compressed thin-walled sheet is prone to buckling, which affects the safety of the vehicle. According to the investigation of the shape change of the section of the supporting leg, it can be seen that the rectangular section beam structure is commonly used in the past, as shown in Figure 1(a). Still, on some large cranes, arc-shaped outriggers began to replace traditional rectangular outriggers with their excellent structural stability, as shown in Figure 1(b). At present, there is no literature on the buckling resistance of legs with different cross-sectional shapes. In order to design a crane with better lifting performance, it is necessary to make a profound study on the buckling load and ultimate load of legs with different cross-sectional shapes.

Crane outriggers with different cross-sections: (a) rectangular section outriggers and (b) curved section outriggers.
In the present work, the buckling condition, critical load, and stress-strain of crane leg are analyzed by the finite element method. First, consider the same layout space under the different cross-section shapes of the leg load-bearing characteristics. That is to say, the linear eigenvalue buckling analysis and geometric nonlinear buckling analysis are carried out for the outriggers with the same width and height but different cross-section shapes. To get the buckling and the carrying capacity of the best leg cross-section shape, and analyze the buckling and stress conditions of the different paths, to obtain the area of poor performance, provide the basis for subsequent set stiffeners. Then the agent-based multi-island genetic algorithm is used to optimize the parameters of the stiffeners in the best-performing leg to improve the bearing capacity of the leg and reduce the quality of the leg to a certain extent. Finally, the single variable finite element method is used to analyze the stress situation of the removable outrigger with different clearance values and fit the curve. Through the analysis of the fitting curve, the appropriate clearance value is determined. This paper studies and optimizes the anti-buckling ability of the crane leg and finds out the influence of section shape and clearance on the anti-buckling ability of the crane leg, which provides a basis for the future design of the crane leg’s shape and reinforcement, and also lays a foundation for the subsequent research on structure and performance.
Analysis method
Linear eigenvalue buckling analysis
In order to obtain buckling condition and buckling load, linear eigenvalue buckling analysis is performed on the leg first. When the structure is in equilibrium, considering the influence of the axial force or the in-plane force on bending deformation, the structural equilibrium equation 33 is obtained according to the principle of potential energy stagnation.

Where

So there must be 33

Where the structural elastic stiffness matrix is known, the external load of the structure, that is, the required buckling load, is unknown, and the structural geometric stiffness matrix is unknown. To obtain the buckling load, suppose there is a set of loads

The method rewritten into eigenvalues 34 can be used to solve the bifurcation buckling load value and buckling mode when the structure is instability. The equation is as follows:

In the formula,
Geometric nonlinear buckling analysis
The main difference between geometric nonlinear analysis and linear buckling analysis is to consider the effect of large deformation on the structure stiffness matrix. The low-order buckling mode obtained by the linear eigenvalue method is introduced as the initial deformation of the structure, in order to investigate the effect of structural geometric defects on buckling. At this time, the stiffness matrix of the system becomes 35

Where,

In the calculation, the incremental load method is used to solve the problem. The load is divided into multiple load steps, and each load step is divided into multiple load sub-steps (incremental) and applied to the structure to solve iteratively.
Multi-island genetic optimization algorithm
Genetic algorithms are derived from biology and were originally used in the study of artificial intelligence. They are now widely used in the structural design process.36–41 It is a robust global optimization algorithm that does not require gradient information and does not easily fall into a local optimum. In addition, it is not constrained by the continuity of design variables and does not require a starting point at the beginning of the optimization process. This article studies the overall structure optimization of crane outriggers. In order to solve the global optimal value, a multi-island genetic algorithm is decided. In the multi-island genetic algorithm optimization, the population is divided into several sub-populations, so-called islands. Then, perform all normal genetic operations on each island separately, and then select individuals from each island to migrate to a different island. From one generation to the next, crossover, mutation, and migration operations are performed in order until the stopping criteria are met. The schematic diagram of the multi-island genetic algorithm is shown in Figure 2.

Multi-island genetic algorithm.
The multi-island genetic algorithm is more effective than the original genetic algorithm in preventing the optimization process from falling into a local optimum. Before running a multi-island genetic algorithm, you must assign values to many parameters, such as the number of islands, the number of generations, the crossover rate, mutation rate, and mobility.
Surrogate-based optimization framework
Finite element software requires a large amount of time to perform a sufficient number of analyses, which is the main bottleneck facing the current optimization process. This paper uses a surrogate-based optimization method instead of a direct multi-island genetic algorithm. First, a set of sampling points is obtained in the design variable space. Because this work has five design variables, the best Latin hypercube sampling (LHS)42,43 was implemented to determine the sampling points. Then use ANSYS to perform structural analysis on all sampling points and calculate the critical load values for all these points as the corresponding constraint parameters. Then, based on these parameters, a basic surrogate model is generated after data fitting to predict the critical load value in the entire design variable space. Use MIGA to operate according to the surrogate model during the optimization process. Once MIGA has obtained the best point in the surrogate model, an accurate finite element analysis of the corresponding design variables is performed through ANSYS. If the relative error between the critical load value predicted by the surrogate model and the exact finite element analysis is less than the threshold, the optimization process is considered complete. Otherwise, use the current optimization point as the new sampling point to update the surrogate model and perform the replacement-based optimization and replacement model update in turn until the relative error is less than the threshold. The optimization process is shown in Figure 3.

Flowchart of the optimization procedure based on the surrogate model. 44
One of the most critical steps in surrogate-based optimization is the construction of the surrogate model by values on the sampling points. Here, the radial basis function (RBF) model45,46 is adopted for interpolation and fitting of the surrogate model. With linear combinations of a radially symmetric function based on Euclidean distance, the RBF model can be mathematically expressed as 45

where x is the vector of the design variables,

where


Besides, another set of sample points is required to validate the credibility of the surrogate model before it can be used. Following the works by Wang et al.,47,48 we adopt the following error metrics, termed the percent root mean square error (%RMSE), percent average error (%AVGERR), and percent maximum error (%MAXERR), 48 which can be expressed as


where
Finite element analysis
Model description
With reference to the outrigger dimensions of a 1200 t crawler telescopic boom crane of a certain company, the outline height dimension H of the fixed leg part of the telescopic outrigger is limited to 1410 mm, and the width W is limited to 600 mm. 49 Five sections of different shapes were selected and numbered A–E, as shown in Figure 4. In the present work, a first-level fixed outrigger and a first-level removable outrigger are used as the research objects. The established comparison model omitted the stiffeners, partitions and other structures inside and outside the legs, and the welding area was modeled as a smooth shell. Other factors were removed, and only the bearing performance of the main structure of the legs with different cross-sections in the same layout space was compared and analyzed.

Cross-section shape of the outrigger.
Use SolidWorks software to draw various cross-section outrigger structural models, as shown in Figure 5.

Test structure model.
The material properties of the alloy steel used in this study are as follows: Young’s Modulus
Basic parameter values of outrigger structure.

Linear eigenvalue buckling analysis and geometric nonlinear buckling analysis
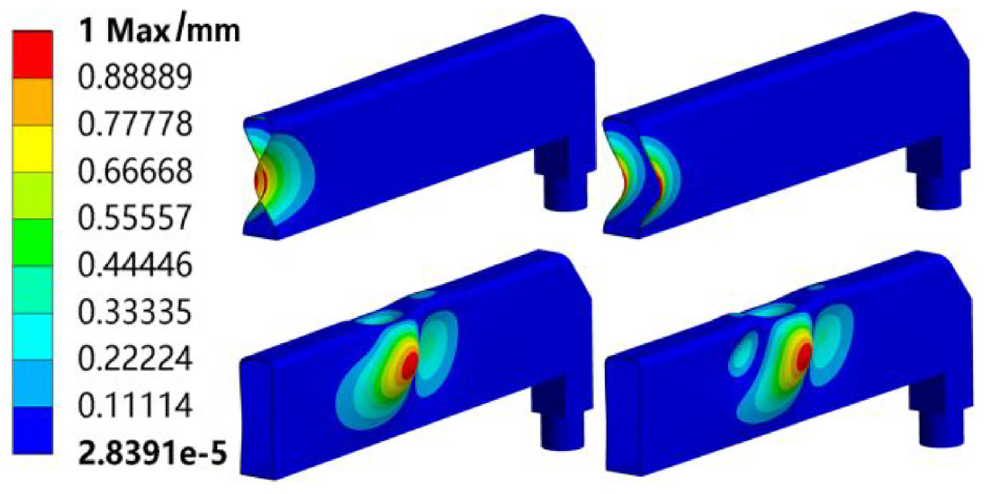
The static module and buckling module in ANSYS are used for linear and nonlinear buckling analysis of the structure. The linear eigenvalue buckling analysis is used to obtain the buckling mode and critical load, which provides a forced basis for the subsequent geometric nonlinear buckling analysis. The analysis does not distinguish the load step. Full displacement constraints are applied to the leftmost white part of the experimental model, and a unit force surface load is applied to the bottom rightmost support surface, as shown in Figure 5. In order to improve the accuracy of the simulation, the cell size was set as 20 mm. According to the static analysis, the default node of the solid cell was set as reserved, the default value of the association center was rough, the smoothness was medium, and the transition was fast. In order to reduce the computation, the maximum buckling was set as 1 mm, and the modes of each leg are shown in Figures 6 to 10.

1-4 order buckling mode of outrigger A.
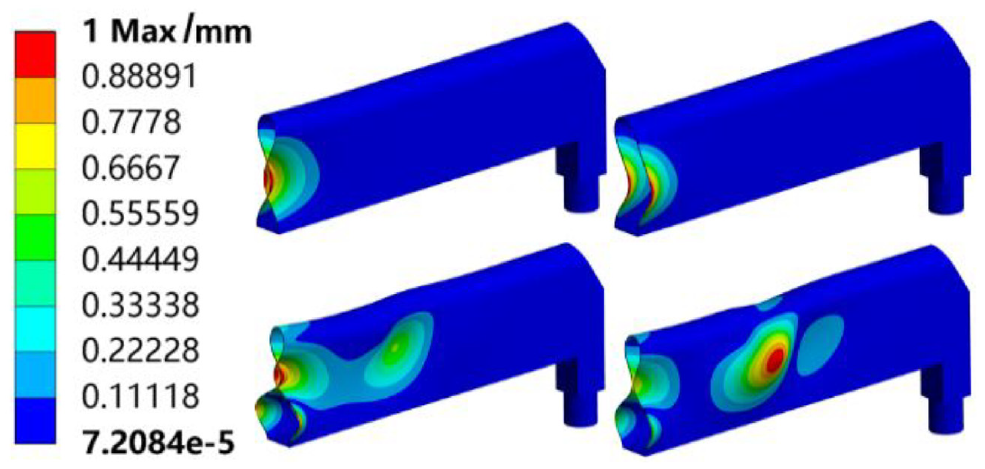
1-4 order buckling mode of outrigger B.
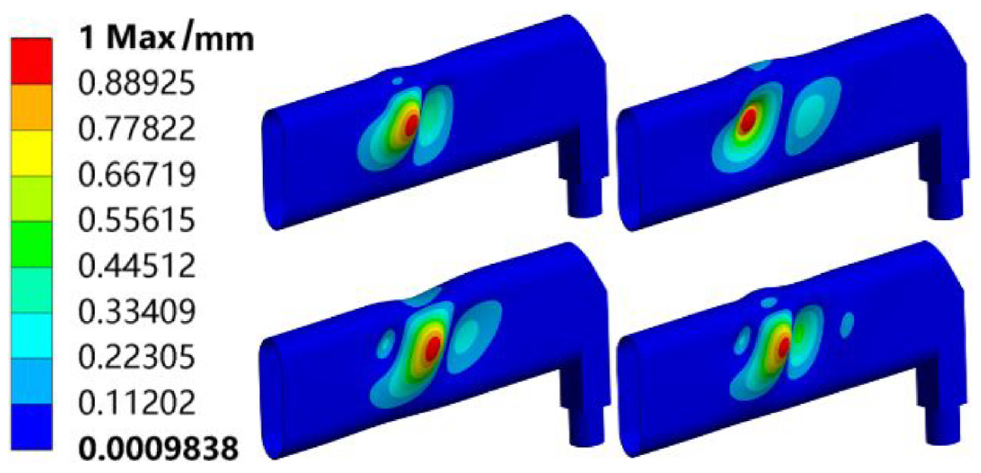
1-4 order buckling mode of outrigger C.

1-4 order buckling mode of outrigger D.
1-4 order buckling mode of outrigger E.
To obtain the buckling position of each outrigger and to optimize the design later, three paths 1, 2, and 3 are selected in the Workbench analysis setup to analyze the first-order buckling of each outrigger. Figure 11 is the path diagram of outrigger A. The path of the other legs are similar.

Paths 1, 2, and 3.
Divide path 1 into two segments, insert the first segment into 100 analysis points equally, plus two points of the beginning and the end, a total of 102 analysis points. Insert the second segment into 200 analysis points equally, plus two points of the beginning and the end, a total of 202 analysis points, but the end of the first segment and the beginning of the second segment are the same point, so there are 303 analysis points in path 1. Each analysis point is used as a step to approximate the continuous change of buckling. The result data of each step is imported into Origin software to generate the buckling situation of each leg along the path 1, as shown in Figure 12. The larger the buckling value in the figure, the more likely buckling is to occur. From the number of steps of buckling, it can be seen that the buckling of legs A, B, C, and D begins to occur in the middle rear part of the horizontal leg of path 1 and increases sharply near the opening in the last quarter of the horizontal leg. The deformation at the opening reaches the maximum. The buckling of the outrigger E occurs in the first three-quarters of the vertical leg and the horizontal leg, with the middle and the middle back of the horizontal leg deforming most.

The buckling of each leg along path 1.
Divide path 2 into three segments, insert the first segment into 100 analysis points equally, insert the second segment into 47 analysis points equally, insert the third segment into 200 analysis points equally, a total of 351 analysis points, and the buckling of each leg along path 2 is shown in Figure 13. According to the number of steps of buckling, the buckling of legs A and B is similar. The buckling mainly occurs in the middle of the horizontal leg and the back fifth of the horizontal leg. The deformation at the opening of the leg reaches the maximum. Compared with outriggers A and B, outriggers C and D are similar. In addition to the buckling of A and B, these two outriggers have smaller deformations in the vertical outriggers and joints. The buckling of Outrigger E along path 2 is basically opposite to that of other legs. The maximum deformation is at the beginning of the vertical leg, and the minimum is at the end of the horizontal leg. The overall buckling situation shows a downward trend. The deformation in the middle and three quarters has increased.

The buckling of each leg along path 2.
Divide path 3 into two segments, insert the first segment into 47 analysis points equally, insert the second segment into 200 analysis points equally, a total of 250 analysis points, and the buckling of each leg along path 3 is shown in Figure 14. According to the number of steps of buckling, the buckling of legs A and B is similar. The buckling begins in the middle of the horizontal leg and ends at the back of the horizontal leg, and the deformation is small. Outriggers C and D are similar to outriggers A and B, except that they also have less deformation in the vertical legs. The deformation of the outrigger E reaches the maximum value at the beginning of the vertical outrigger and reaches the minimum value at the end of the horizontal outrigger. The amount of deformation has been decreasing and is relatively large.
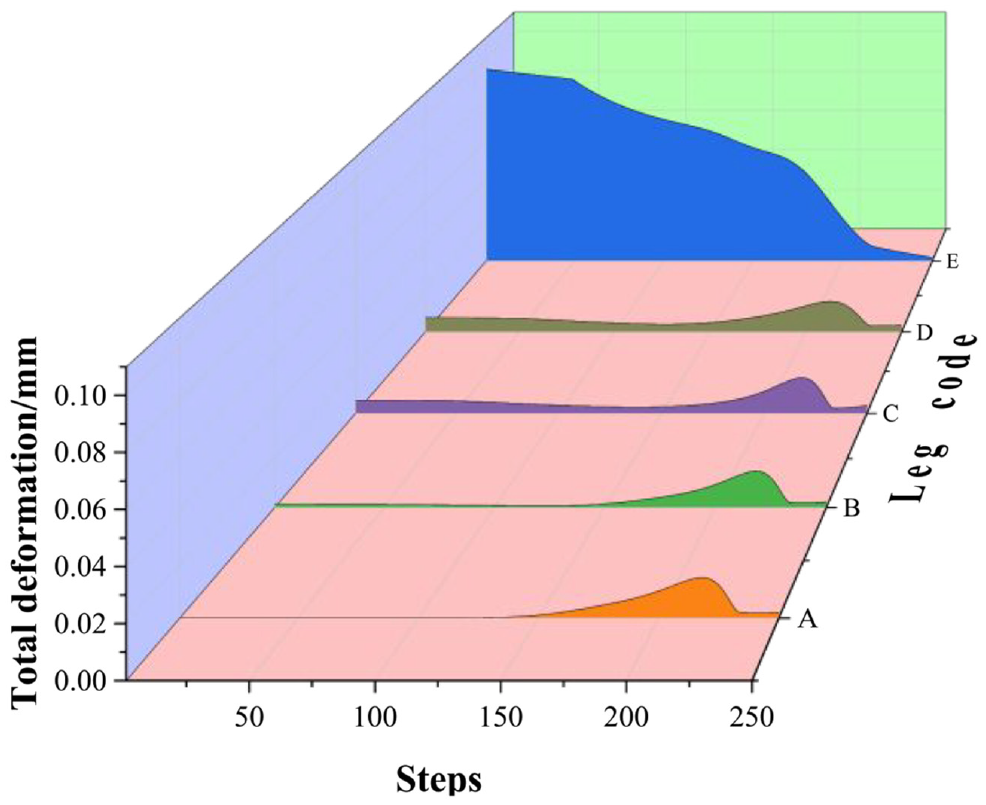
The buckling of each leg along path 3.
Based on the analysis of the three paths, it can be determined that the first-order buckling of outriggers A, B, C, and D mainly occurs on the sides of the horizontal legs and the upper top plate near the opening, and the buckling at the opening is the most obvious and the lower plate. The buckling deformation is relatively negligible. The first-order buckling of outrigger E mainly occurs in the middle of the plates on both sides of the horizontal outrigger and the back part. The maximum deformation is smaller than that of the other outriggers, but the upper and lower plates of the outrigger E and the vertical outrigger are almost. There is buckling in the whole section, and especially the vertical legs are more flexed than other legs.
The critical load of the 1–4th order of each leg is shown in Figure 15. It can be seen in the figure that the critical load of each order of the buckling of each leg is greater than 6000 kN, and the process of changing the cross-sectional shape from rectangular to arc in the critical load of each order of buckling is increasing. In the first two orders of buckling, Outrigger D and Outrigger E improve the critical load obviously, and the effect of Outrigger E is relatively more obvious. In the latter two orders, Outrigger C, D, and E increase the critical load obviously. The lifting effect of outrigger C and outrigger D is similar, and the lifting effect of outrigger E is more obvious.

Critical loads of various modes.
In the geometric nonlinear buckling analysis, two load steps are applied to the supporting leg in the buckling module. The first load step applies the acceleration of gravity g (

Stress and strain cloud diagram of each leg under 300 t load: (a) outrigger A, (b) outrigger B, (c) outrigger C, (d) outrigger D, and (e) outrigger E.
The maximum stress and strain value of each leg under a load of 300 t are shown in Figure 17. It can be seen that under the same load, the stress generated by outriggers A and B is significantly higher than the stress generated by outriggers C, D, and E, indicating that the curved section structure has a certain advantage on stress concentration. Among them, the maximum stress of Outrigger C and Outrigger E is basically the same. Still, there is no obvious high-stress area at the opening of the Outrigger E, but compared with the Outrigger D, it has a high-stress area at the upper roof plate.

The maximum stress value of each leg under 300 t load.
As can be seen from Figure 16, the strain concentration of each leg under 300 t load is also the stress concentration. In order to facilitate the subsequent optimization design, the stress variation of each leg along each path under 300 t load is calculated by taking the stress as an example. As shown in Figure 18, it can be seen that stress variation on path 2 and path 3 is significantly greater than that on path 1. The stress change along path 1 mainly occurs on the horizontal legs, and there is no obvious sudden increase and decrease in the stress area and no obvious stress concentration. Along path 2, the stress change starts from the horizontal leg and continues to the opening, and there is stress concentration near and at the opening. Along path 3, the stress change starts from the horizontal leg and continues to the opening, and there is an obvious stress concentration from the second half to the opening.

Strain along different paths under 300 t load.
Nonlinear buckling critical load analysis of each outrigger, the results are shown in Table 2 below.
Nonlinear critical loads of each leg.
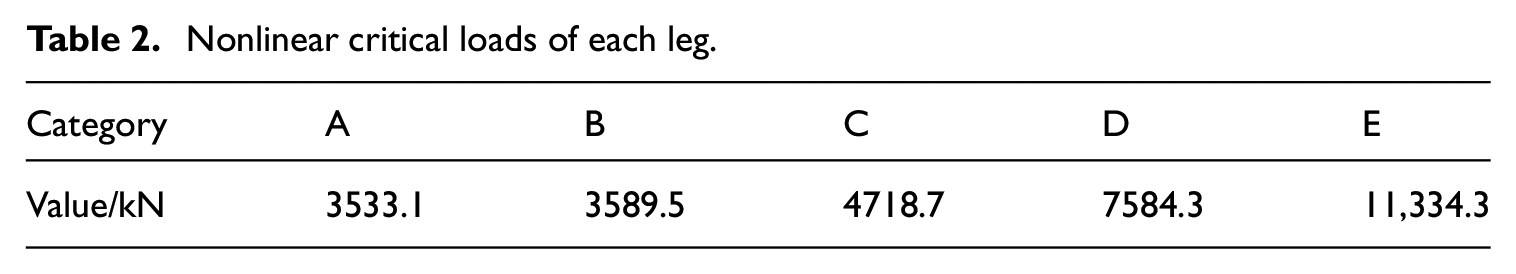
From the results of the above two buckling analyses, it can be seen that in terms of anti-buckling, the performance of outrigger A is the worst, the performance of outriggers B and C is slightly improved than that of outrigger A, the performance of outrigger D is in between.
The performance of E is the best, but its buckling range is large. According to the critical load, each leg can be used within the working range. In terms of stress conditions, outrigger D performs best, outrigger C and E are slightly worse than outrigger D, outrigger B performs in the middle, and outrigger A performs the worst. Based on the results of the two buckling analyses, the outrigger D is selected for further study. The agent-based multi-island genetic algorithm will be used to optimize the structure of the outrigger D.
Optimal design of curved section outriggers
Outrigger with longitudinal stiffeners
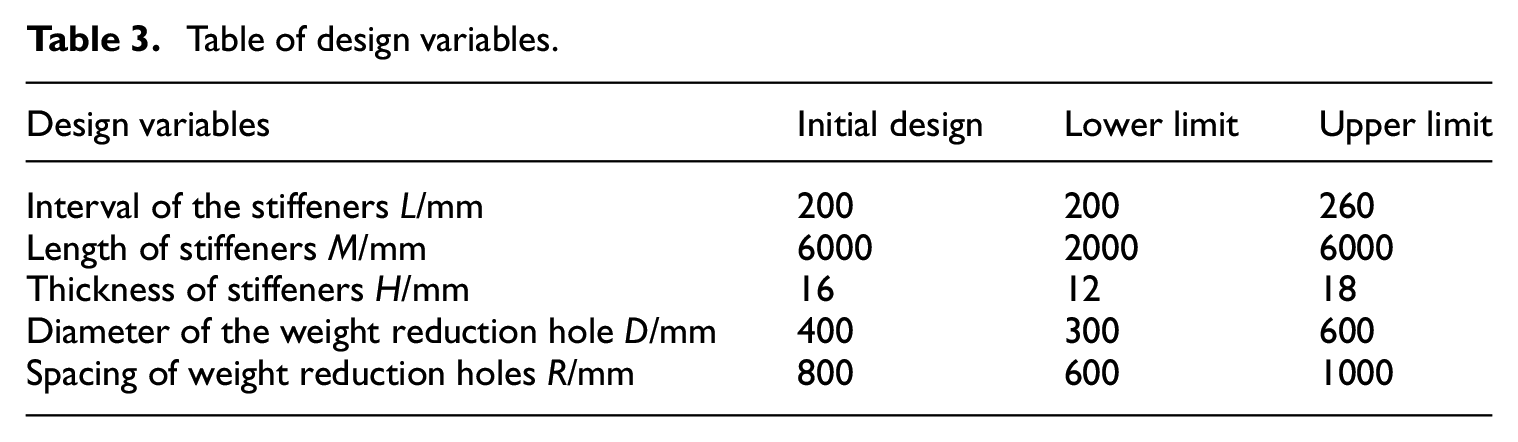
In order to improve the buckling resistance and carrying capacity of the outriggers, it is a common strengthening method to add welded longitudinal stiffeners inside the outriggers. According to the analysis of the buckling and strain of the three paths in section 3, the ribs should be placed inside the horizontal legs, as shown in Figure 19. The optimized variables include the interval L of the stiffeners, the length M, and the thickness H. And the diameter D of the weight reduction holes on the stiffeners, and the distance R between the weight reduction holes. Values of optimization variables are shown in Table 3.

Outrigger with longitudinal stiffeners.
Table of design variables.
In Workbench, for linear eigenvalue buckling analysis and geometric nonlinear buckling analysis, LHS experimental design method was adopted to generate 160 groups of sampling points in the upper and lower limits of design variables and the critical loads and masses of all sampling points were calculated. Then, the hypersurface was constructed as a basic alternative model through data fitting.
At the same time, an additional group of 18 test samples was obtained to evaluate the credibility of the model, and the goodness of fit of the proxy model was shown in Figure 20.

The goodness of fit based on: (a) linear eigenvalue buckling analysis and (b) geometrically nonlinear buckling analysis.
As can be seen from Figure 20, the fitting of the proxy model established based on linear eigenvalue buckling analysis is perfect, and the verification points appear near the proxy model accurately, and the proxy model is available. In contrast, the proxy model based on geometrically nonlinear buckling analysis has a relatively poor-fitting condition, and the deformation parameters of a few verification points are slightly away from the proxy model, but the overall fitting condition is also good, and the proxy model is available.
Then, based on the two proxy models, the multi-island genetic algorithm was optimized respectively, and the parameters adopted in the algorithm were listed in Table 4.
Parameters values adopted in the MIGA.

Proxy-based optimization is performed several times in turn until the values read from the proxy model converge. The convergence optimization process is shown in Figure 21, and the optimization results of the two analyses are listed in Table 5.

Optimization progress based on: (a) linear eigenvalue buckling analysis and (b) geometrically nonlinear buckling analysis.
Table of optimization results.

In the optimization framework based on linear eigenvalue buckling, the optimal design critical buckling load from the alternative model is 10,900 kN after 20 generations of generation in the multi-island genetic algorithm. Compared with the leg without stiffeners, the critical buckling load is increased by 12%, and the optimal mass of 8178 kg is obtained. The initial mass of the leg is 5.7% lower than that of the longitudinal stiffened plate. The optimization process is shown in Figure 21(a), and the optimization results are shown in Table 5. The optimization process based on geometric nonlinear buckling analysis is similar to that based on linear eigenvalue buckling analysis, with a slightly slower convergence rate in terms of model quality than the latter, as shown in Figure 21(b). After optimization, the critical buckling load of the structure is increased by 63.5%, and the weight is reduced by 5.8%, and the stress concentration is alleviated. The optimization results are shown in Table 5.
Outrigger with transverse stiffeners
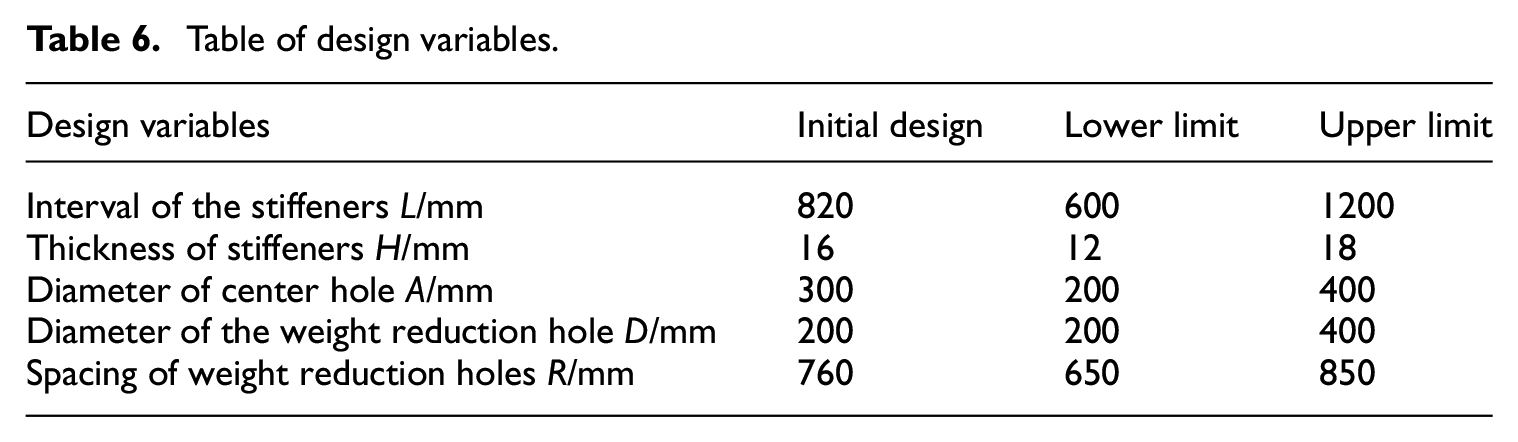
In order to improve the buckling resistance and carrying capacity of the outriggers, the addition of welded transverse stiffeners inside the outriggers has become a strengthening method that has been adopted in recent years. As shown in Figure 22, the optimized variables include parameters such as the interval L and thickness of the stiffeners H and the diameter D of the weight reduction hole on the stiffeners. Values of optimization variables are shown in Table 6.
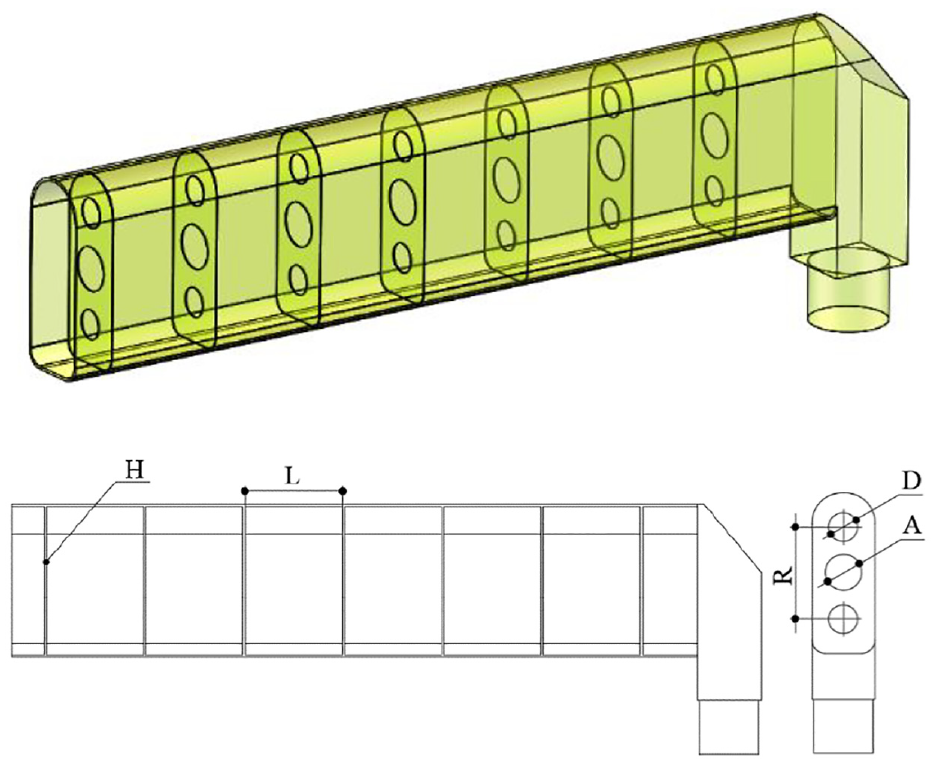
Outrigger with transverse stiffeners.
Table of design variables.
The optimization process of the transverse stiffener structure is similar to the optimization process of the longitudinal stiffener structure. The LHS experimental design method was used to generate 160 groups of sampling points, and the critical load and mass of the sampling points were calculated. Then the hypersurface was constructed as a basic alternative model through data fitting. At the same time, an additional group of 18 test samples was obtained to evaluate the credibility of the model, and the goodness of fit of the proxy model was shown in Figure 23.
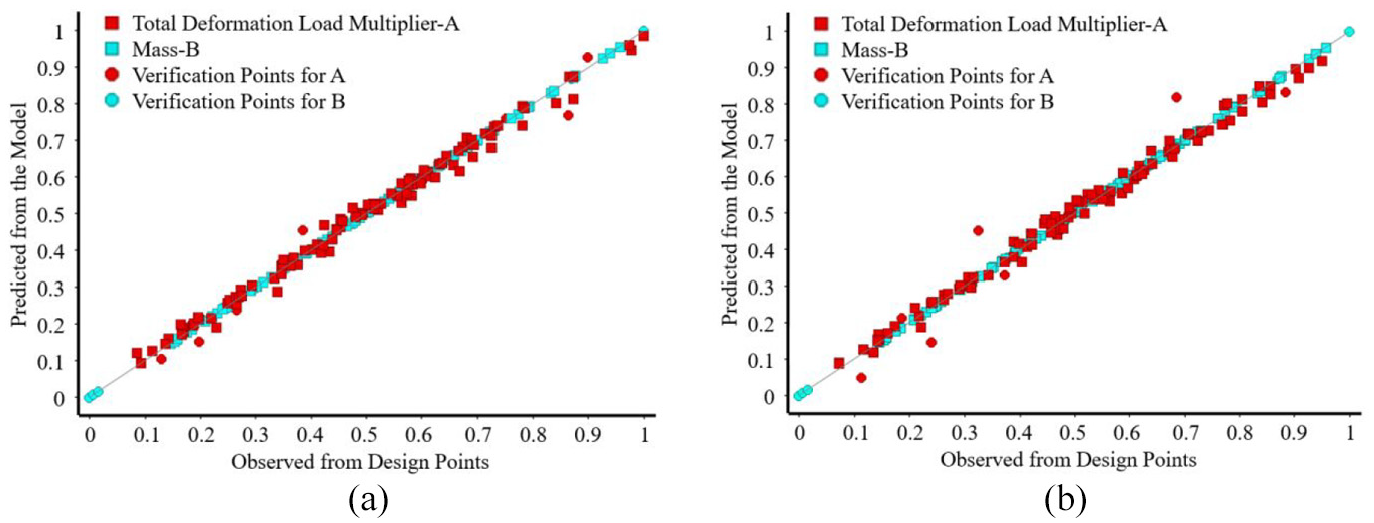
The goodness of fit based on: (a) linear eigenvalue buckling analysis and (b) geometrically nonlinear buckling analysis.
As can be seen from Figure 23, the fitting of the proxy model established by linear eigenvalue buckling analysis and geometric nonlinear buckling analysis is similar, and the verification point almost accurately appears near the proxy model. Both proxy models can be used.
Then, based on the two proxy models, the multi-island genetic algorithm was optimized respectively, and the parameters used in the algorithm were shown in Table 4. Proxy-based optimization is performed several times in turn until the values read from the proxy model converge. The convergence optimization process is shown in Figure 24, and the optimization results of the two analyses are listed in Table 7.

Optimization progress based on: (a) linear eigenvalue buckling analysis and (b) geometrically nonlinear buckling analysis.
Table of optimization results.

In the optimization framework based on linear eigenvalue buckling, after 20 iterations, the critical buckling load obtained from the alternative model is 19,731 kN, which is 102.7% higher than that of the leg without stiffeners, and the optimal mass is obtained at 6885 kg, which is 0.9% lower than the initial mass of the leg with transverse stiffeners. The optimization process is shown in Figure 24(a), and the optimization results are shown in Table 7. The optimization process based on geometric nonlinear buckling analysis is similar to that based on linear eigenvalue buckling analysis, as shown in Figure 24(b). After optimization, the critical buckling load of the structure is increased by 138.3%, the weight is reduced by 0.35%, and the stress concentration is alleviated. The optimization results are shown in Table 7.
Analysis and optimization of outrigger clearance
In addition to the provision of reinforcing ribs, this article also made a comparative analysis of the different situations of the gap between the fixed and movable legs to improve structural stability. The value of the gap cannot be too large or too small. The excessive gap will cause vibration during extension and large deformation during support. If it is too small, it may cause jamming or guide rail wear during extension, but it can play a protective role during support. Considering the length and structure of the movable and fixed legs, this paper selects a minimum gap of 10 mm, a maximum gap of 60 mm, and 11 groups of the gap analysis with 5 mm as the difference. The stress results are shown in Figure 25.

The stress of each gap value: (a) 10 mm, (b) 15 mm, (c) 20 mm, (d) 25 mm, (e) 30 mm, (f) 35 mm, (g) 40 mm, (h) 45 mm, (i) 50 mm, (j) 55 mm, and (k) 60 mm.
Making the maximum stress into a scatterplot, as shown in Figure 26, it can be seen that as the gap increases, the maximum stress shows an increasing trend. The nonlinear higher-order function is used to fit the change curve of the maximum stress.

Maximum stress for each gap value.
It can be seen that the higher-order function decreases in the interval of (10,15), and increases in the interval of (15,40), and decreases in the interval of (40,50), and increases in the interval of (50,60), and the degree of increase increases, the degree of decrease decreases. That is to say, with the increase of the gap value, the more obvious the phenomenon of stress concentration is, and the greater the stress value is. Therefore, the structural performance with a smaller gap value is better, but the gap value cannot be too small. If the gap value is too small, the phenomenon of high-stress concentration will occur due to friction and other problems, just like the 10 mm case in the figure. According to the results of the high-order fitting curve in Figure 26, in order to reduce the maximum stress value and reduce the effect of stress concentration on the structure without affecting the movement of the movable leg relative to the fixed leg and protecting the sliding guide, the gap value is selected as 14 mm.
Discussion
Outrigger is a kind of thin-walled parts, the upper plate is compressed while the lower plate is tensioned, so buckling is the main failure mode. Therefore, the linear and nonlinear buckling analysis of outrigger with different cross-section shape is carried out, in order to obtain the best outrigger cross-section shape, buckling situation, and critical load. From the analysis results, it can be seen that the outrigger with D-section shape has better performance. Compared with the single static analysis or modal analysis, the buckling analysis method is more targeted and the results are more clear.
Based on the results of buckling analysis, the outrigger is optimized in terms of stiffener and outrigger clearance. Among them, the optimization of stiffeners is divided into longitudinal and transverse. Each structural form pursues to further reduce the weight of the structure on the basis of improving the buckling ultimate bearing capacity. The results show that the outrigger of transverse stiffened plate structure can improve the ultimate bearing capacity more obviously, improve the buckling resistance of the structure, and ensure the safety performance. All of them are of lower quality. In the specific operation, the agent-based multi-island genetic algorithm is used to optimize the size parameters of the two structures linearly and nonlinearly. LHS sampling method is used for experimental design, and the common central composite design method and optimal space filling method are used Compared with design method, the samples extracted by this method are more random, and can fill every corner of the design space, so the error is smaller. Moreover, LHS sampling is a multi-dimensional stratified sampling method, and its sampling flexibility and stratified independence are more suitable for the multi parameter sampling of this study. Using the experimental results to establish the surrogate model and judge the accuracy of the model, the multi-island genetic algorithm is used to find the optimal solution in the surrogate model. Compared with the traditional genetic algorithm, this method can save more time on the premise of ensuring the accuracy.
In the gap analysis of the structure, the high-order function is used to fit the analysis results. According to the fitting curve, it can be seen that the gap value and stress value show a spiral relationship. With the increase of the gap value, the proportion of stress increase is increasing. Choosing the appropriate small gap value is conducive to reducing the phenomenon of stress concentration, so as to improve the safety and life of the whole structure.
In the whole optimization process, the proxy model has greatly reduced the calculation cost, but the calculation time of the finite element analysis is still the biggest bottleneck in the whole optimization process. In order to perform the optimization with high efficiency, a better algorithm and a more advanced computer should be selected. The final optimization model is shown in Figure 27.

Final optimization model.
Conclusions
In order to ensure the safety and stability of crane, it is very important to find the optimal design of outrigger and stiffener structure. In this paper, five kinds of outrigger models with different cross-section shapes are established by using SolidWorks software, and the linear and nonlinear buckling analysis of outriggers with different cross-section shapes is carried out. The simulation results show that there is a certain gap in the bearing capacity of the legs with different cross-section shapes. Comparing the performance of each leg, it can be seen that the anti buckling performance and ultimate bearing capacity of the D-section leg and the E-section leg are better, but the E-section leg has a larger buckling range, and the D-section leg is better than the traditional rectangular leg in terms of stress and strain. It is more suitable for heavy load environment, and the D-section leg is selected for subsequent optimization.
Then, longitudinal and transverse stiffeners are used to optimize the D-section leg. For the longitudinal stiffened plate strengthened structure, the LHS experimental design method is used to establish linear and non-linear surrogate models, and to evaluate the reliability of the model. The multi-island genetic algorithm is used to find the optimal value in the agent model. The optimization results show that the critical loads under linear buckling and nonlinear buckling are increased by 12% and 63.5%, respectively, and the weight reduction is 5.7% and 5.8%. The optimization process of the transverse stiffened structure is similar to that of the longitudinal stiffened structure. The optimization results show that the critical load of the transverse stiffened structure under linear and nonlinear buckling is increased by 102.7% and 138.3%, and the weight reduction is 0.9% and 0.35%. Compared with the longitudinal stiffened plate structure, the outrigger with transverse stiffened plate structure has more significant effect in improving the ultimate bearing capacity and reducing the weight of outrigger.
Finally, the paper analyzes the influence of the outrigger clearance on the bearing capacity, selects several discrete clearance values for analysis, and makes the results into a scatter diagram, and uses the high-order equation to fit the scatter diagram. According to the fitting curve, it can be seen that under the premise of not affecting the normal movement of the outrigger, the smaller the clearance is, the smaller the stress of the structure is, and the better the bearing capacity is. Therefore, in order to improve the outrigger performance, the outrigger clearance value is selected as 14 mm.
With the construction and development of various heavy industrial projects, the load requirements of the outriggers of heavy lifting machinery are also getting higher and higher. New structural design methods and more efficient optimization analysis methods will be a direction for continued research in the future.
Footnotes
Declaration of conflicting interests
The author(s) declared no potential conflicts of interest with respect to the research, authorship, and/or publication of this article.
Funding
The author(s) disclosed receipt of the following financial support for the research, authorship, and/or publication of this article: This work was supported by the National Natural Science Foundation of China, grant number 51674155; the Key R&D Plan of Shandong Province, China, grant number 2019GGX104048; the Key R&D plan of Shandong Province, China, grant number 2019SDZY01; and the Ministry of Education of China, grant number IRT_16R45.