
Abstract
Emergency management is conceptualized as a complex, multi-objective optimization problem related to facility location. However, little research has been performed on the horizontal transportation of emergency logistics centres. This study makes contributions to the multi-objective locating abrupt disaster emergency logistics centres model with the smallest total cost and the largest customer satisfaction. The IABC algorithm is proposed in this paper to solve the multi-objective emergency logistics centres locating problem. IABC algorithm can effectively calculate the optimal location of abrupt disaster emergency logistics centres and the demand for relief materials, and it can solve the rescue time satisfaction for different rescue sites. (1) IABC has better global search capabilities to avoid premature convergence and provide a faster convergence speed, and it has optimal solution accuracy, solution diversity and robustness. (2) From the three optimal objective function values obtained, the optimal objective function values obtained by IABC algorithm are obviously better than ABC and GABC algorithms. (3) From the convergence curves of three objective functions the global search ability and the stability of IABC algorithm are better than those of ABC and GABC algorithm. The improved ABC algorithm has proven to be effective and feasible. However, emergency relief logistics systems are very complex and involve many factors, the proposed model needs to be refined further in the future.
Keywords
Introduction
In the recent past, frequent natural disasters have taken place throughout the world,1,2 and such events seem to be increasing.3,4 According to the International Federation of Red Cross and Red Crescent Societies, disaster is defined as an abrupt, calamitous event that not only seriously disrupts a community or society’s operations but also causes unforeseen human, material and economic or environmental losses beyond the community or society’s capacity to address using its own existing resources.5,6 In addition, an emergency disaster refers to a natural disaster, accident, public health event or security event that takes place suddenly and causes or that has the potential to cause serious harm to society. Such disasters, which can occur around the world at any time, have not only brought tremendous suffering to people’s lives and property but have also affected the stability of society.7,8 Therefore, emergency management is becoming a renewed focus. Currently, China is at a critical stage of socioeconomic development, but the country is facing the frequent occurrence of emergencies with new characteristics.
In general, emergency response and rescue is a key phase. Emergency management is a discipline that allows society to effectively cope with or avoid potentially extreme events that can possibly cause extensive damage by applying technology, planning and management; moreover, it is often conceptualized as a complex, multi-objective optimization problem related to facility location.9−13 In the case of abrupt natural disasters, the scientific and effective allocation of emergency resources is absolutely essential to control the impacts. The survey mentioned in the literature review focuses on the relief network used to meet those in needs. The decision-making process in a relief network can be aided by several types of models, but it is most appropriate for multi-criteria models to be applied for disaster relief networks because they address comprehensive decision issues. In addition, DEMATEL, 14 AHP-TOPSIS and fuzzy method can be used to solve such models. 15
In these representative contributions mentioned above, most scholars focused on regular logistic networks,16,17 and the existing studies mostly concentrate on minimizing relief costs and ignore the importance of time to emergency relief logistics. 18 As a result, relief resources may not be delivered promptly. Moreover, the satisfaction of the rescue site with regard to the relief activities is not considered, and some factors are ignored in the selection of the location of emergency logistics centres. In addition, little research has been performed on the horizontal transportation of emergency logistics centres. Hence, this paper considers the time factor in emergency logistics. When establishing a model for the selection of the location of emergency relief logistics centres, the satisfaction of different rescue sites with regard to rescue time is taken into consideration. This study therefore makes contributions to the relief logistics literature by offering considerations of the time factor, transportation costs and relief satisfaction in the distribution of resources by a relief network.
In the following sections, this paper provides a description of the problem and presents a mathematical model. It also develops ABC algorithms to solve such a model before applying the ABC model to a case study in the section 3. Section 4 of this paper reports the numerical results, and the results are discussed in section 5. Finally, this paper draws conclusions and provides directions for future work.
Model constructions
Problem formulation
This paper focuses on an abrupt disaster emergency relief logistics model based on a three-layer logistics network consisting of a relief resource supply centre, a relief logistics centre, and a rescue site (Figure 1).
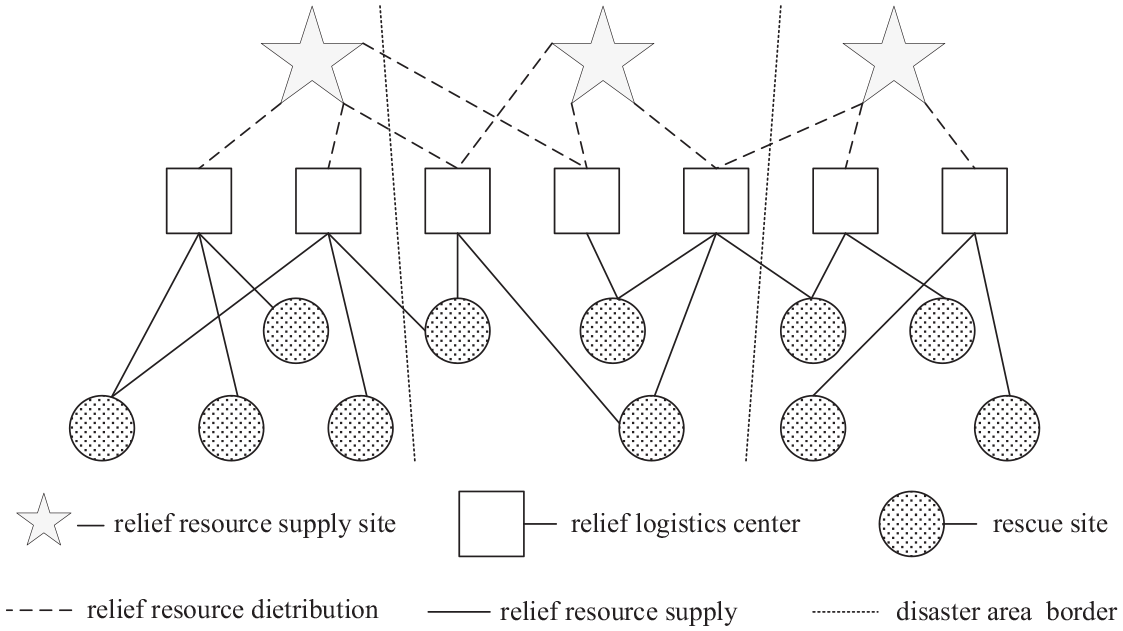
Abrupt disaster emergency relief logistics model.
In the case of an abrupt disaster, all relief supplies come from the relief resource supply centre, where relief resources are collected for distribution at any time. The relief logistics centre is the link between the relief resource supply centre and the rescue site. In addition to allocating resources to the rescue site, it can distribute resources to other logistics centres to ensure that relief supplies are deployed to rescue sites as needed and as soon as possible. Choosing an appropriate site for the relief logistics centre is a prerequisite to ensuring optimal emergency relief performance and satisfaction.
Model assumptions
The cargo demand and geographic location of each rescue sites are known, and the distance between rescue sites is calculated as a straight-line distance.
The relief resource supply centre can supply all the relief resources to meet the needs of the rescue sites.
There is only one type and sufficient number of vehicles in the relief resource supply centre, that is, the parking lot, which can certainly meet the distribution needs.
The total weight of the goods delivered by the vehicle at one time shall not exceed the maximum load capacity of the vehicle.
The goods have been prepared for loading before delivery, there is no waiting in line after the goods arrive, and the relief time is known.
All vehicles depart from the distribution centre and must return to the yard after completing the distribution task.
Each customer’s cargo needs must be met and can only be served by one car once.
The timeline of the abrupt disaster emergency is 12 h. Relief vehicles do not necessarily arrive within the time window, but they must be punished if they arrive outside the time window. The degree of punishment is proportional to the length of the early or late arrival.
Rescue time satisfaction
The rescue time determines whether the affected people can be rescued. Hence, the rescue site has high demand for rescue time.19−21 The sooner the relief supplies are delivered to the rescue site, the higher the rescue time satisfaction will be. Introducing the rescue time satisfaction function to the relief logistics centre selection model is designed to maximize the rescue time satisfaction. Assume the rescue time satisfaction is in the range [0, 1]. Let

where
Notations
I: the set of relief resource supply centres;
J: the set of relief logistics centres;
K: the set of a type of relief supplies;
N: the set of rescue sites;
T: the set of rescue times;
ajn: the distribution time for the relief supplies;
D k nt : the demand of the n th rescue site for the k th type of relief supplies;
G k t : the capacity of the relief supply centre to provide the k th type of relief supplies;
Vj: the capacity of the j th relief logistics centre;
Fj: the fixed cost associated with the construction of the j th logistics centre;
wij: the time needed for the supplies in the i th supply centre to be transported to the j th logistics centre;
zjn: the time needed for the supplies in the j th logistics centre to be transported to the n th rescue site;
M: a sufficiently large number;
Yj: a binary variable. If Yj = 1, then logistics centre j is retained; if Yj = 0, then logistics centre j is not retained;
Xn: a binary variable. If Xn = 1, the j th logistics centre distributes the relief supplies to the n th rescue site; if Xn = 0, the j th logistics centre does not distribute the relief supplies to the n th rescue site;
Construction of the model
Among the above comprehensive considerations, the multi-objective locating abrupt disaster emergency logistics centres model with the smallest total cost and the largest customer satisfaction is constructed as follows:


s.t.


Equation (2) is the first objective function, which means that the total fixed cost is minimized with time window constraints.
Equation (3) is the second objective function, which represents the minimization of the total relief cost with time window constraints, including transportation variable costs, scheduling costs and penalties for vehicles arriving early or late.
Equation (4) is the third objective function, which represents the maximization of the customer satisfaction with time window constraints.
Constraint (5) means that the rescue site’s need for relief supplies can be met by the logistics centre.
Constraint (6) means that the quantity of relief resources allocated by the relief supply centre is within its capacity.
Constraint (7) means that the quantity of relief resources allocated by the logistics centre to the rescue site is within its capacity.
Constraint (8) means that the relief supplies horizontally scheduled for delivery between logistics centres are delivered to the rescue site.
Constraints (9) and (10) mean that all the resources in the logistics centres are distributed.
Constraint (11) refers to the satisfaction of the rescue site with the rescue time.
Constraint (12) means that a delay in the delivery of relief supplies from the logistics centres can be tolerated by the rescue site.
Constraint (13) is binary variables.
Constraint (14) means that that each variable must meet the non-negative condition and the range for each parameter.
Improved ABC algorithm method
Process of artificial bee colony algorithm
The artificial bee colony (ABC) algorithm can be divided into four phases: initialization phase, employed bees phase, onlooker bees phase and reconnaissance bees phase.22−25 When the initialization phase is complete, the algorithm continues to cycle through the last three phases until the end condition is satisfied, the algorithm is terminated, and the optimal solution output is found.
(1) Bee colony initialization
The ABC algorithm parameters mainly include: the size of the bee colony (SN), the ratio of search bees (ratio), the maximum number of searches for nectar sources (max FNS), the maximum continuous update failure times (limit), and the maximum number of iterations (max Gen).26,27
Presume that

A greedy selection will be used once a new candidate solution
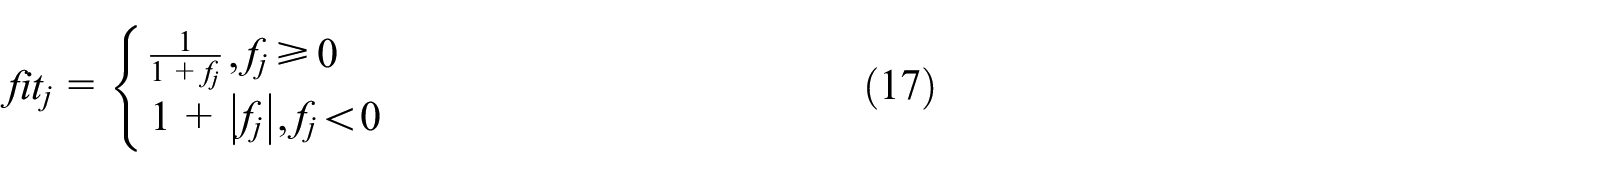
(2) Determine the selection probability and fitness value
The selection probability and fitness of each food source are calculated and ranked according to the fitness function:

(3) Employed bees’ and onlooker bees’ searches
The neighbourhood search formula for employed bees and onlooker bees is:

In this equation,
(4) Evaluate and rank the suitability of all bees for food sources
(5) End
Improved ABC algorithm
This chapter proposes a differential evolution search strategy based on a current optimal solution with the aim of improving the weak local search ability, slow convergence speed and the fact that it easy for the original ABC algorithm to fall into a local optimum.28,29 A differential evolution algorithm is a stochastic model that simulates biological evolution. Through repeated iterations, individuals who adapt to the environment are retained, and the search process is guided towards the optimal solution. The differential evolution algorithm has good global convergence performance and strong robustness, and the core step in the evolution process is differential variation. The methods are as follows:

Where
In the original artificial bee colony algorithm, the leader bee and the following bee adopt the same search strategy. It can be known from formula (15) that the search strategy has better global search capability when ignoring the local search performance of the algorithm. For this reason, Zhu and Kwong 5 introduced the current optimal solution and proposed a new search method:

where
To further improve the global search ability of the artificial bee colony algorithm and increase the diversity of the population, we introduce the idea of variation into the differential evolution algorithm in the search strategy, namely:


where
Equation (22) shows that the differential variation factor
The flowchart of IABC is shown in Figure 2.

Flowchart of IABC.
Performance verification of IABC
Introduction to test functions
The optimization performance of the proposed IABC algorithm is tested compared with the performance of ABC and GABC algorithm. Three classic algorithm performance test functions are selected, namely Sphere function, Sum Squares function and Rosenbrock function. Among them, Sphere function is a unimodal separable function, which is characterized by only one extreme point and easier for optimization algorithm to find the optimal solution in this test function. Sum Squares function and Rosenbrock function have the characteristics of multiple extreme values to make the algorithm solution fall into the local optimum and the escape ability of the local optimum solution of the algorithm is required to be higher. The selected test functions and their basic properties are shown in Table 1.
Expressions, search spaces and optimal values of the three test functions.

Setting of test parameters
In view of different properties and characteristics of each test function above, necessary settings are made for the parameters involved in the algorithms in the test of ABC algorithm, GABC algorithm and IABC algorithm as follows:
SN = 100, NP = 50, MaxCycle = 1000, limit = 200, and the number of hired bees and follower bees are half of the population respectively. These parameters are commonly used by the three algorithms.
The parameters α, β and γ are used independently by IABC algorithm.
Innovation of IABC
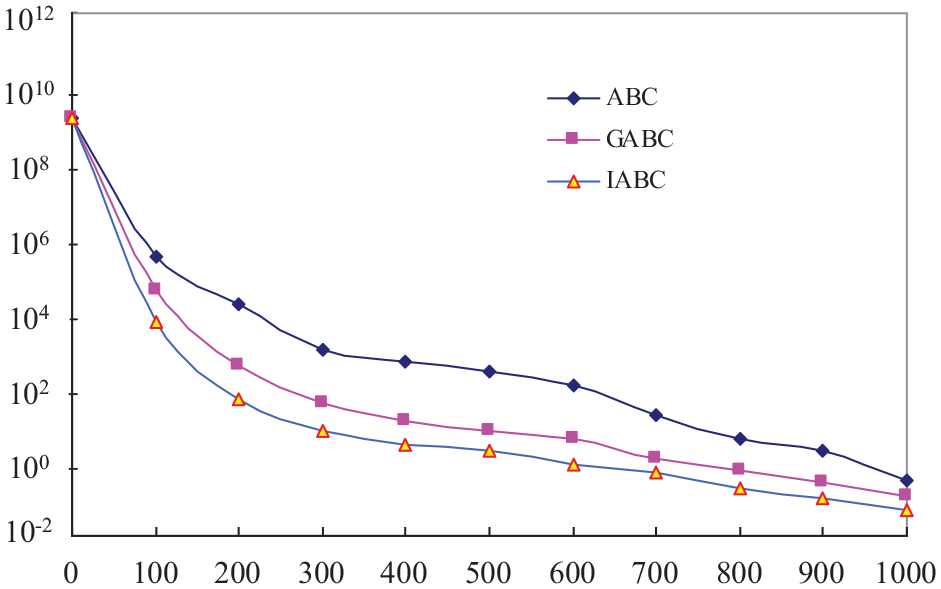
This article uses MATLAB 2016a software to program and test algorithms, and 50 comparison experiments on each of the three test functions are conducted. The test results are shown in Figures 3−5. The above experimental results show that IABC algorithm has certain advantages compared with ABC and GABC in terms of convergence speed, solution accuracy, stability, robustness and other evaluation aspects, which show that the performance of IABC algorithm in this paper is generally better than ABC algorithm and GABC algorithm.

Evolution curves of sphere.

Evolution curves of sum squares.
Evolution curves of Rosenbrock.
Figures 3−5 shows that the IABC algorithm has faster convergence speed and higher search accuracy than ABC algorithm and GABC algorithm. The three algorithms have faster convergence speeds in the initial stage of iterations. However, due to their own characteristics, the convergence speed of the algorithms slows down and is easily trapped in the local optimum in the later iterations. The IABC algorithm introduces the idea of differential variation, which makes it jump out of the local optimal value as much as possible and improves the convergence speed of the algorithm. Thus, the IABC algorithm improves the algorithm’s optimization accuracy. The IABC algorithm first uses a differential mutation factor to perform a global search in the initial stage of iterations, then increases the diversity of the solution and performs a local search at a later stage of the iterations to improve the convergence speed of the algorithm. Thus, the IABC has better global search capabilities to avoid premature convergence and provide a faster convergence speed, and it has optimal solution accuracy, solution diversity and robustness.
Model simulations
The model above is a multi-constraint, multi-objective, non-linear and mixed integer decision model that can be solved using the meta-heuristic optimization algorithm. Meta-heuristic optimization, such as a genetic algorithm, differential evolution and a colonial selection algorithm has been widely used to solve complex and challenging problems that are difficult to solve using derivative-based techniques. Based on the introduction of IABC algorithm, this part uses IABC algorithm to solve the multi-objective emergency logistics centres locating problem.
Parameter settings
The IABC algorithm parameters mainly include: the size of the bee colony (SN) is 100, the ratio of search bees (ratio) is 0.5, the maximum number of searches for nectar sources (max FNS) is 50, the maximum continuous update failure times (limit) is 20, and the maximum number of iterations (max Gen) is 1000.
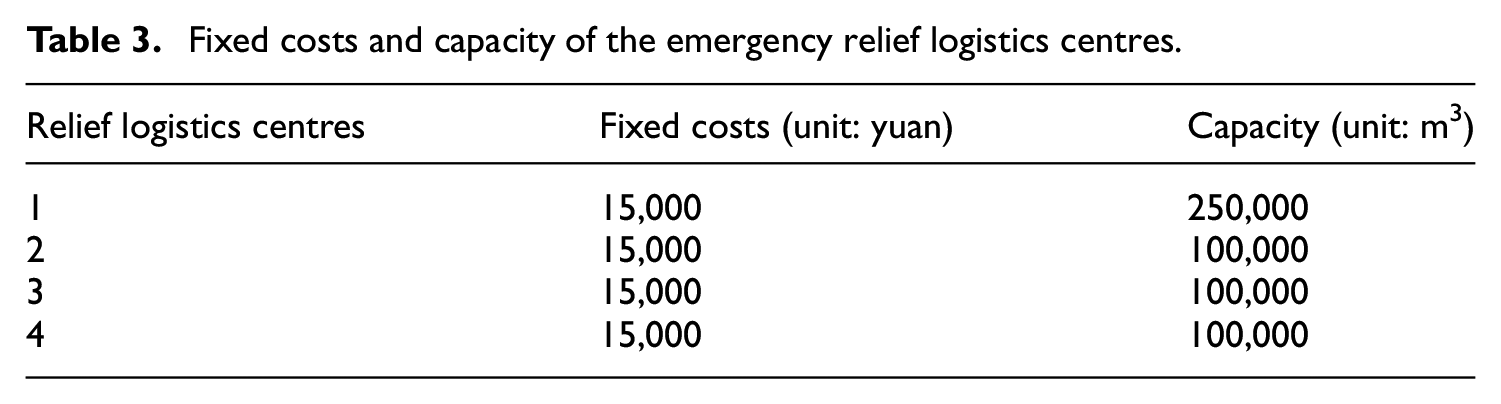
The model parameters are as follows: 1 relief supply centre, 4 logistics centres, 10 rescue sites and 4 rescue time intervals. The shortest and longest wait times tolerated by the rescue site are 1 and 12 h, respectively. The length of the simulated time span is 3 h. There are two types of relief supplies with volumes of 140 and 80 m3. The relief resources are transported using automotive vehicles, and the transportation cost per unit is 1 yuan/kg·km. The other parameter settings are as provided in Tables 2 and 3.
Ability to supply relief resources.

Fixed costs and capacity of the emergency relief logistics centres.
Simulation results
In this paper, the IABC is used to solve the above multi-objective programming problem. The IABC algorithm is implemented using MATLAB 7.0 on a laptop with 3.6 GHz CPU and 8 G memory. The IABC algorithm is used to solve the time window-constrained model for site selection of the emergency relief logistics centres. The optimal results obtained by statistics after running the program 30 times are shown in Table 4.
Optimal objective function.

It is observed from the above table that, when fixed cost is taken as the optimal objective function, the minimum fixed cost is 92,581, the rescue cost and customer satisfaction are 540,910 and 0.5425 respectively, and the customer satisfaction is relatively low. When relief cost is taken as the optimal objective function, the minimum rescue cost is 475,860, the fixed cost and customer satisfaction are 102,307 and 0.7636 respectively, and customer satisfaction has improved. When customer satisfaction is taken as the optimal objective function, the best customer satisfaction is 0.9104, the fixed cost and rescue cost are 130,450 and 517,437 respectively, and the fixed cost and rescue cost are relatively high. It can be seen from this that in each optimization process, the entire objective functions cannot reach optimal at the same time, and there is a phenomenon of benefit paradox. Each optimization obtains a series of non-dominated Pareto solution sets.
Besides, the optimal distribution routes of three different objective functions are as follows in Figures 6−8.

Route corresponding to the minimum fixed cost.
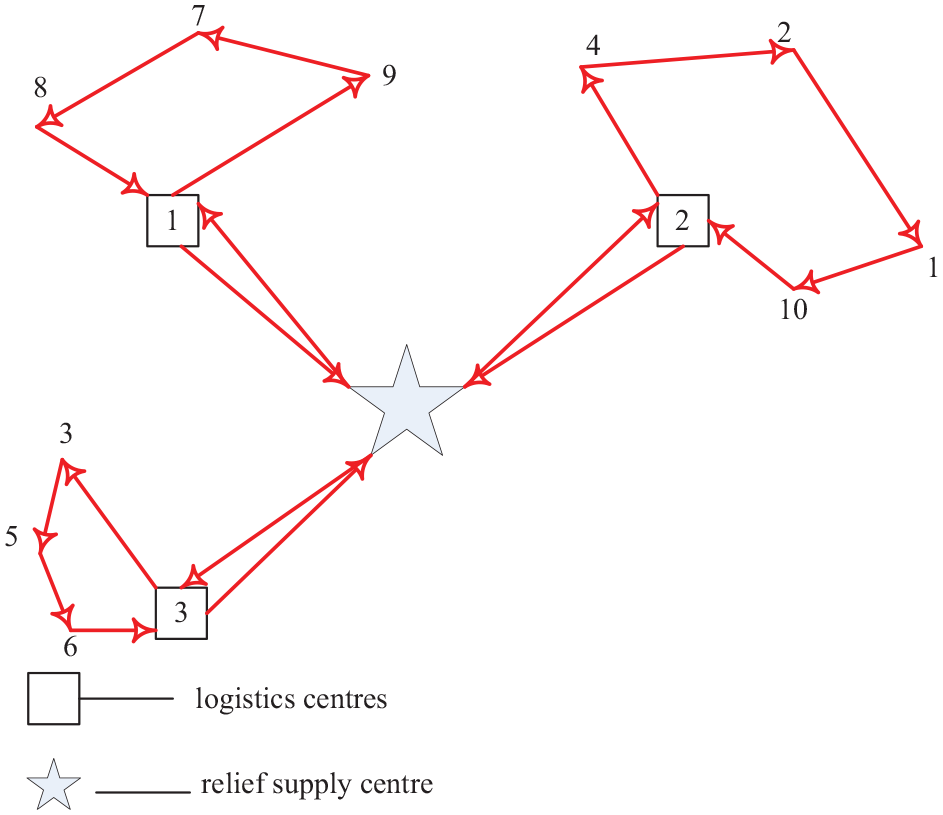
Route corresponding to the minimum total relief cost.
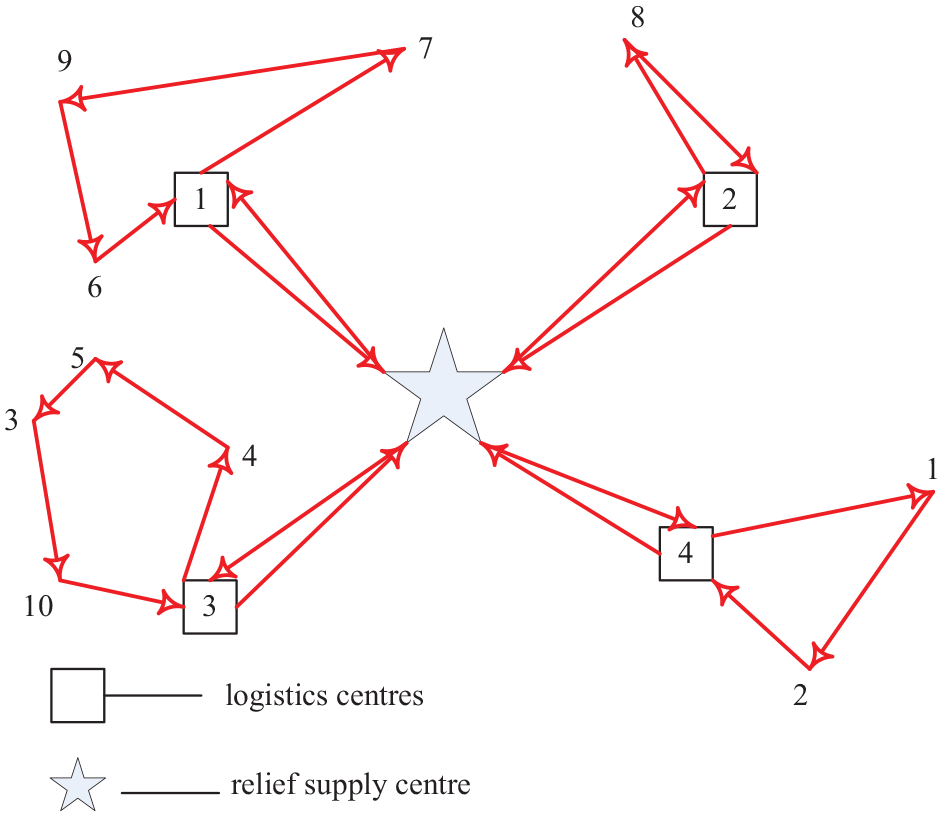
Route corresponding to maximum customer satisfaction.
The results show that compared with the traditionally fixed location of logistics centres, the locations of the logistics centres in our model vary with the rescue periods due to the different situations and needs at the rescue sites. Thus, an appropriate rescue site can be selected based on the location of the logistics centres and the situation at the rescue sites in different rescue periods. This maximizes the rescue efficiency and the satisfaction of the rescue site with regard to the rescue time. In the first period, the delivery of resources from the first logistics centre to the second rescue site was delayed; but in the second period, all the relief resources were delivered. In the second and fourth periods, horizontal transport of relief resources occurred between the logistics centres to maximize the satisfaction of each rescue site with regard to the rescue time.
Discussions
Time satisfaction analysis
The satisfaction of each rescue site with regard to the rescue time is shown in Figure 9.
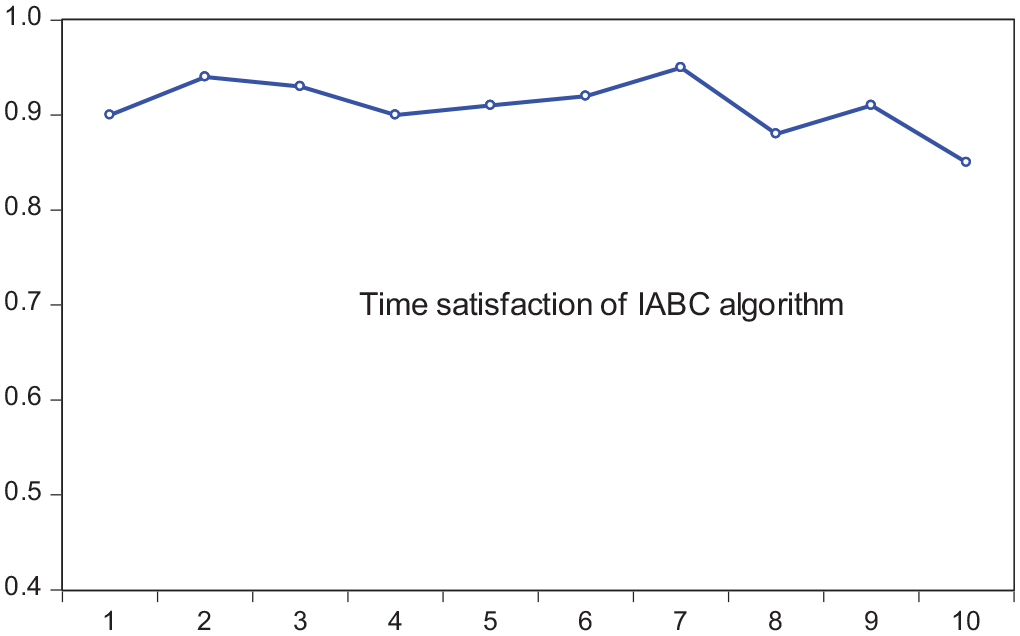
Time satisfaction of the 10 rescue sites.
Due to the delay in the delivery of relief resources to the second rescue site, that site is the least satisfied with the rescue time. The other rescue sites are very satisfied. The satisfaction of the rescue sites with regard to the rescue time and the horizontal transport of relief supplies between logistics centres are essential to real-world relief missions because the needs of the rescue sites must be met to the greatest extent possible while minimizing delay-induced transportation costs. Consequently, the satisfaction of the rescue sites is maximized. Hence, the proposed model is fairly helpful for choosing the appropriate locations of logistics centres and allocating relief supplies.
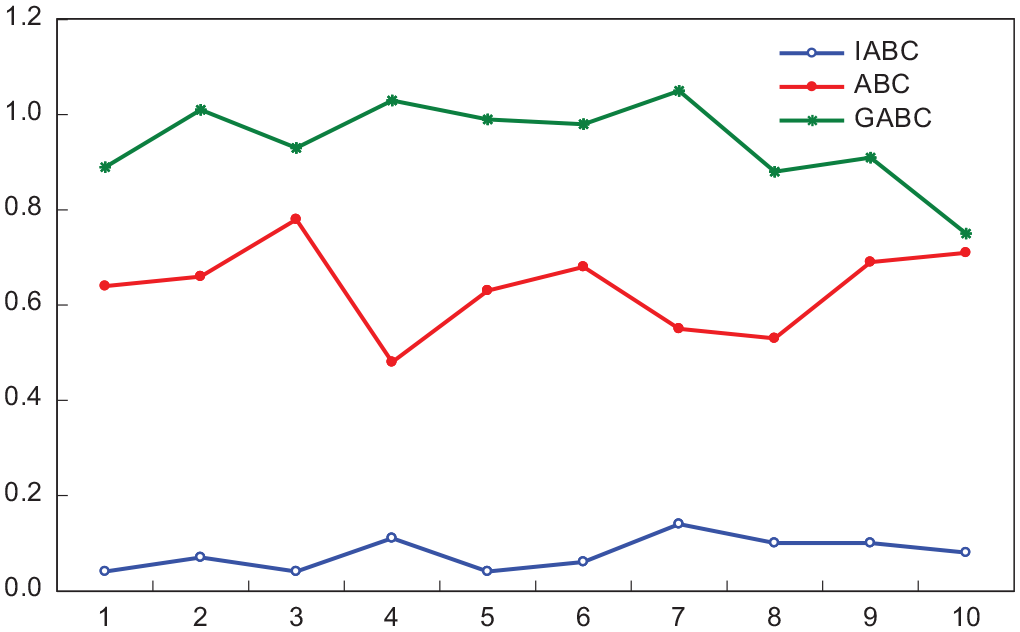
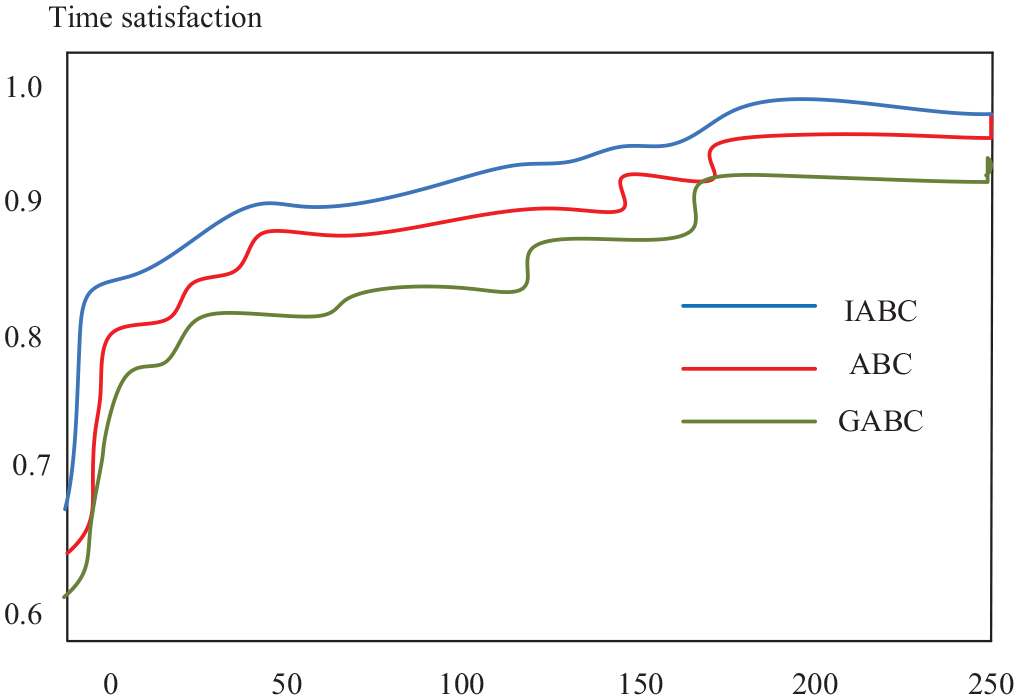
In order to further verify the effectiveness of the algorithm, ABC, GABC and IABC algorithms have selected to carry out comparative time Satisfaction. The result is shown in Figure 10.

Time satisfaction of different algorithm.
It can be seen that three different algorithms can find a better solution when calculating time satisfaction, and the gap is not very large, which shows that three different algorithms are easy to find a satisfactory solution when solving the problem of narrow time window path optimization. However, the time satisfaction accuracy of IABC algorithm is higher than that of ABC and GABC algorithm, IABC algorithm has a strong ability to search in depth and is better than the other two algorithms in accuracy, accuracy and credibility. The effectiveness of IABC algorithm is confirmed.
Algorithm validity comparison
In order to further verify the effectiveness of the algorithm, ABC, GABC and IABC algorithms have also selected to carry out comparative experimental research. Inverse generation distance (IGD), error rate (ER) and Number of non-dominated solutions (NDS) are used as evaluation indicators. 30 Among them, the smaller the value of IGD and ER, the better the performance of the algorithm. The larger the value of N, the better the performance of the algorithm. 31 The respective algorithms were independently run 10 times under each set of test data, and the average of the 10 results was taken as the final test result, which is shown in Figures 11−13.

IGD comparison of three algorithms.
ER comparison of three algorithms.
NDS comparison of three algorithms.
It can be seen that IGD, ER and NDS of IABC algorithm are significantly better than those of the other two algorithms. This shows that in the same test time, compared with the other two algorithms, the approximate Pareto obtained by IABC algorithm is the best and the convergence and diversity of the Pareto solution obtained by IABC are better, which better verifies the rationality and effectiveness of IABC algorithm.
Optimal model solution of algorithms
In order to verify the effectiveness of IABC algorithm, ABC, GABC and IABC algorithms have also selected to solve this multi-objective programming model. The algorithm parameter settings are the same and the running results of 20 times are collected respectively. The result is shown in the following Table 5.
Optimal model solution.

The numerical results show that the proposed IABC algorithm is significantly better than ABC and GABC algorithm in terms of the optimal solution. IABC algorithm is more advantageous than ABC and GABC algorithm with regard to solution accuracy and solution stability. IABC algorithm established in this paper is scientific and can be applied for emergency rescue centre selection to achieve better rescue benefits.
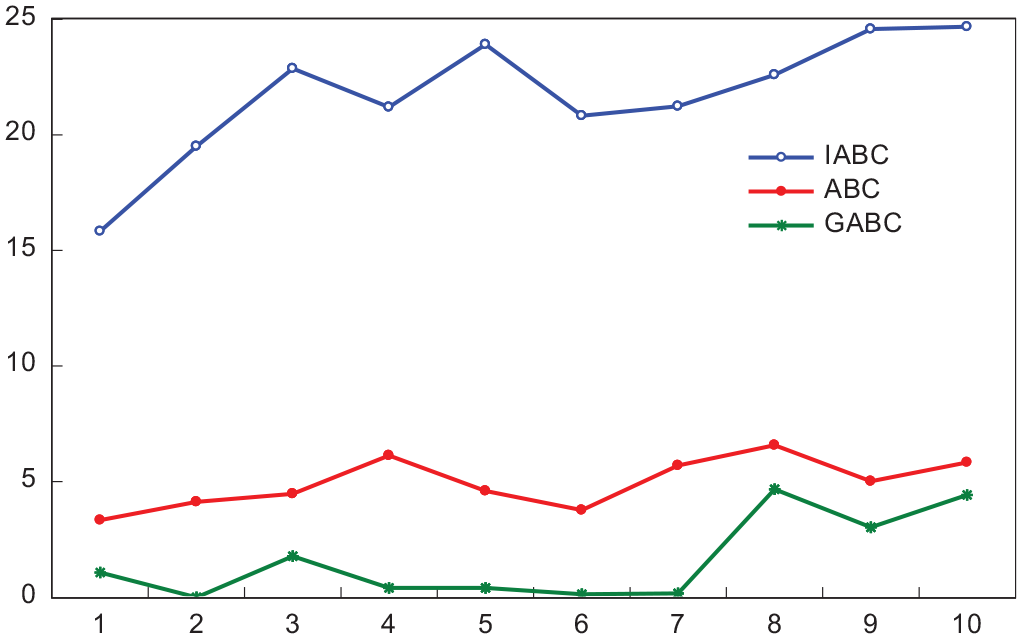
The convergence curve corresponding to the optimal solution is shown in the following Figures 14−16.

Convergence curve of fixed cost.

Convergence curve of relief cost.
Convergence curve of time satisfaction.
Two points can be seen from the above table and figure: (1) From the three optimal objective function values obtained, the optimal objective function values obtained by IABC algorithm are obviously better than ABC and GABC algorithms. (2) From the convergence curves of three objective functions the global search ability and the stability of IABC algorithm are better than those of ABC and GABC algorithm.
The following conclusions can be drawn through comparison: the IABC algorithm has excellent performance in convergence speed and solution accuracy than ABC and GABC algorithms. IABC algorithm can solve the problem that ABC and GABC algorithm are easier to fall into local optimality, poor stability and poor search ability. The effectiveness of IABC algorithm is verified.
Conclusions
This paper introduced satisfaction with the rescue time to relief supply logistics, examined time window-constrained site selection for logistics centres, and solved the proposed model using an improved ABC algorithm. The contributions of this paper are as follows:
This paper studies the process of ABC algorithm to solve optimization problems, and introduces linear formulas to improve the employed bee optimization strategy of ABC. The proposed IABC algorithm in this paper increases the diversity of the algorithm while improving the performance of the algorithm, and strengthens the breadth exploration ability in the early stage and the deep mining ability in the later stage.
The performance of ABC algorithm, GABC and IABC algorithm in the environment of solving emergency logistics center location have been compared and analyzed. The experimental results show that IABC is better than the other two algorithms in overall results such as location strategy, optimal solution of the objective function, average number of iterations and calculation time.
The time satisfaction function can be used to effectively gauge the performance of relief efforts by describing how content the rescue sites are with the rescue time and guarantee that appropriate sites are chosen for logistics centres.
However, emergency relief logistics systems are very complex and involve many factors. The objective function and constraints of the model proposed in this paper were simplified and did not take into account ground transport conditions, the relief radius, the speed of relief personnel’s response to the emergency, and the surrounding environment of the logistics centres. Hence, the proposed model needs to be refined further in the future.
Footnotes
Declaration of conflicting interests
The author(s) declared no potential conflicts of interest with respect to the research, authorship, and/or publication of this article.
Funding
The author(s) disclosed receipt of the following financial support for the research, authorship, and/or publication of this article: Natural Science Foundation of Shandong Province (ZR2020MG069).