
Abstract
The purpose of this paper is to present a new method to redesign dimensional and geometric tolerances of mechanical assemblies at a lower cost and with higher reliability. A parametric Jacobian-Torsor model is proposed to conduct tolerance analysis of mechanical assembly. A reliability-based tolerance optimization model is established. Differing from previous studies of fixed process parameters, this research determines the optimal process variances of tolerances, which provide basis for the subsequent assembly tolerance redesign. By using the Lambert W function and the Lagrange multiplier method, the analytical solution of the parametric tolerance optimization model is obtained. A numerical example is presented to demonstrate the effectiveness of the model, while the results indicate that the total cost is reduced by 10.93% and assembly reliability improves by 2.12%. This study presents an efficient reliability-based tolerance optimization model. The proposed model of tolerance redesign can be used for mechanical assembly with a better economic effect and higher reliability.
Keywords
Introduction
The dimensions of manufactured components are inevitably different from the nominal ones. Three-dimensional tolerance analysis methods have become increasingly important tools in the field of tolerance analysis. Both dimensional and geometric aspects are taken into consideration in the tolerance analysis. Chen et al. 1 briefly introduced four major 3D tolerance analysis models and made a comprehensive comparison and discussion over them. The Jacobian-Torsor model has been successfully applied for the deterministic and statistical tolerance analysis by Ghie. 2 Polini and Corrado 3 proposed an analytical approach, using the Jacobian model to carry out the tolerance analysis of mechanical assemblies. Khodaygan and Ghaderi 4 presented a new efficient method for the tolerance-reliability analysis, based on First Order Reliability Method (FORM). Tolerance- reliability analysis is about estimating a defect probability, which quantifies the probability that the final assembly does not meet the functional requirements. The study on the tolerance-reliability analysis and tolerance redesign, using the parametric Jacobian-Torsor model, has not yet been carried out.
Tolerance design is a crucial step in product design. Recent developments in tolerance design heightened the necessity to consider reliability constraints. Kong et al. 5 presented a tolerance design method to guide the quality improvement of helical springs, by considering the given reliability constraint, based on degradation performance. The process of determining the optimal tolerances is a trade-off between the total cost and the product performance. The total cost is the sum of manufacturing, inspection and rejection costs. In early references 6 of tolerance optimization, only the manufacturing aspect was considered as the objective function of minimizing cost. Nowadays, quality loss has received more attention,7,8 while the quadratic quality loss function, proposed by Taguchi, 9 is the most widely used model. The existing references 10 studied the tolerance optimization model, mainly based on fixed process parameters, whereas optimal process parameters should be applied to reduce overall costs. Mahmood et al. 11 presented an experimental approach, to investigate the effects on the geometrical properties of the benchmark component, considering the variation of the process parameter settings. Benanzer et al. 12 performed research about the reliability-based design optimization of design variance, to identify critical tolerances. The reliability-based tolerance optimization model has become an indispensable part of tolerance redesigning.
Various tolerance optimization methods have been applied, to determine the optimal tolerance. Numerical optimization methods are employed, including genetic algorithm,13–15 particle swarm, 16 Newton iteration method, 17 scatter search, 18 etc. The Lagrange multiplier method, as a classic method for constrained optimization problems, should be the first choice, as it can yield closed-form solution. 19 Karush–Kuhn–Tucker (KKT) conditions extend the application of Lagrange multiplier method, from equality constraint to the inequality, while they are necessary conditions for the best solution of nonlinear programming. Ramesh Kumar et al. 20 proposed an analytical method, to obtain a valid design by the Lagrange multiplier method, which integrates the Lambert W function. The generalized KKT conditions for generalized Lagrange multiplier method are derived by Li. 21 Satisfying the reliability-based inequality constraint, the assembly tolerance needs to be redesigned using optimal process parameters.
Based on the above ideas, a reliability-based tolerance redesign method, including the optimal process parameters, is proposed. The rest of this work is organized as follows: In section 2, the Jacobian model and Torsor representation are introduced, while two kinds of tolerance contributions are obtained. Section 3 presents the reliability and sensitivity analysis of assembly tolerance. The process variance optimization and tolerance optimization are carried out in section 4. Moreover, in section 5, the implementation and effectiveness of the proposed model are demonstrated. Section 6 includes the derived conclusions.
Parametric Jacobian-Torsor model
In this section, Jacobian-Torsor (J-T) model is employed to establish the mathematical relationship between the assembly functional requirement and the function of spatial dimension chain. A probabilistic framework is employed, by assuming that dimensional and geometrical tolerances are modeled using random variables. In a parametric Jacobian-Torsor model, the aleatory uncertainty is also considered.
The J-T model is composed of the Jacobian matrix model and the Small Displacement Torsor (SDT) model. A Torsor model is a vector consisting of three rotational components and three translational components, which represent the position and orientation relative to a nominal position. It can be represented as: [u, v, w, α, β, γ] T , where u, v, and w are the small translation components on the x-, y- and z-axes respectively; α, β, and γ are the small rotation components around the x-, y- and z-axes respectively. The Torsor model describes the small displacement variation of features with constrained torsors, which define the extreme limits in the 3D tolerance zone.
Jacobian matrixes describe the positions and orientations of the local reference frames in relation to the global reference frame, derived from the analysis of robot kinematic, in order to map velocities and displacements of joints to the end-effector coordinates system. The SDT of each functional element pair is computed to establish the stackup of functional requirements. There are two kinds of functional element pairs in an assembly: the interval functional elements pair and the contact functional elements pair. The difference is whether on the identical parts or not. The Jacobian matrix for both kinds of functional element pairs can be expressed as:
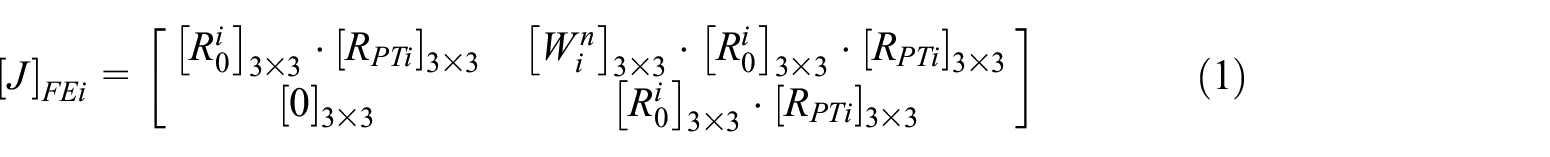
where

where
Combining the advantages of Jacobian matrix model and Torsor model, the expression of the unified J-T model is as follows:

where
The tolerance percentage contributions of each functional element are calculated as:

The tolerance percentage contributions of each tolerance

Tolerance-reliability and sensitivity analysis
Uncertainty is usually decomposed into aleatory uncertainty (e.g. variability in material properties) and epistemic uncertainty (e.g. uncertainty arising from measuring procedures or possible human errors). The role of these uncertainty sources, along with their potential for reduction, is extremely difficult to detect and qualify. The focus will be on the uncertainty, stemming from both part tolerances and process parameters. Dimensional and geometrical tolerances are modeled by random variables. Finally, the assembly quality can be quantitatively measured by the degree of reliability R based on the parametric Jacobian-Torsor model. The reliability of assembly tolerance refers to the probability that the assembly tolerance falls within the maximum allowable range, in the specified direction. The tolerance of functional requirement (
The limit state function of tolerance requirement can be defined as follows 22 :

where
In order to control the assembly quality of functional requirement, the degree of reliability

The relation as expressed in equation (7), can be transferred into the standard normal space.

The different sensitivities of dimensional and geometrical tolerances

where
Tolerance optimization and redesign
The process parameter optimization (process variance) is conditional on the assembly reliability requirement and involves a trade-off between the quality control and the relevant costs. The optimal setting of process parameters is determined using Lagrange multiplier method and considering the quality loss and process cost, simultaneously. KKT-conditions extend the application of Lagrange multiplier method and the candidate solution is the optimal solution, when the KKT conditions are satisfied. Based on the analytical solution of optimal process variance, tolerance optimization model is employed to get the optimal tolerances.
Parameter optimization
The problem of parameter optimization involves the process variance. The process mean can be determined according to the design requirements. Due to inherent variability of mechanical components, it is necessary to select the optimal parameter by minimizing the total cost. The quality loss function of the assembly is given by 23 :

where k is the quality loss coefficient,

where
The process cost can be expressed by the empirical linear model by Chase et al. 24 :

where
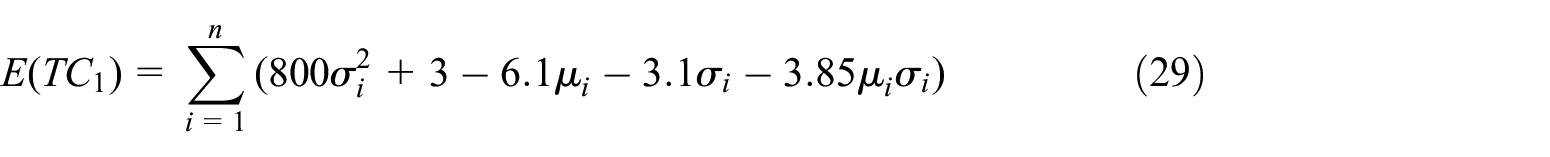
The expected total cost of the assembly is expressed as follows:

Considering the assembly tolerance reliability constraint, the optimal value of


The Lagrange function, considering inequality constraint, can be expressed as follows:

where
The necessary conditions to get the optimal solution can be provided according to Karush–Kuhn–Tucker conditions 25 :

Then, the analytical solution of optimal process variance can be obtained under the constraint of assembly reliability.
Tolerance optimization
The tolerance

where
Letting
In case the ith quality characteristic falls outside the range of tolerance limits, the components are unacceptable and will increase the costs. The expected cost of falling within the rejection range is defined as follows:

where
The manufacturing cost is associated with the range of tolerance. A tight assembly tolerance can increase the respective manufacturing cost. The range of tolerance can be written in terms of

where
The manufacturing cost function is usually modeled as a first-order form, 26

where

The expectation of total cost is established as follows:

Based on the optimal process tolerance variances

The closed-form solution of
Satisfying the following inequation, the closed-form solutions

Example verification
In this section, a numerical example is employed to demonstrate the application of tolerance optimization redesign model. The assembly composed of three components is illustrated in Figure 1. The functional requirement of this assembly is the vertical dimension of the centering pin. The corresponding dimensional and geometric tolerances are shown in Figure 2.
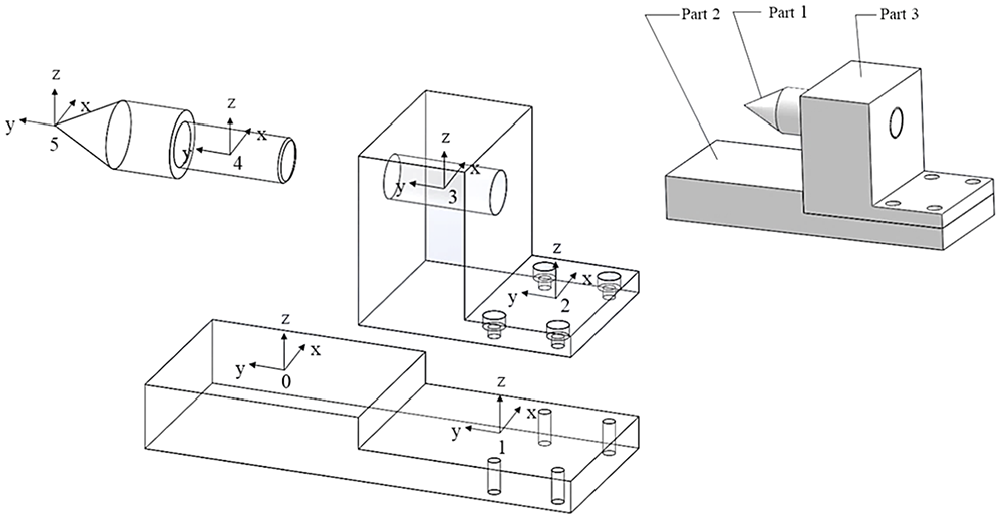
Effective features and local coordinates frames.

A three-parts centering pin mechanism.
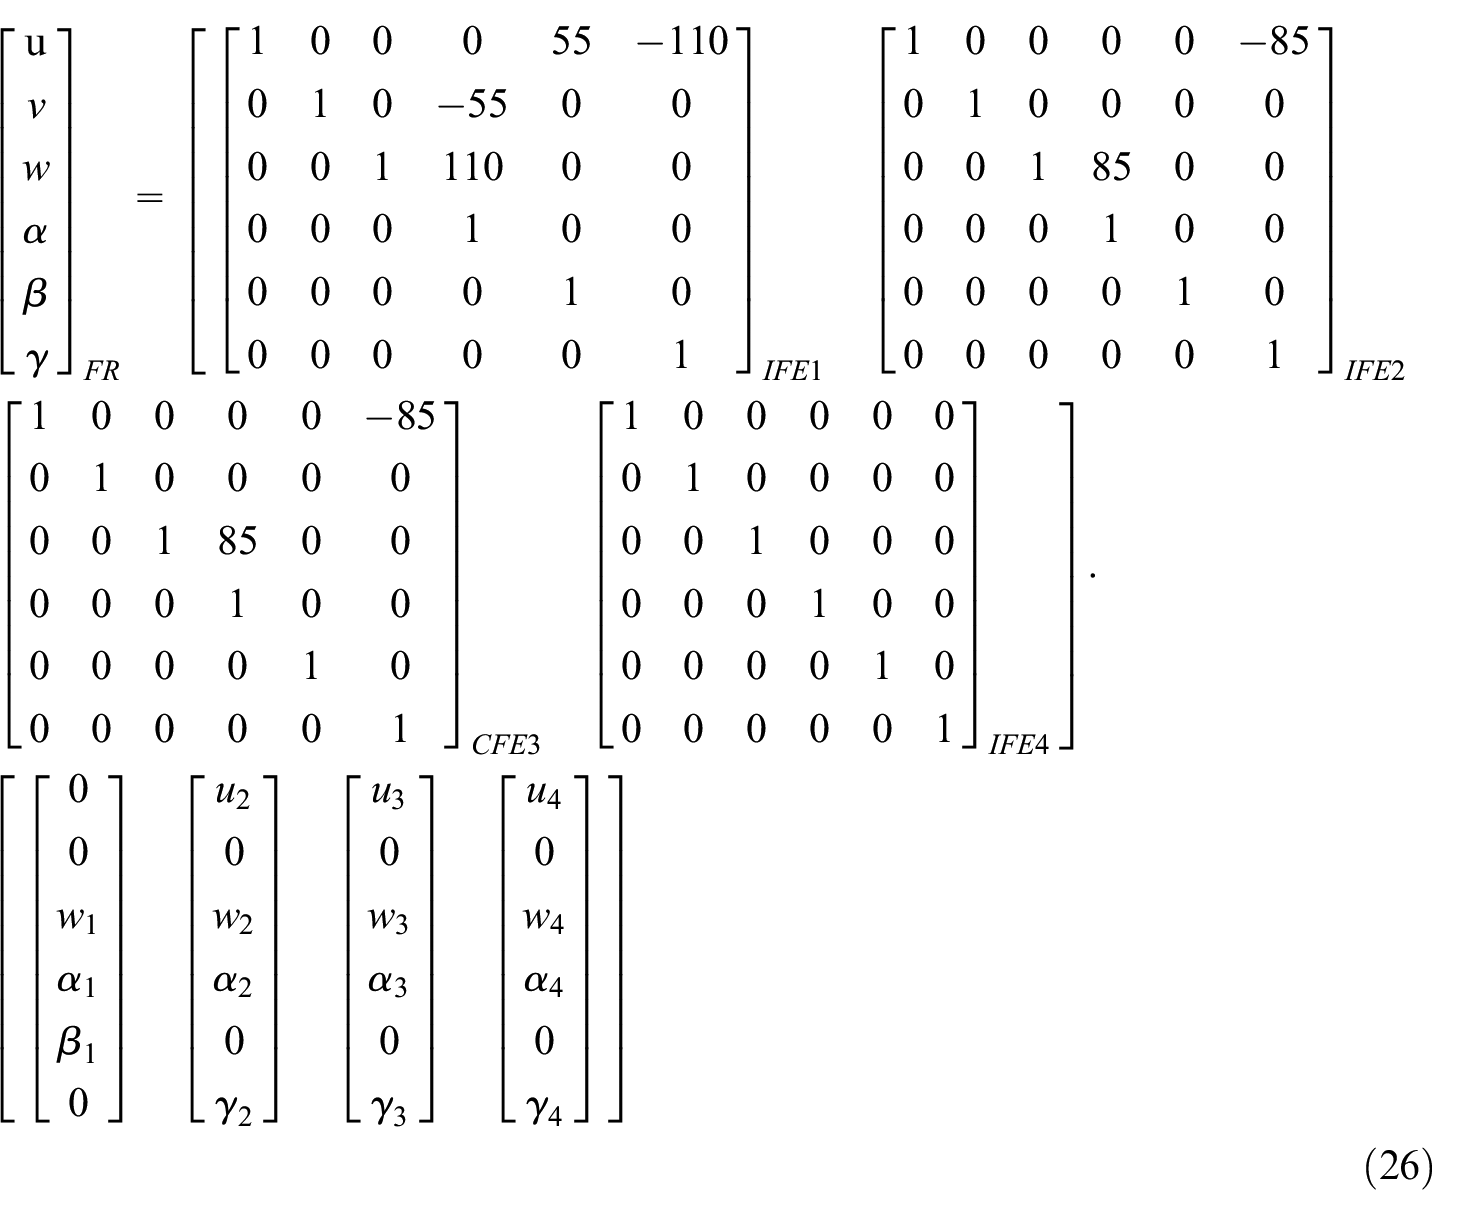
Figure 1 shows that, there are six effective geometric features in the assembly, which give base to the established local coordinates frames. The contact between the surfaces of column and base is assumed to be perfect. The connection graph of the local coordinates frames is constructed in Figure 3. The connection graph contains three interval functional element pairs and two contact functional element pairs. The details of unified J-T model are listed in Table 1. The torsors are associated with the tolerance ti. The final representation of the parametric J-T model is calculated as:


Assembly connection graph.
Details of torsors.

The assigned initial tolerance values are listed in the Table 2. Using equations (4) and (5), the tolerance percentage contributions of each functional element and tolerance
Initial tolerance values.

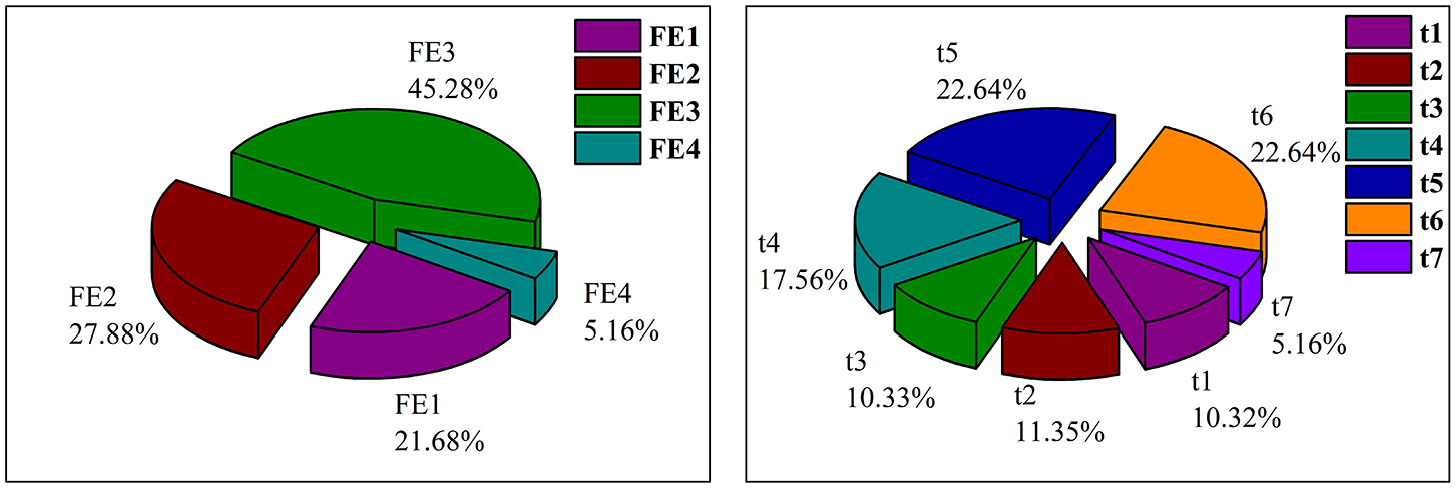
Tolerance percentage contribution pie chart.
Based on the experimental observations, the dimensional and geometric tolerances are modeled in the normal distribution. The obtained data of normal distribution can be expressed as follows:

The LSF of assessing the quality requirement can be considered as follows:

Based on the proposed method, the computed reliability value is 95.10%, which does not satisfy the assembly reliability requirement of 96.00%. It is necessary to conduct the reliability-based tolerance optimization and allowance. According to equation (9), the sensitivities of different tolerances to the assembly tolerance are shown in the Figure 5.
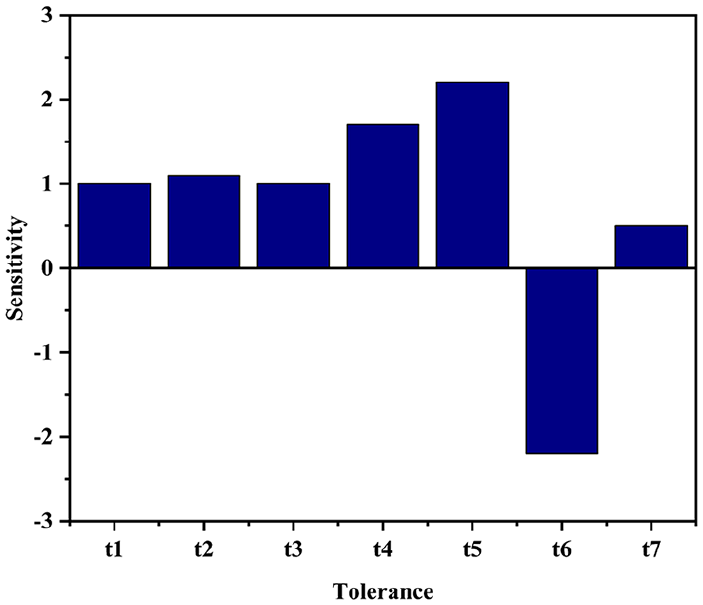
The sensitivity of assembly tolerance to
Figure 4 shows that the tolerances of
Due to the deviation from the quality requirement, the total quality loss function is described as the sum of the quadratic functions
The objective function is as follows:
Subject to the following:

According to the KKT-conditions, the necessary conditions are expressed as:

The optimal solution

Plots of the effect of
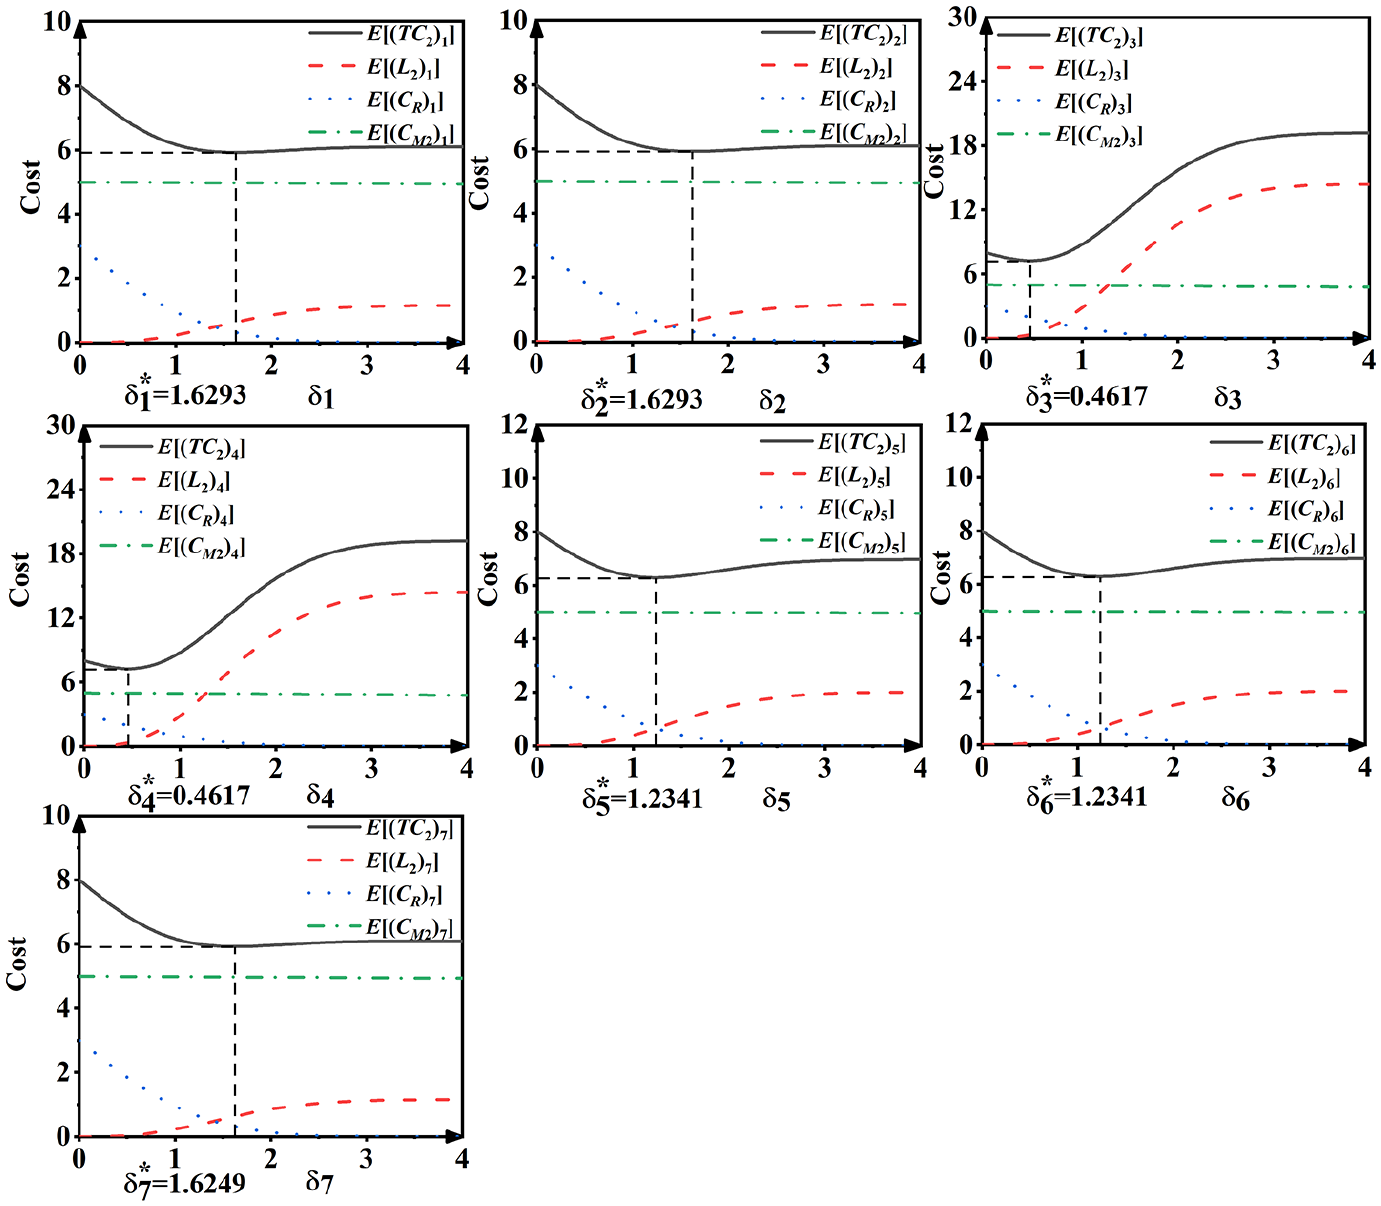
Plots of the effect of
The solution of the analytical method is consistent with the results in Figure 6, while the lowest point of the curve represents the minimum costs. The illustration in Figure 6 validates the process variance optimization based on assembly reliability.
Based on the variation of process variance

The plots of
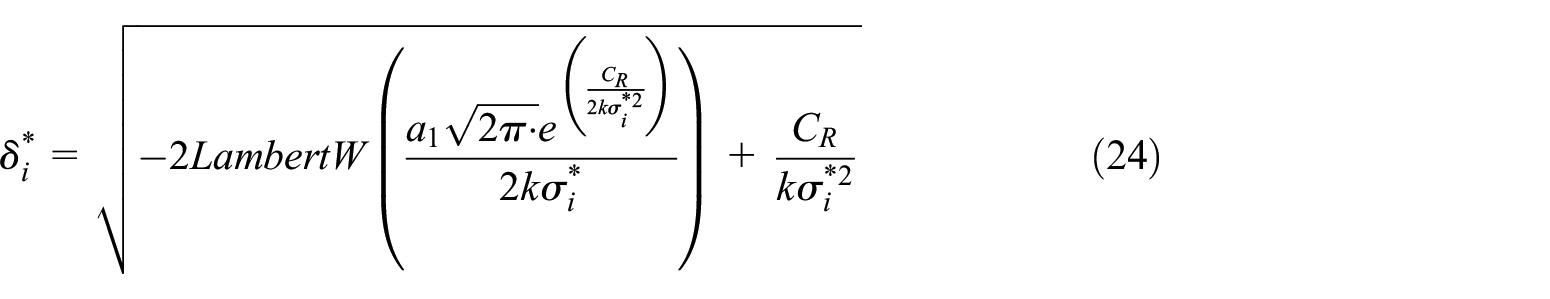
Using equations (23) and (25), the following expressions are calculated as:

Based on the solution of equation (24), the optimal
The comparison of original and optimal data.

Figure 8 shows the first derivative and the second derivative of

Plots of
Based on the optimal solutions, the comparison of the original to the optimal costs is presented in Figure 9. The cost of each tolerance
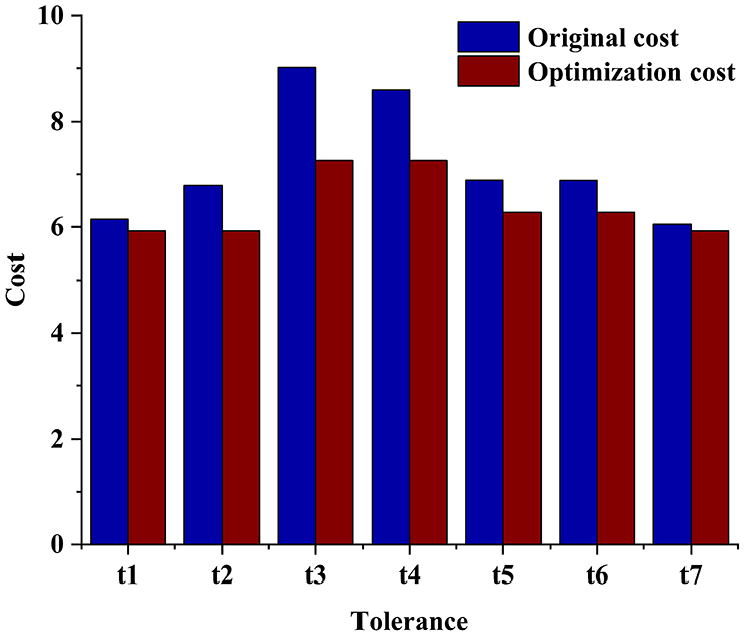
Comparison plots of original and optimal costs.
The obtained results show that, the proposed tolerance-reliability analysis and tolerance optimization can achieve lower cost and higher reliability. Based on equation (27), the original tolerance of functional requirement is calculated as (−0.9245, +0.9245), while the optimal tolerance of functional requirement obtains improved assembly tolerance of (−0.6318, +0.6318). Consequently, the proposed tolerance redesign model can produce ideal results.
Conclusion
This study presents a reliability-based tolerance optimization model. The Jacobian-Torsor model is applied to assembly tolerance analysis and analytical method is employed to obtain the closed-form solutions of the optimal tolerance. The torsors are represented by random variables, associated with assembly tolerances, which is the premise of assembly tolerance reliability analysis. The proposed tolerance optimization model is superior to the models, based on the assumption that process parameters are fixed. The optimal process variance and tolerance are considered separately, while the total costs, including quality loss, rejection cost, manufacturing cost, are treated as the objective function of parameter and tolerance optimization. Subject to the constraint of reliability-based inequality, the KKT conditions are employed to get a closed-form solution. Finally, the tolerance reliability satisfies the assembly requirement, while the tolerance redesign of a mechanical assembly is realized at a reduced total cost. It will provide a more practical method for designers to deal with the tolerance redesign of mechanical assemblies.
However, there are limitations to the proposed method, such as the fact that it cannot solve the partial parallel chain problem for mechanical assembly and the assumption that the tolerances follow the normal distribution. In the future, the assembly tolerance reliability of partial parallel connections will be considered to obtain the optimal tolerance, and a non-probabilistic interval uncertainty method could be employed for tolerance reliability analysis, instead of the normal distribution.
Footnotes
Declaration of conflicting interests
The author(s) declared no potential conflicts of interest with respect to the research, authorship, and/or publication of this article.
Funding
The authors disclosed receipt of the following financial support for the research, authorship, and/or publication of this article: The authors gratefully acknowledge the support of National Natural Science Foundation of China (51975110), Liaoning Revitalization Talents Program (XLYC1907171) and Fundamental Research Funds for the Central Universities (N2003005).