
Abstract
The cable-beam anchorage zone is the vital load-bearing component in suspension bridge. For maintenance of such structure, a method of probabilistic optimization was proposed by combining linear elastic fracture mechanics, structural reliability and life cycle cost analysis. In this method, the optimal maintenance time is obtained by determining the relative proportion between the costs under the condition that the structural reliability is higher than the minimum allowable reliability. While, the minimum total maintenance cost is obtained by determining the maintenance interval. Then, an example is presented to verify this method, with the following conclusions: the reliability index is inversely proportional to the failure probability, the change of maintenance cost and failure cost affects the optimal maintenance time, the optimal maintenance time will be ahead of time when consider the risk cost. And finally, when the maintenance time interval is determined, the optimal maintenance cost is affected by the maintenance probability and the failure probability.
Introduction
Suspension bridges have been recognized as the most appealing structures due to their esthetic appearances as well as the structural advantages of cable, due to their distinguished ability to overcome large spans. Whereas, the anchorages between the suspenders and the stiffening beams (cable-beam anchorage zone), is the vital load-bearing component. Playing the role as transferring forces from cable to stiffening beam, the cable-beam anchorage is among the most fatigue-prone components of suspension bridges, owing to the complex geometrical configuration and loading conditions. The mechanical properties of the anchorage are directly related to the safety of the whole bridge.1–3 Being welded, fatigue damage will emerge in cable-beam anchorage under cyclic loads induced by wind and vehicle loads. With the rapid development in the transportation industry, the traffic flow continues to increase quickly, so the fatigue damage of cable-beam anchorage is prone to grow. 4
The anchorages fatigue performances of many long-span suspension bridges have been studied.1–3 However, most of these researches focus on the stress analysis and fatigue performance evaluation of the cable-beam anchorage, but the maintenance evaluation of cable-beam anchorage is less involved. Zhongxiang Liu etc. present the field inspections on the pattern, location and propagation of cracks of the Runyang Suspension Bridge. A multi-scale finite element (FE) model of the bridge is developed To further investigate the mechanism of cracking. Besides, probabilistic FE analyses are performed to predict fatigue lives of the anchorage zone. 5
This paper is based on the whole life maintenance method,6,7 as well as the linear elastic fracture mechanics (LEFM). The bridge maintenance cost is divided into inspection cost, repair cost and failure cost, while the inspection cost and repair cost are actual cost, and the failure cost is risk expense. Furthermore, structural reliability theory and life cycle cost method are proposed to optimize the fatigue maintenance of welded steel components.
Reliability evaluation of fatigue life based on LEFM
The cracks are prone to appear in the steel components under cyclic loads, and the steel components will be fatigued failure when the cracks continue to expand. 3 The influence factors of fatigue crack propagation are often random, so the fatigue life of steel components tend to have a greater randomness.8,9 The method of probability analysis is usually used on reliability evaluation of fatigue life of steel component. 6
The initial crack defect of welding components exists inevitably (hereinafter referred to as the initial cracks), which making the formation time of fatigue cracks is very short. Generally, only the life of fatigue crack propagation of welding component needs to be considered. Fatigue crack propagation is generally calculated by Paris formula 10 :

In which, a is the crack size, n is the number of stress cycles, m, C are the fatigue parameters of steels,
The stress intensity factor range can be expressed by


Where,
The increase of traffic volume will lead to an increase in the number of stress cycles, so it is necessary to consider the annual growth rate in the number of stress cycles. It is assumed that the annual growth rate of stress cycles is

where, M(t) is safety margin of structure after operation time t,
According to the equation (4), if

Where,

Flowchart of reliability evaluation of fatigue life based on LFEM.
Optimization of maintenance strategy for welding component
Crack detection probability
Cracks can be detected by inspecting the components, the proper maintenance strategy should be taken according to the detection results. The detection efficiency is related to many factors, such as detection methods, inspection personnel, inspection quality and so on. These influence factors are complex and uncertain. For fatigue problems, the detection quality depends on the probability of crack detection. In a detection, some factors have a direct influence on the results of cracks detection, such as the accuracy of a detection instrument, the uncertainty of the selected detection location and the judgment ability of the operator. Not all cracks can be detected, some cracks may be missed during the inspection process. The detection quality of cracks is expressed by random variable q. When q is equal to 0, no crack is detected, and when q is equal to 1, it corresponds to the perfect detection. Nondestructive testing is usually used to detect cracks, which includes visual inspection, X-ray detection, magnetic particle testing and other methods.13,14 The detection accuracy, q, of each detection method is different, so the corresponding detection costs are different.
7
The crack detection probability

Where,
Different distribution models, such as exponential distribution, Weibull distribution and normal distribution, have a little influence on the final detection results. Therefore, the exponential distribution is generally used to simulate the randomness of
Maintenance willingness of decision-maker
Whether or not to carry out maintenance depends on the maintenance willingness of bridge manager, but the maintenance funds, maintenance priorities and political factor and other factors will affect the decision of bridge manager. The probability variable,


Where
Maintenance measures probability
There are three kinds of result as well as treatments after detecting at time
Under the statistical parameters of the component material are independent, it is assumed that the material of the component has the same fatigue characteristics before and after maintenance. The safety margin,

After detecting a crack at the time

The detection probability, which depends on the detection interval

The probability that the components or structures will fail to achieve the desired function during the period of inspection of the structures is failure probability, so the failure probability in the time interval is expressed as:

Probabilistic optimization of fatigue maintenance strategy
The total cost of bridge maintenance is divided into inspection costs, repair costs and failure costs. The inspection and repair costs are actual incurred expenses. The failure cost is loss caused by structural fatigue failure and it’s belongs to the risk cost. Maintenance should find a reasonable balance between inspection costs, repair costs and failure costs. In general, the better the detection equipment is, the higher the detection accuracy is, the smaller crack size will be detected, and therefore the higher cost of repair will be. These costs are not realistic currencies, so the expected costs need to consider the impact of the discount rate, r, and also multiply the corresponding probability of occurrence. 7 The optimal maintenance cost is achieved by optimizing the maintenance interval, and it is used in fatigue maintenance activity of the cable-beam anchorage of suspension bridge.
The expected inspection cost, repair cost and failure cost are, respectively 11 :


where,
The bridge fatigue maintenance optimization is transformed to the problem that the expected total cost of maintenance is minimum under the condition that the fatigue reliability of the component is higher than the minimum allowable reliability at a given time,
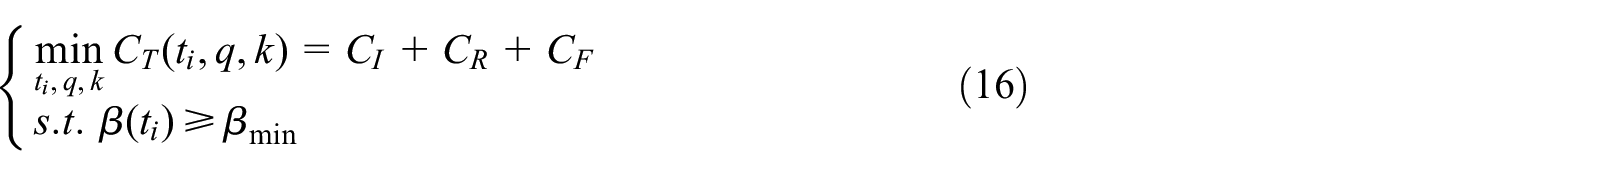
In equation (16),
A case study
Taking the cable-beam anchorage of a suspension bridge with a main span 788m as an example, the fatigue performance degradation and the optimal time of the first fatigue detection and maintenance in the design life period are analyzed.
General description
The bridge cited in this paper is a steel box suspension bridge which main span is 788 m. The overall layout of this bridge is shown in Figure 2. The main beam is an orthotropic steel box beam, 3.5 m high, 30.7 m width (including

The overall layout of bridge.

Local detail of cable-beam anchorage structure.
Fatigue reliability calculation of cable-beam anchorage
The initial crack size,
Fatigue-related stochastic variables.

According to equation (5), the fatigue failure probability of welded steel bridge is related to the fatigue reliability index.
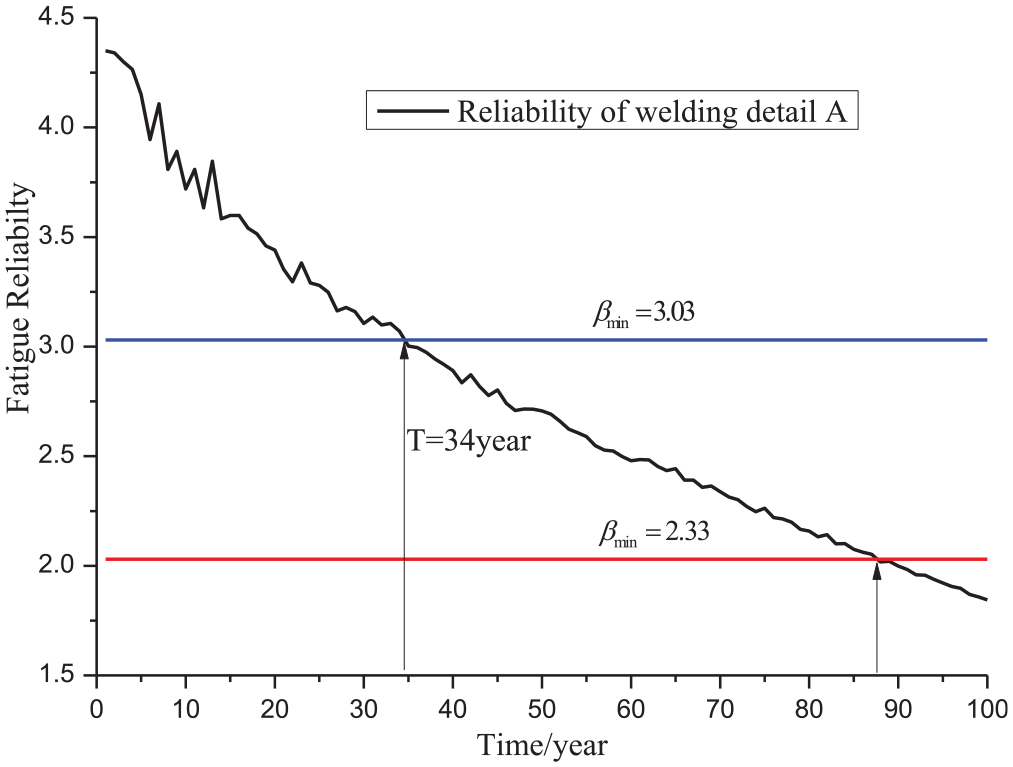
Reliability during the life span of a detail.
The fatigue cracking of the welded detail in the cable-beam anchorage zone cannot cause overall catastrophic damage of the bridge structure, but it will aggravate the internal corrosion of steel box beam and cracking of deck pavement.12,14 If the target reliability index
The best maintenance time
It can be seen from Figure 4 that when the time is 34 year, the reliability index of the anchorage reaches minimum allowable reliability and the maintenance must be carried out, which is a conventional maintenance method. This method corresponds to the strategy that anchorage is only repaired after damage, the anchorage at this time closed to the failure, the failure risk is great, so maintenance at this time is not the best choice. In the practice of bridge maintenance, the costs of maintenance and management are often limited. How to reasonably allocate the cost for fatigue maintenance is an important issue that the maintenance management department should be considered. 15 Combined with the existing research data, the values of optimization of variables are listed in Table 2.16–20
Values of optimization of variables.

Take data from Table 2 to (equations 13–16) and calculate the costs, and the total cost is the following:

The relative proportional relationship between the expected inspection, maintenance, and failure costs is shown in Figure 5. When time is 18 year, the total cost is minimum and maintenance reaches the best time. The best maintenance time in Figure 5 advance 16 year than in Figure 4.

Relationship of respected inspection, repair and failure costs.
With the increase of operating time, the failure probability of the structure and the cost of failure are gradually increased. The repair probability and repair costs are proportional to the operating time. The probability of failure is proportional to the operating time. Due to the discount rate and the operation time, the total cost will emerge a minimum value that it is correspond to the optimal maintenance time. Because the inspection cost is relatively small, the key factors that affect the optimal maintenance time are the change of maintenance cost and failure cost with time. The issue that determining the maintenance interval to make the total maintenance cost minimum is mainly depends on the repair probability and failure probability.
Conclusion
The optimization fatigue maintenance probability method is present, to assist the maintenance decision of welded steel bridge components.
The detection probability, the probability of maintenance willingness, the repair probability, and the failure probability, are all taken into account in the new optimal maintenance strategy.
In this strategy, optimization goal is to gain the minimum maintenance cost, based on the precondition that components meet minimum allowable reliability. Also, a balance should be kept between inspection cost, repair cost and failure cost.
The reliability index is inversely proportional to the failure probability, and inversely proportional to the fatigue life. As the serve time goes on, the best maintenance time needs to be advanced.
The repair probability and repair costs are directly proportional to the operation time, as well as the failure probability.
Both repair probability and failure probability, are the main influencing factors to the total maintenance cost. Besides, the optimal maintenance time has strong relation with repair cost and the failure cost.
Footnotes
Declaration of conflicting interests
The author(s) declared no potential conflicts of interest with respect to the research, authorship, and/or publication of this article.
Funding
The author(s) received financial support for the research, authorship, and/or publication of this article: This research was supported by the State Key Laboratory of Mountain Bridge and Tunnel Engineering (CQSLBF-Y16-10), Mountain Bridge and Materials Engineering Research Center of Ministry of Education (QLGCZX-JJ2017-5), Venture & Innovation Support Program for Chongqing Overseas Returnees (cx2018113) and the National Natural Science Foundation of China (grant no. 51478071).