
Abstract
To design a reasonable dimensional tolerance of a transmission shaft, the higher product quality while lower manufacturing cost must be considered. This paper provides a mathematical model and a flowchart which elucidates the relationship between process capability index (PCI), reliability, tolerance and manufacturing cost, considering the characteristics of the shaft diameter, the material and manufacturing process. A 10.904% cost reduction under certain PCI range of a real case shows the effectiveness of the model and flowchart, thus it can be applied to those technical area when optimizing product design.
Introduction
Tolerance design is of crucial importance to product development. 1 Close tolerance would improve product quality but increase manufacturing cost, while wide tolerance might result in poor product quality. Therefore, reasonable design of dimensional tolerance is necessary. 2
In engineering practice, there are different schemes for tolerance design. 3 To select the optimal manufacturing scheme, there is a need for technical and economic evaluation of the process route. In general, the minimum manufacturing cost and quality loss are regarded as the evaluation indexes. Production batches, manufacturing methods, materials, tolerance and other factors may influence the manufacturing cost and quality.
Tolerance allocation has been researched extensively, and many practical results have been reported.4,5 Numerous studies have been conducted, the methods based on the uncertainty analysis and tolerance charting have been proposed.6,7 And based on probabilistic uncertainties,8,9 an optimization method to simultaneously find the optimal combination of structural sizes and dimensional tolerances was presented. 10 For multi-criteria analysis of components in complex technical systems, the Analytic Hierarchy Process (AHP) method is often used to synthesize the quantitive and qualitive factors. 11 Recently, intelligent optimization algorithms have also been used for tolerance allocation and optimization.12,13 Furthermore, reliability prediction is used in advance to determine whether the product is reliable.14–19 When optimizing tolerance, reliability is typically used as a constraint, and manufacturing cost is the objective function. Reliability-redundancy allocation problems are often formulated to either maximize system reliability or minimize costs.20–22 Expect for manufacturing cost, Taguchi proposed a quality loss function for assessing the effect of tolerance variation on product quality.23–25 The cost-tolerance model and quality loss function 26 are typically combined, then tolerance design is optimized. 27
The dimensional tolerance is related to the manufacturing process and directly determines the manufacturing cost. 28 Therefore, it is important that the tolerance allocation should be reasonable, thus reducing the manufacturing cost. In the process of tolerance allocation, the functional relationship between cost and tolerance is involved. Generally, when the tolerance is reduced to a certain value, the cost will increase sharply with the tolerance decreasing. 29 In addition, manufacturing cost is an important evaluation parameter of tolerance allocation scheme. It also deeply influences the establishment of the cost-tolerance model.30, 31 Therefore, the reasonable selection of cost-tolerance model has important theoretical significance and economic value for the dimensional tolerance design. This paper aims at selection of appropriate model for reasonable tolerance allocation to optimize manufacturing cost.
This paper discusses the dimensional tolerance design of the transmission shaft based on the reliability theory, PCI, and cost-tolerance model. The paper is organized as follows. In section 2, the concept and computational formula of PCI are introduced. In section 3, the reliability calculation model of transmission shaft is introduced, and the mathematical relationship among PCI, reliability, and tolerance is explored. In section 4, cost-tolerance model is used to calculate and analyze the manufacturing cost. In section 5, a numerical example of dimensional tolerance design is employed to illustrate the application of the proposed method. Finally, in section 6, the conclusions are summarized.
Process capability index
Process capability refers to the actual manufacturing capacity of a process during a certain time and under the steady state. And it is a degree of quality stability of the manufacturing process. The process here refers to the comprehensive effect of five basic quality factors: operator, machine, material, method, and environment. Process quality is an important factor to determine the product quality. 32 Product quality is the comprehensive expression of different quality characteristics during the whole process. For any manufacturing process, product quality is always scattered. If process quality is higher, then the dispersion of product quality will be smaller. Contrarily, if process quality is lower, then the dispersion of product quality will be greater.
In general, the process distribution has been found to resemble the normal distribution curve (Figure 1). And according to the Six Sigma Quality Management, 6 times the standard deviation is used to represent process capability, denoted as

Distribution of the quality characteristic value of the product.
Process capability index

where
The smaller

where
Reliability of transmission shaft
The transmission shaft is used for power transmission of transmission system, which has smaller mass and can transmit larger torque. 34 Therefore, it is necessary to make it have enough strength, rigidity, reasonable structure size, and reduce its length and weight as much as possible in design. 35 In addition, the design should also consider the benefits of manufacturing and maintenance.
Torque is mainly transmitted by the transmission shaft, while the bending moment and self-weight are not considered. Therefore, the torsional shear stress


where
The shaft radial error is mainly determined by the process, so the radius follows normal distribution. According to equation (3), if the torque is normally distributed, the torsional shear stress also follows normal distribution. The mean value and standard deviation of shear stress and shear strength can be given as follows:


where
As the stress-strength interference reliability model shows, 37 the reliability of the transmission shaft R can be given as follows:


where
According to equations (6) and (10), the standard deviation of radius can be obtained as follows:

During the shaft design, the materials are firstly selected based on the load, then the minimum radius is determined. According to the Six Sigma Quality Management, the radius tolerance of the transmission shaft

According to equations (1), (2), (11) and (12), process capability index can be obtained as follows:

If the distribution of the torque and the mean value of radius are known, the distribution of the shear stress and the shear strength can be obtained. As the equations (11) and (13) show, only the process capability index

Cost-tolerance model
To realize the reasonable allocation of tolerance and reduce the manufacturing cost in the tolerance design, a reasonable cost-tolerance model must be established. Over the past decades, different types of cost-tolerance models have been proposed for optimal tolerance allocation. And these models are summarized in Table 1.
Proposed cost-tolerance models.
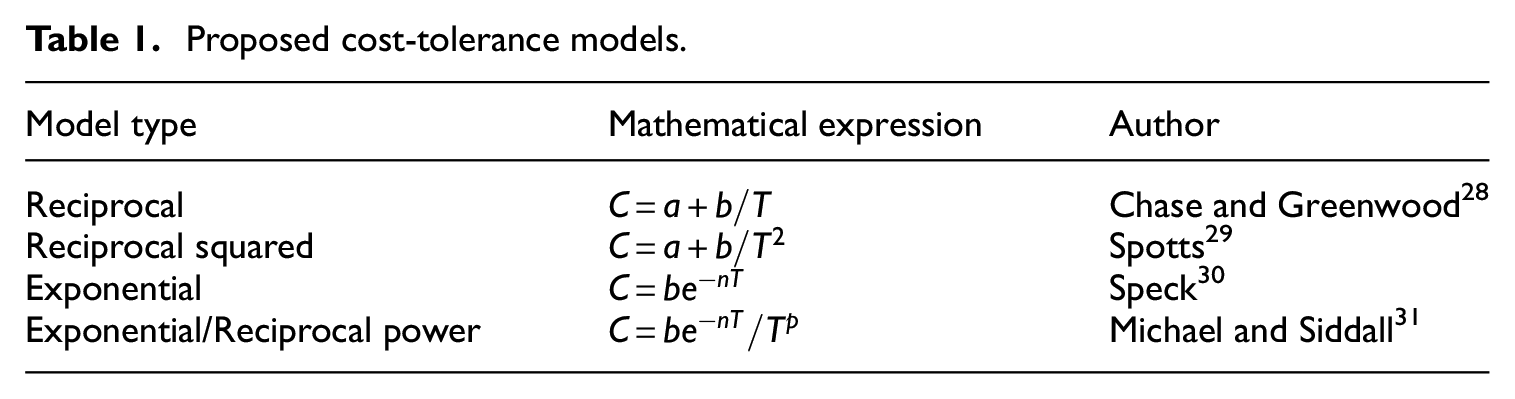
To realize the reasonable allocation of tolerance to reduce the manufacturing cost in the tolerance design, a reasonable cost-tolerance model must be established. Some cost-tolerance models, such as exponential, power exponent, negative square, polynomial, and power index portfolio models have been proposed. Speck proposed the exponential model with an exponential relationship between manufacturing cost and tolerance. 38 Spots proposed the reciprocal square model in which manufacturing cost is inversely proportional to the square of tolerance. 39 According to Chase and Greenwood, manufacturing cost is inversely proportional to tolerance and is referred to as the reciprocal model. 40 Michael and Siddall considered the former models to be too simple, and the model fitting errors are large. 41 Therefore, they proposed the composite model including the reciprocal and reciprocal square composite models. In 1994, Dong and Hu proposed five types of manufacturing cost-tolerance models having higher accuracy on the basis of elementary function. 42 Each model has a specific tolerance range to reflect the actual manufacturing process capability. However, these mathematical models have certain limitations in terms of the accuracy of fitting the relationship between the processing coast and the dimensional tolerance.
To compare the results conveniently, the reciprocal power model is chosen in this paper:

where C is the manufacturing cost, T is the dimensional tolerance. a, b, and c are three parameters in the cost-tolerance model, which are related to the processing method and assembly method of parts. 43
As the cost-tolerance model (equation (15)) shows, according to the given dimensional tolerance, the manufacturing cost can be calculated and compared.
Through the analysis all above, the dimensional tolerance design of the transmission shaft is completed based on the reliability theory. The design flow chart is shown in Figure 2.

Design flow chart of shaft diameter tolerance.
According to the Figure 2, we can finish the reliability design for the shaft, with considering the diameter characteristics such as torque, material, sheer stress and strength, the material characteristics, the manufacturing process control characteristics and so on. To verify the effectiveness of the flow chart and model, a case study was provided in the following example verification section.
Example verification
In this paper, a transmission shaft with the torque
According to equation (5), the mean value of shear stress can be determined as
Maximum allowed dimensional tolerance corresponding to different reliability.
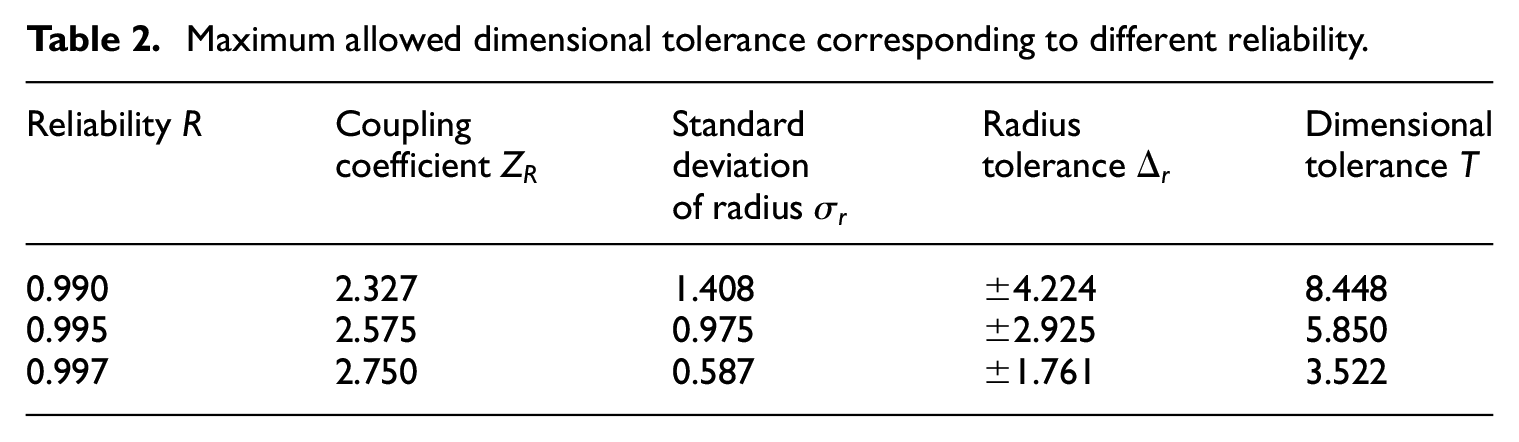
If the reliability is the design requirement, maximum reliability R is 0.997. Then the shaft radius tolerance is
After being processed, the diameter size of the transmission shaft is a random variable. It can be assumed that the diameter size approximately follows normal distribution. The statistical results of diameter sizes of 100 randomly collected trial shafts are shown in Table 3.
Transmission shaft diameters.
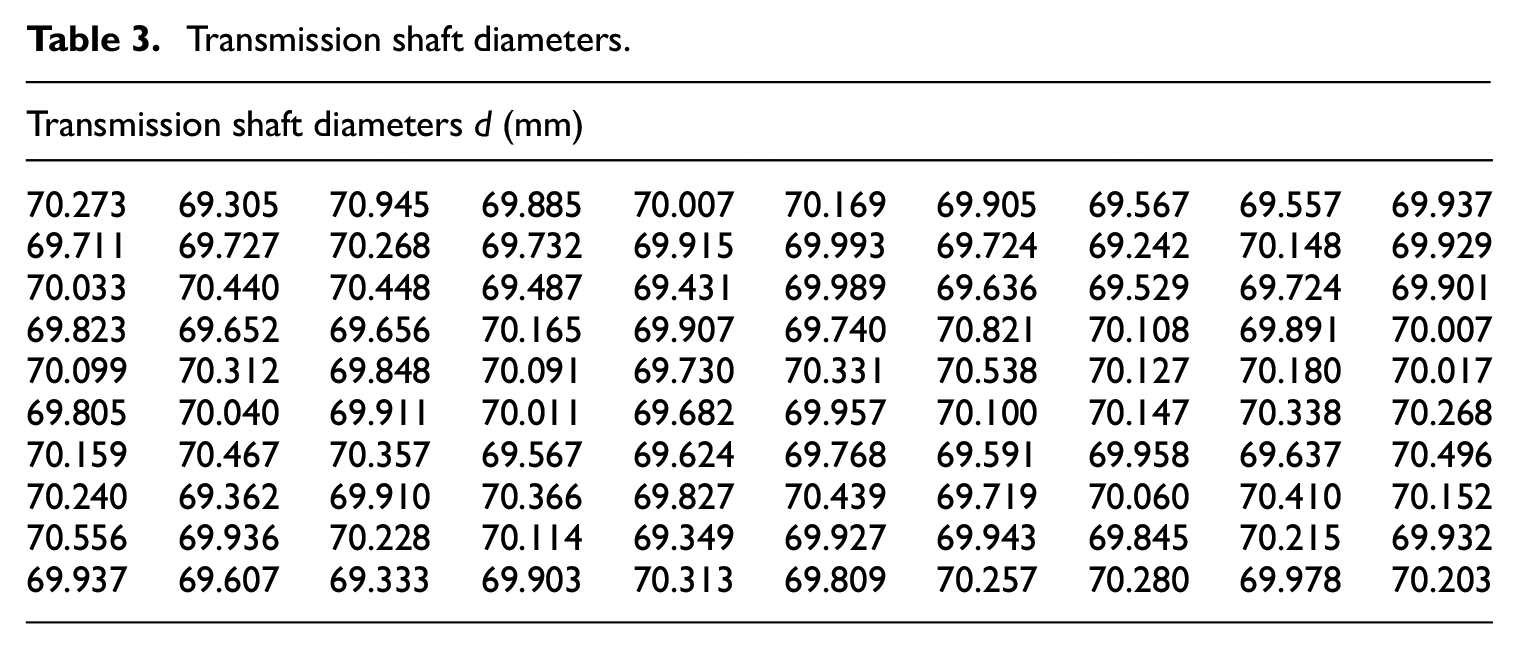
The frequency histogram and fitting distribution curve of diameter sizes of 100 randomly collected trial shafts in Table 3 are shown in Figure 3.

The frequency histogram and fitting distribution curve.
As can be seen from the Figure 3, the diameter size of the transmission shaft indeed approximately follows the normal distribution, so the above assumption is reasonable.
The diameter of transmission shaft approximately follows normal distribution, then the mean value


According to equation (2), the process capability index (PCI)

The assessment criteria of process capabilityis shown in Table 4.44, 45 As can be seen, when
Assessment criteria of process capability.

As the assessment criterion of process capability shows, the reasonable range of PCI can be assumed to be from 1.0 to 1.33. 46 Based on this range, according to the mathematical relationship between process capability index and dimensional tolerance shown in equation (14), the dimensional tolerance T corresponding to the different reliability can be obtained again in Table 5.
Maximum allowed dimensional tolerance with 3rd process capability level.

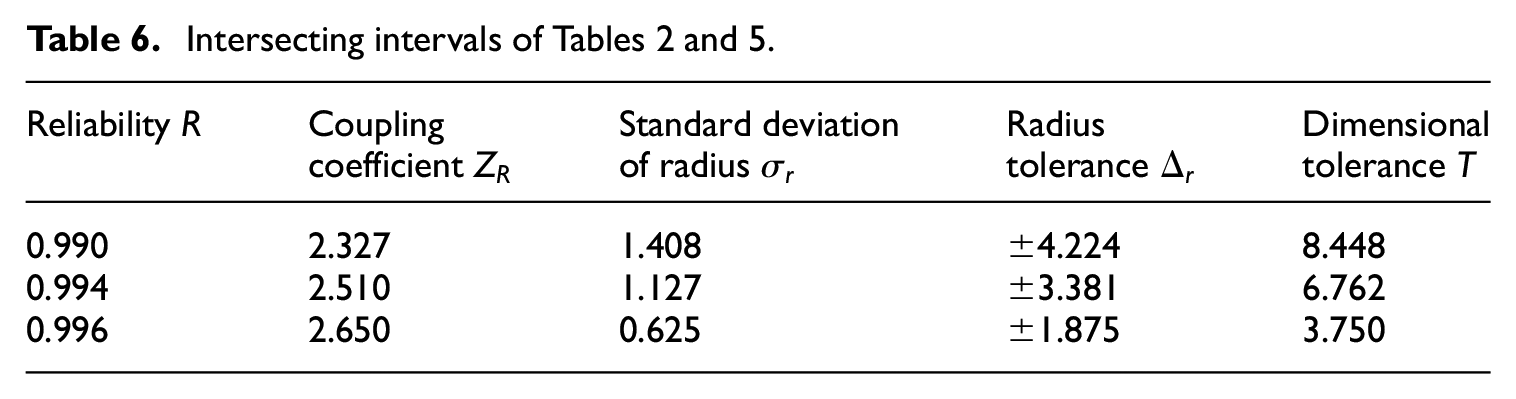
The intersecting intervals of Tables 2 and 5 can be obtained in Table 6. Under the constraint of PCI range and maximum reliability, the shaft radius tolerance is
In this paper, the functional relationship of cost and tolerance is proposed as follows:

According to T = 3.522 mm, T = 3.750 mm and equation (16), the manufacturing cost with and without the limited PCI range can be calculated and compared in Table 7.
The comparison of the manufacturing cost.

As the Table 7 shows, the manufacturing cost is reduced by 10.904% after considering the reasonable range of PCI.
To improve the quality by the minimum manufacturing cost, quality loss model must also be established. The quadratic quality loss function proposed by Taguchi 47 is expressed as follows:

where
According to the Six Sigma Quality Management,

where
According to T = 3.522 mm, T = 3.750 mm and equation (18), if the quality loss coefficient k is known, the expected quality loss can also be calculated and compared. This section is not discussed in detail in this paper.
Process capability is a degree of quality stability during the manufacturing process. Through the reasonable PCI range and tolerance design, the manufacturing cost is reduced and the quality loss is discussed. According to the example above, the frequency histogram and fitting distribution curve of shaft diameter size are obtained which shown that the diameter size of transmission shaft indeed approximately follows the normal distribution. The manufacturing cost was then calculated by utilizing the reciprocal power model of cost and tolerance with a 10.904% cost reduction. Thus, it lays the foundation to further study the relationship between manufacturing cost and quality loss.
Conclusion
This paper takes the automobile transmission shaft as the research object. Based on the minimum manufacturing cost and maximum reliability, the dimensional tolerance design is achieved through followings:
The paper presents a flow chart of shaft diameter tolerance design, for which the effectiveness was verified and can be the technical support when applying the tolerance design for other areas;
The paper provides a new approach for tolerance design while balancing the requirements of quality and manufacturing costs. The method considered the influence of most common quality factors such as the characteristic of product diameter, material, manufacturing process, and so on.
Thus, the approach presented in this study can be regarded as a proper method for the optimization of diameter tolerance. It provides a technical support for manufacturing cost and product quality control. Further studies can introduce some qualitive factors which are hard to measure such as safety to make the model more practical to the industry level.
Footnotes
Appendix
Declaration of conflicting interests
The author(s) declared no potential conflicts of interest with respect to the research, authorship, and/or publication of this article.
Funding
The author(s) disclosed receipt of the following financial support for the research, authorship, and/or publication of this article: This work is supported by the Program for the Research Fund for National Nature Science Foundation of China (NSFC 51675324).