
Abstract
The structural design of vehicles plays an important role in improving vehicle safety and driving performance. In this study, the frame structure of a van-type electric truck was taken as a research object. Stress, strain, and modal analyses of this frame structure were performed using Abaqus, a finite element software, to verify the rationality and safety of the structural design. The frame structure was optimized by numerical analysis. The fourth beam was moved 524 mm forward between the installation points of the power battery pack and the rear lifting lug of the front leaf spring. Results showed that the optimized frame bending, the full-load braking condition, and the full-load torsional operating condition stresses decreased by 44.499%, 23.364%, and 31.303%, respectively. The bending stiffness of an optimized frame increased by 4.026%, whereas the front and rear torsional stiffnesses increased by 4.442% and 4.092%, respectively.
Keywords
Introduction
With the rapid development of the automotive industry in recent years, numerous energy and environmental problems brought about by traditional internal combustion engines have become increasingly serious. At the same time, all-electric vehicles have become a breakthrough point to alleviate the pressure of urban energy and the environment. After years of exploration, China’s electric vehicle industry has made great progress. The design principles and performance optimization for the components used in different kinds of hybrid electric vehicles1,2 and electric vehicles3,4 are widely investigated. Specifically, to solve the problem of urban freight transport pollution, electric trucks are used more and more widely. At present, the frames of electric trucks are mostly transformed from the frames of internal combustion engine trucks. However, the power source of electric trucks primarily comes from electric motors and power battery packs. As such, its power source is different from that of traditional internal combustion engine trucks. Their external vibration exciters are also different. Generally, the frame quality of internal combustion engine vehicles is large. Such a large quality seriously affects the driving mileage of electric vehicles. Therefore, the frame of all-electric trucks should be studied to verify the rationality and safety of their design.
A practical device was designed by changing the restraint parameter test 5 and verified by finite element analysis method to test the bending and torsional rigidities of the body-in-white. A method, 6 for predicting the fatigue strength of the chassis of a semi-heavy truck when designing and optimizing, was proposed. The fatigue strength of the chassis and the welded connection of the vehicle were predicted using this method. On the basis of the three-dimensional (3D) 7 displacement of the motion capture system, the vehicle frame was subjected to bending and torsional load tests. The measurement results of the system were compared with those of existing linear transformers, inclinometers, and other sensors. The stiffness of the car was estimated accurately. The finite element algorithm 8 was used to analyze the force and predict the life of the front axle for vertical and braking loading case. A method for progressive forming of automotive structural parts based on DP980 was proposed on the basis of the finite element analysis method, 9 including the parameter optimization and multi-stage mold compensation methods. In the finite element simulation, the Yoshida–Uemori model was used to predict the rebound phenomenon accurately. The finite element simulation and Taguchi methods were used to optimize the key parameters affecting the rebound behavior. In addition, vehicle crash safety analysis and research were performed by the finite element method.10,11
A static and transient dynamic finite element model of the five-link 12 rear axle was constructed. A practical method for studying the vertical bending fatigue of the five-link rear axle housing was also proposed in combination with the experimental results. The results verified the rationality of the model. The finite area analysis was used to determine the dangerous area of the front axle of the vehicle. Then, the fatigue life of the front axle of the vehicle was affected by the working conditions through combined fatigue simulation of multiple operating conditions. Finally, the fatigue life prediction of the front axle containing cracks was performed. 13 Fluent software was used to analyze the impact of different tire widths and ground clearance on the aerodynamic performance of the vehicle. The objective is to improve the fuel economy of the vehicle and provide a reference for the body shape design. 14 The mathematical model of the hybrid vehicle powertrain system was established; the established Matlab–Simulink hybrid vehicle model was verified by data. 15 A numerical analysis was performed on the hood expansion to improve the cooling effect of engine-related components in the cabin. 16 After using Catia V5 to extract the frequency of the conventional viscoelastic damping roof, the roof was analyzed with Abaqus software. The results showed that the viscoelastic car roof revealed good noise, vibration, and harshness characteristics. 17 The research works relative to the stress sensitivity and optimization of beam elements are very important for the design of the vehicle. 18 The fatigue analysis tools 13 in the software were used to analyze vehicle strength and fatigue life, and the danger zone of the beam was determined. The maximum stress, strain displacement, and fatigue strength of the carriage frame were obtained by using Ansys software; 19 with virtual fatigue simulative analysis, the information can predict the fatigue life.
The above literature has provided many descriptions of the frame structural analysis of the traditional internal combustion engine passenger vehicle. However, the frame structural analysis and optimization of the new energy van-type electric truck were insufficient with the rapid development of new energy vehicles in recent years. Therefore, the current research aims to study the frame structure of the light van-type electric truck, which is often modified by the traditional internal combustion engine vehicles. In addition, this study aims to optimize the frame structure to make it suitable for the requirements of various operating conditions under electric driving.
Simulation model of the frame
Geometric model of frame structure
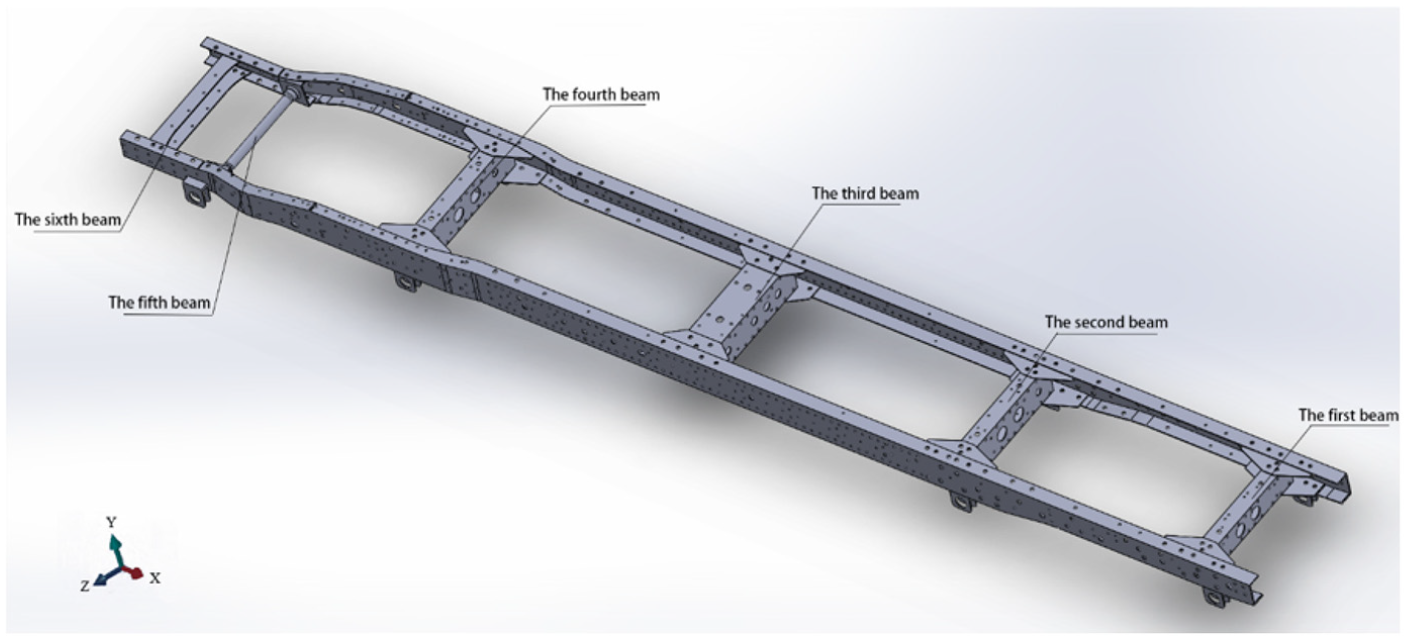
A van-type all-electric truck manufactured by Kunming Bus Manufacturing Co., Ltd, is taken as the research object. The traditional internal combustion engine is replaced with an electric motor, and the power battery pack is used as a powertrain. Therefore, the frame bears power battery pack, the weight of the transmission, steering and braking systems, cargo boxes and cargo, and cab. The frame of the car is a side-beam frame, and the length, width, and height are 5768, 700, and 120 mm, respectively. The wheelbase is 3981 mm. Figures 1 and 2 show the front and top views of the frame, respectively.

Dimension parameter diagram of the main view of the frame.

Dimension parameter diagram of the overhead view of the frame.
The coordinate system is determined to reduce the difficulty of changing the coordinate system when creating the frame finite element model and save the modeling time, as follows: the X-axis negative direction points to the vehicle forward direction, the Y-axis positive direction points to the vertical upward, and the Z-axis positive direction points to the driver left side. The 3D geometrical model of the frame structure is established by Sildworks by measuring the geometric parameters of the frame, as shown in Figure 3.

Geometric model of frame structure.
Meshing
The type of grid cell has a great influence on the quality of the finite element model and the accuracy of the analysis. The two longitudinal beams and four crossbeams (the first, second, third, and sixth beams) of the frame are stamped steel parts. The fifth beam is a cylindrical hollow beam structure, and the fourth beam and other connecting components are solid rectangular structures. Therefore, 3D shell elements are used for meshing the longitudinal beams, for hexahedral elements with high calculation accuracy and rapid calculation speed. The rectangular beam structures of the modified quadratic tetrahedron element (C3D10M) have less influence on the stress and deformation distribution of the frame. Thus, C3D10M is selected for meshing six crossbeams and connecting components.
The unit sizes of the two longitudinal beams and the six crossbeams and the connecting components are 20 and 10 mm, respectively. The grid size of the partial position of the joint of the crossbeams and longitudinal beams is manually refined to improve the grid quality, and the unit size is 5–8 mm. The meshing results are 116,569 elements and 246,713 nodes; of which, hexahedral and tetrahedral elements account for 82.34% and 17.66%, respectively.
Connected simulation
The spring unit Cartesian, rigid connection unit MPC184, and rigid beam unit CBEAM in Abaqus are used to simulate the suspension system of the vehicle. The multi-point restraint unit MPC184 is used to simulate the riveted connection, whereas the beam unit BEAM188 is used to simulate the rivet. A support point is drawn at the lifting lug to establish a connection between spring element Cartesian and a rigid beam element CBEAM that simulates the support of leaf spring in the vertical direction.
The leaf spring is idealized into a rigid beam unit and a spring unit, and they are combined to simulate suspension system, as shown in Figure 4. Figure 5 depicts the connection between vertical spring unit at the lifting lug and the rigid beam unit that simulates the leaf spring support.

Combination of rigid beam and spring elements to simulate the suspension system: (a) suspension spring connection and (b) suspension spring simulation.
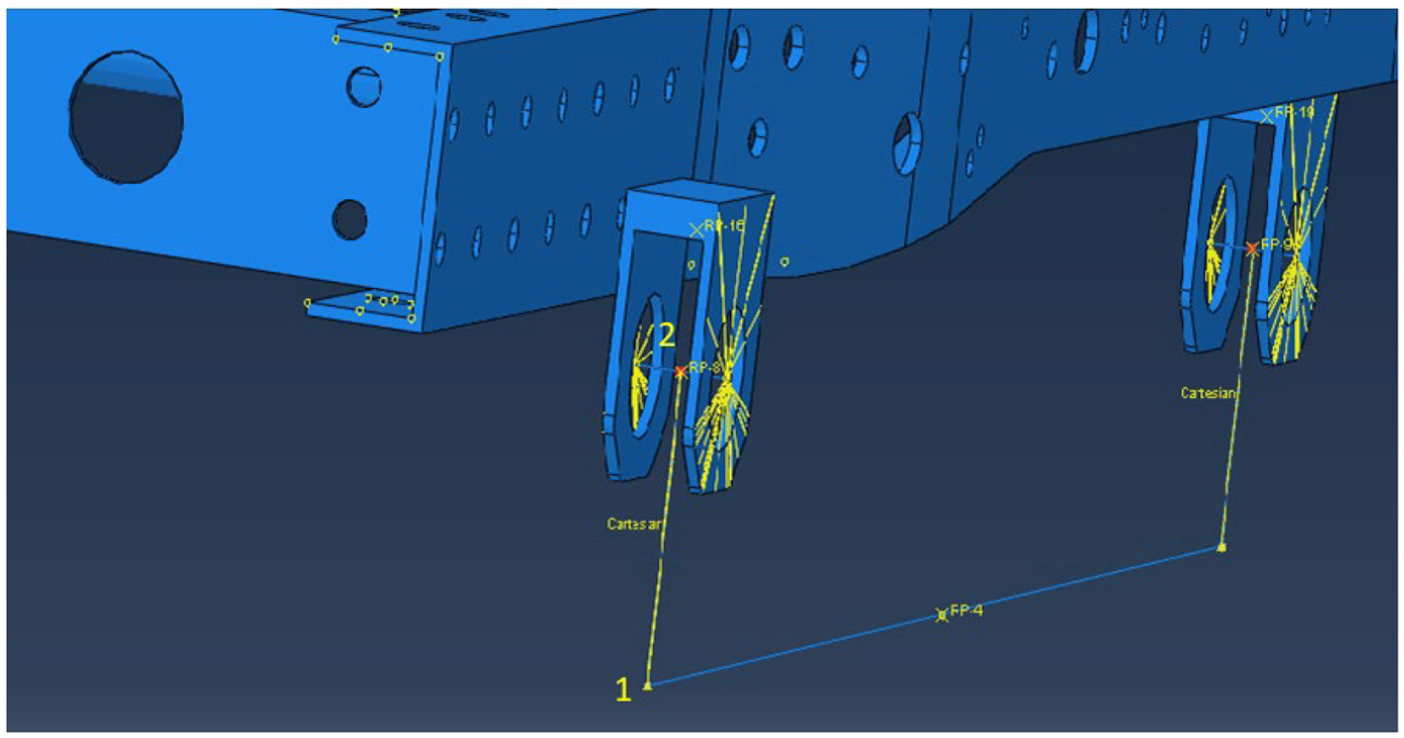
Connection mode of leaf spring and lifting lug.
Following the calculation formula of leaf spring stiffness, the calculation formula of spring element stiffness is obtained 20

where
Parameters of leaf spring.

The actual width of the leaf spring in this study is 70 mm, and its thickness

where
The relevant parameters of the leaf spring used in the vehicle are calculated by equation (1). The stiffness of the front suspension leaf spring is approximately 192 N/mm, whereas that of the rear suspension leaf spring is approximately 260 N/mm. Taking the relevant parameters into equation (2), the equivalent thickness of the front and rear leaf springs can be calculated as 17 and 35 mm, respectively.
The all-electric truck frame and suspension system used in this article are 16 Mn, with a carbon content of 0.1%–0.25%. The major alloying elements are manganese (Mn), silicon (Si), vanadium (V), niobium (Nb), and titanium (Ti). The 16 Mn has good comprehensive performance, such as good low-temperature performance, cold stamping performance, welding performance, and machinability. Table 2 shows its material and mechanical properties. In Abaqus numerical simulation, the characteristics of the materials should be created on the basis of material actual properties. Then, the material attributes are assigned to the corresponding structural parts.
Material and mechanical properties.

Applied load
The loads imposed on the frame include power battery packs, electric motors, transmission systems, steering and braking systems, cargo boxes, and cabs. The rated carrying capacity of the truck is approximately 915 kg. The weight of each passenger is 75 kg, and the actual load of the truck is 80% of the rated load. The weights of non-load-bearing and functional parts are added on the frame by modifying the material density appropriately. The loading modes of the frame in the finite element model are as follows:
The weight of the frame is obtained by setting the acceleration of gravity. The direction is vertically downward along the Y-axis and g is taken as 9800 mm/s2.
The weights of the motor, electronic control system, and transmission system are simplified as a concentrated load on the frame. The direction is vertically downward along the Y-axis.
The weights of the power battery pack, driver’s cab and occupants, steering and braking systems, cargo, and carriages are simplified as an even load on the frame. The direction is vertically downward along the Y axis.
Following the above principles, Table 3 shows the load and loading method of the frame, and Figure 6 depicts the distribution of each part.
Loads on frames and their loading patterns.

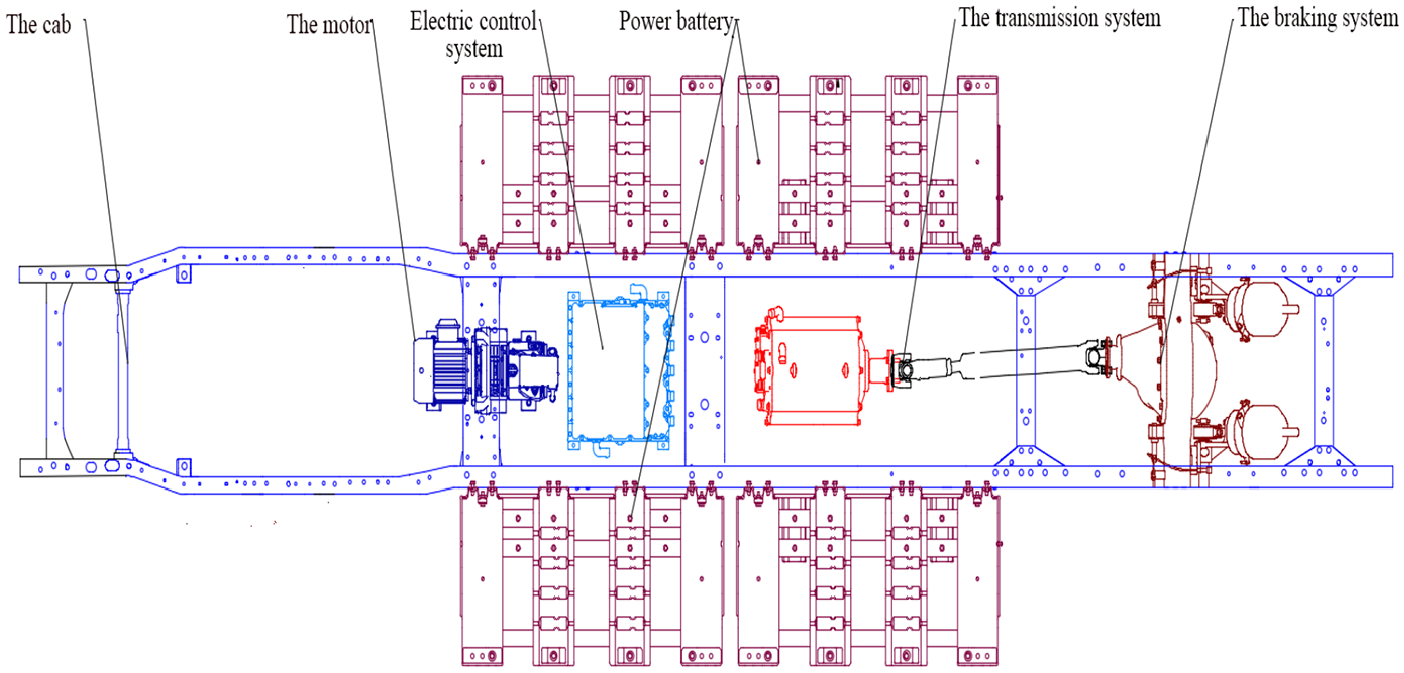
Frame load distribution.
Working condition selection
The frame travels under different working conditions and generates different forms of a load. Four typical working conditions are used for finite element analysis of the frame: including full-load bending, torsion, braking, and turning.
In the case of full-load bending, the vehicle is affected by gravity. Therefore, under this working condition, the frame is subjected to symmetrical vertical loads. Its overall bending deformation is expressed by maximum deflection bending stiffness 22 as follows

where
In the case of full-load torsional, torsional deformation is generated by road undulations. The frame under this condition is subjected to obliquely symmetrical vertical loads. Its average torsional stiffness

where
In the case of full-load braking, the operating condition is simulated by applying acceleration, that is, opposite to the driving direction of the vehicle as follows

where
In the simulation of full-load turning, the operating condition is simulated by applying lateral acceleration
Frame finite element model
After setting the element type and size, the frame is meshed, and the mesh quality is checked. Then, a uniformly distributed load is applied on the upper surface of the frame vertically downward. The actual load position and the concentrated load are linked using coupling constraints. The connection of the suspension and the frame is simulated, and material attributes are assigned to the model. Finally, a finite element model of the frame is generated, as shown in Figure 7.
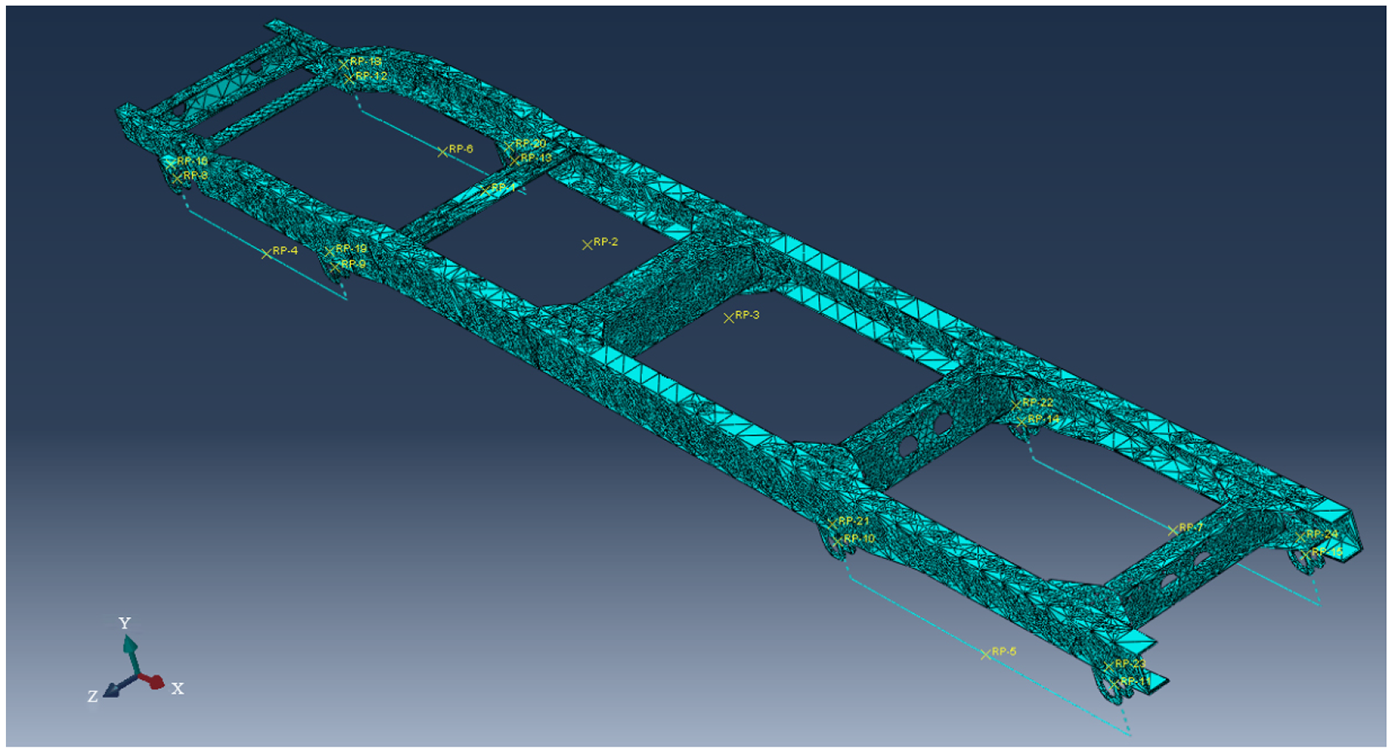
Frame finite element model.
Finite element static analysis of frame model
The strengths and stiffnesses of the frame of a van-type all-electric truck during the driving in four typical working conditions can be calculated.
Full-load bending condition
The boundary conditions of the frame need to be set to simulate the actual operating conditions of the vehicle as realistically as possible. Hence, the constraint position is set at the position where the axle and suspension spring are connected, that is, the midpoint of the rigid beam in the finite element model.
The boundary conditions of the frame under full-load bending conditions are set in accordance with the actual situation, as shown in Table 4.
Boundary conditions for full-load bending condition.

The finite element model under full-load bending conditions is submitted to the solver Abaqus/Standard for calculation. Figure 8 shows the stress distribution cloud diagram of the frame under full-load bending conditions. The maximum stress occurs at the connection between the fourth and the longitudinal beam and between the cab and the power battery pack installation points. The maximum value is 265.4 MPa. Because the weights of motor, driver’s cab, container and cargo are applied to this section, the fourth beam is a thin rectangular beam, and the distance between the fourth beam and the fifth beam is relatively far, the stress concentration occurs in this section. Other locations with greater stress are mainly concentrated in the sections where the power battery is installed, mainly because of the larger mass of the battery.

Stress cloud diagram of the frame under full-load bending conditions.
Figure 9 depicts the strain distribution cloud of the frame under full-load bending conditions. The maximum displacement occurred in the middle position of the fourth beam, and its value is 13.08 mm. This is obviously that the fourth beam not only bears the weight of power battery pack but also shares the weight of container and cargo. Besides, the displacement of each node of the frame includes the compression of the leaf spring and the bending deformation caused by external load.

Displacement cloud diagram of the frame under full-load bending conditions.
Full-load torsion condition
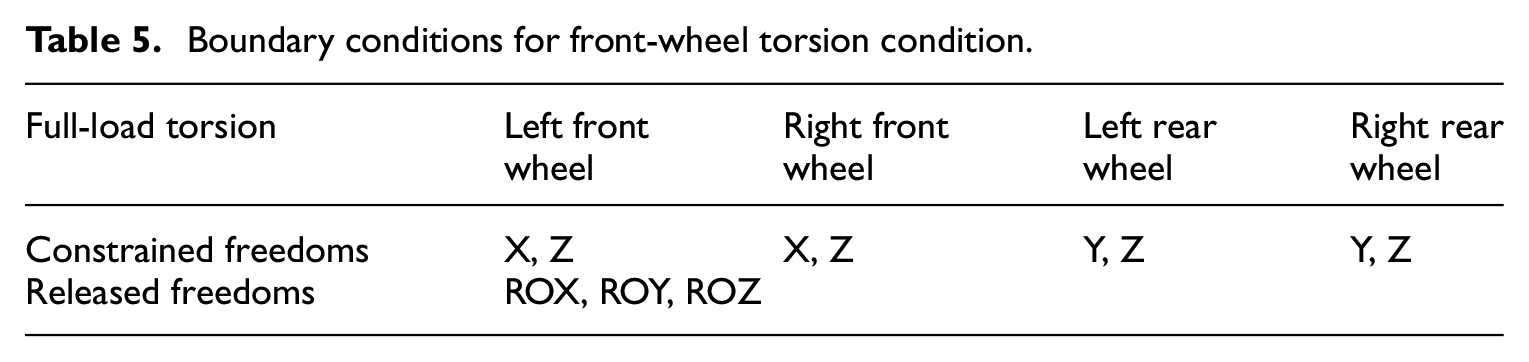
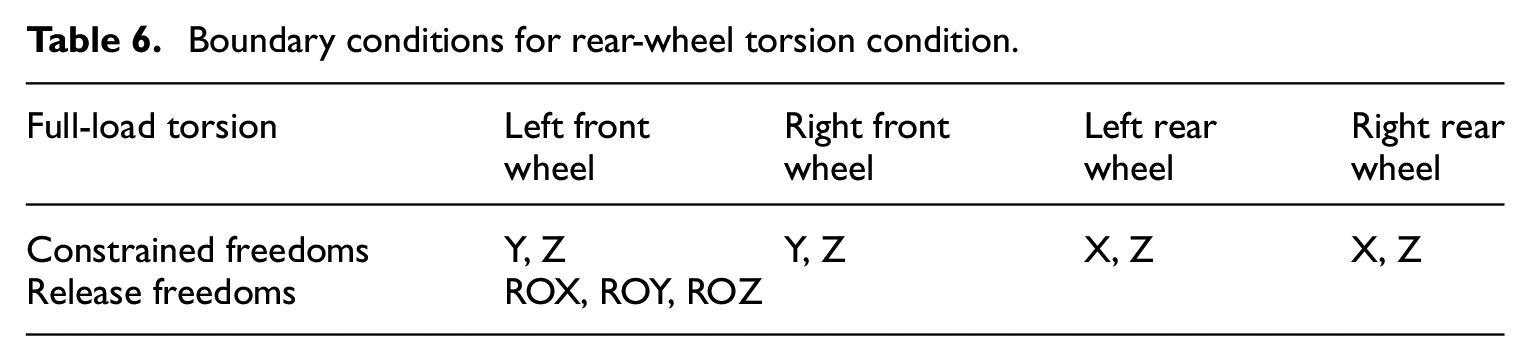
This working condition is simulated by raising one wheel and lowering the other wheel. At the same time, the front and rear wheel torsion simulations are performed on the frame. The left front wheel applied a displacement of 40 mm in the positive direction of the Y-axis and another displacement of 40 mm in the right front wheel in the negative direction of the Y-axis. The left and right rear wheels are applied with the same torsion conditions as the front. Boundary conditions for front wheel and rear wheel are shown in Tables 5 and 6.
Boundary conditions for front-wheel torsion condition.
Boundary conditions for rear-wheel torsion condition.
The maximum stress of the front wheel is 262.7 MPa, which occurs at the connection point of the left longitudinal beam and the front lifting lugs of the front leaf spring. At the position where the right longitudinal beam connected to the lifting ears, and the junction point between the lifting lug and the front leaf spring, a large stress is generated, and the maximum value is 186.3 MPa. Because the left front wheel and the right front wheel result in forced displacement in the opposite direction, the load is increased in the connection of frame and leaf spring.
The maximum displacement occurs at the upper part of the connection between the right-side longitudinal beam and the front leaf spring, and the value is 51.06 mm. The amount of compression of the right front leaf spring and the forced displacement of the right front wheel is 40 mm, and the deformation of the frame is included. From the perspective of the overall deformation of the frame, the large displacements are concentrated on the right side of the frame. Because the left front wheel has an upward forced displacement, while the right front wheel has a downward forced displacement, the center of the truck shifts to the right side, and the load is concentrated on the right side at the same time.
The maximum stress of the rear wheel under the torsion condition is 281.3 MPa, which occurs at the position where the left longitudinal beam is connected to the rear lifting lug of the rear leaf spring. Because the forced displacement of the left rear wheel is upward and the forced displacement of the right rear wheel is downward, the load at the lifting lug connected with the frame and leaf spring increases.
The maximum displacement of the rear wheel under the torsion condition occurs in the upper piece of the connection point between the right-side longitudinal beam and the rear leaf spring, and the value is 51.72 mm. The following three sections are included: the compressed amount of the right rear leaf spring, the forced displacement of the right rear wheel of 40 mm, and the amount of deformation of the frame. This is also due to truck center shifts to the right direction, and the vehicle load is concentrated on the right side as well.
Full-load braking condition
In the study, all-electric truck is driven on urban asphalt or concrete roads. The road adhesion coefficient is taken as 0.8. Therefore, an acceleration of 0.8 g is applied in the positive direction of the X-axis.
The boundary conditions of the frame under full-load braking condition are set in accordance with the actual situation, as shown in Table 7.
Boundary conditions for full-load braking condition.

The maximum stress of the frame under full-load braking is 152.8 MPa. This condition occurs at the connection point of the following: between the left side beam and the rear connecting lug of the front leaf spring, the left- and right-side beams to the lifting lug of the rear leaf spring, and the installation site of the power battery pack. Because these areas bear the weight of driver’s cab, battery pack, cargo box, and cargo at the same time, as well as the action of inertial force during emergency braking, the gravity center of the cab shifts backward, causing these positions bear more load and a greater stress concentration occurs.
The maximum displacement of the frame under full-load braking occurs at the rearward position of the fourth crossbeam, with a displacement of 6.405 mm. The compression of the leaf spring and the bending deformation of the frame caused by the applied load are included.
Full-load turning condition
The lateral acceleration is 0.6 g, and the longitudinal acceleration is 0.4 g. Hence, an acceleration of 0.4 g is applied in the positive direction of the X-axis, whereas an acceleration of 0.6 g is applied in the negative direction of the Z-axis. The boundary conditions of the frame under the full-load turning condition are set in accordance with the actual situation, as shown in Table 8.
Boundary conditions for full-load turning condition.

The maximum stress position of the frame under the full-load turning condition occurs at the lower piece of the connection point between the right longitudinal beam and the third crossbeam. The stress value is 188.8 MPa. The low piece of the connection point of left longitudinal beam and the third transverse beam also generate a large stress, and the stress value is 164.5 MPa. Other locations with large stress values are concentrated at the positions of the left and right longitudinal beam points where the power battery is installed.
Under the full-load turning conditions, the maximum displacement of the frame occurs at the rearward position of the fourth crossbeam. The displacement is 9.152 mm. The maximum displacement includes the compression of the leaf spring and the deformation of the frame caused by the applied load. During the process of right turning, the vehicles’ center of gravity will shift to the right, which causes the right side of the frame to bear a larger load. Therefore, a large displacement occurs at the right side, mainly focused on the middle right of the third and fourth beams and the connection point between the battery pack installation position of the right longitudinal beam and the third beam.
Bending stiffness analysis
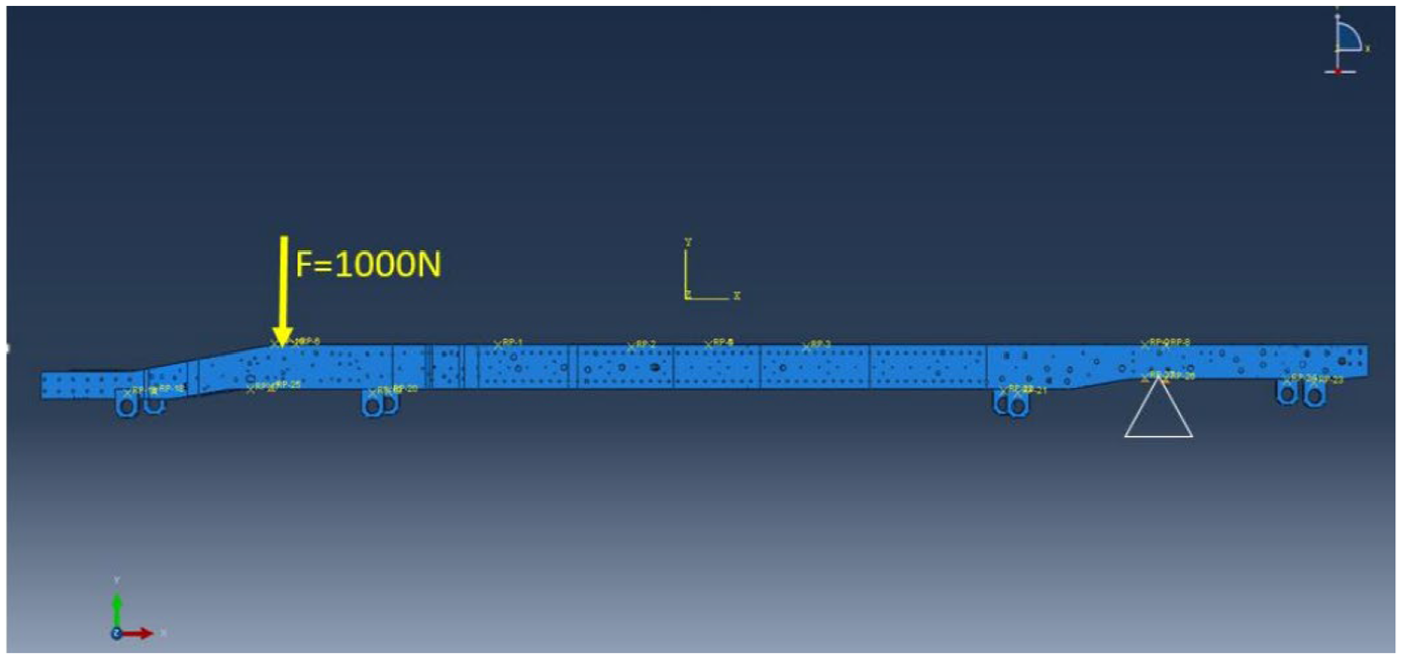
The frame bending stiffness can be calculated by the frame bending stiffness test method. 23 The frame is simplified to a simple-supported beam structure, as shown in Figure 10. Translation constraints in the Y direction to the nodes are added at the vertical projection positions of the front and rear axles on the left and right longitudinal beams. A vertical downward concentrated force F = 1000 N is also added at the midpoint of the front and rear constraint points on the longitudinal beam. A 500-N concentrated force is applied to longitudinal beams at the same time. The stiffness is calculated in accordance with the deflection caused by the bending deformation of the frame. Figure 11 shows the boundary condition setting and loading of the frame.

Schematic diagram for calculating bending stiffness of the frame.

Boundary conditions for calculating bending stiffness of the frame.
The calculation formula of the frame bending stiffness is 24 as follows

where
Figure 12 shows the results of the bending deformation of the frame. The maximum deformation of the concentrated force acting point is 0.2849 mm, whereas the horizontal distance between the front and back restraint points was 3981.5 mm. Therefore, the bending stiffness of the frame is calculated as
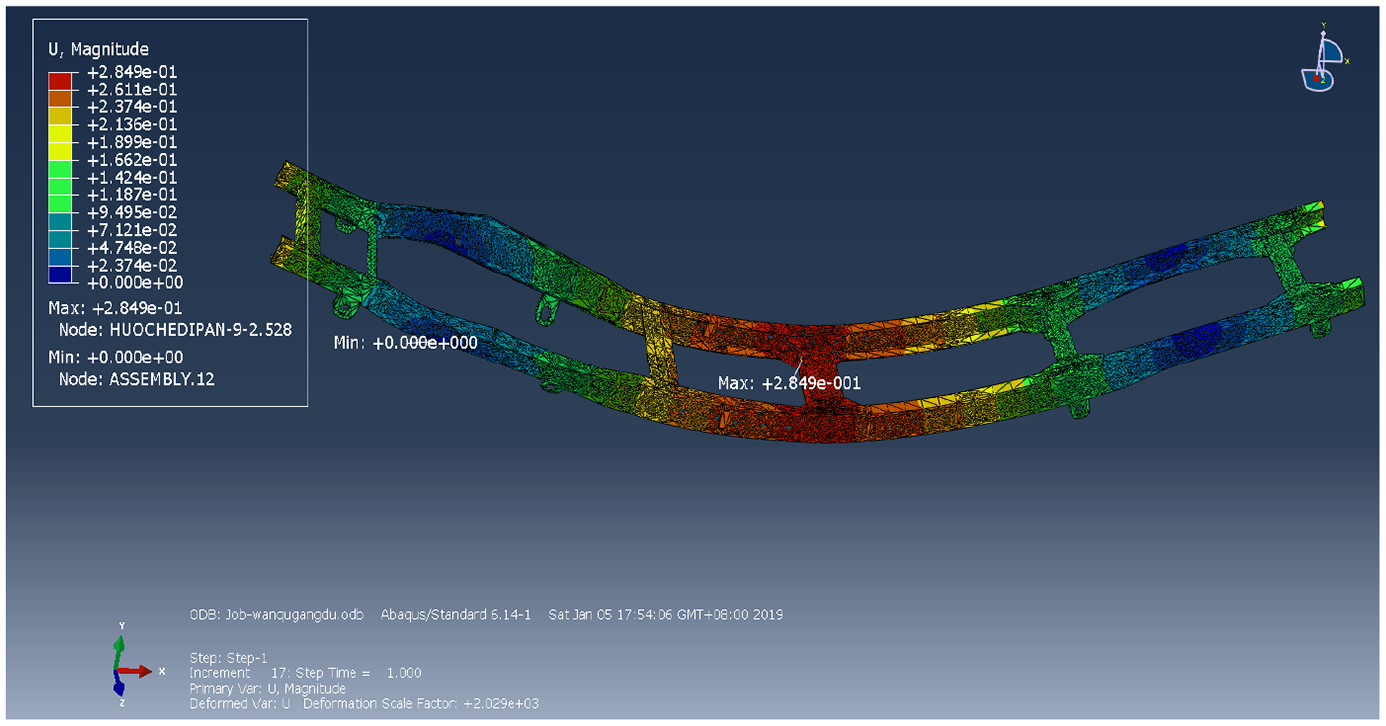
Bending deformation diagram of the frame.
Frame torsional stiffness
In the vertical projection position, a translational constraint in the Y direction is applied to the nodes on the right longitudinal beam of the front axle as well as on the rear axle on the left longitudinal beam. Then, a vertical downward concentrated force F = 1000 N is applied to the front axle on the left longitudinal beam of the frame at the same position. The torsional stiffness of the front of the frame can be calculated. Applying a vertical upward concentrated force F = 1000 N at all nodes of the rear axle at the vertical projection position on the right longitudinal beam, the torsion stiffness of the rear of the frame can be calculated as well. Figures 13 and 14 depict the boundary condition setting and loading of the front and rear torsional stiffnesses of the frame, respectively.
Boundary conditions for calculating torsional stiffness of the front frame.

Boundary conditions for calculating torsional stiffness of the rear frame.
The calculation formula of the frame torsional stiffness is as follows25,26

where
The vertical distance between the left and right constraint points is

The maximum deformation at the front of the frame is 8.502 mm, and the vertical distance between the left and right restraint points of the frame is 680 mm. The torsional stiffness of the front of the frame is calculated as 5.44 × 10⁴ N m/rad.
The maximum deformation at the position where the concentrated force acts, at the rear of the frame, is 8.426 mm, Then, the corresponding torsional stiffness is calculated as CT = 5.49 × 10⁴ N m/rad using equation (7), and the results are shown in Table 9.
Bending stiffness and torsional stiffness of the frame.

In comparison with the related literature,24,27 when a concentrated load of 1000 N is applied at the axle position, the deflection of the concentrated force acting point is 8.8–13.94 mm in this study. Therefore, the frame in this study has good bending stiffness and torsional stiffness, possibly meeting the requirements of vehicle use.
Finite element dynamic analysis of the frame structure
The finite element modal analysis of the frame is used to simulate the instantaneous dynamic response of the wheel when passing through uneven roads and to evaluate the dynamic characteristics of the frame.
Free modal analysis
Modal analysis can be divided into free and constrained modal analyses. Free modal analysis refers to the analysis of the natural frequency and mode of the frame without any external constraints. Moreover, constrained mode analysis pertains to the analysis of the natural frequency and mode of the frame under the actual constraints. The actual operating conditions of the vehicle are complicated. Hence, the boundary conditions of the frame in the actual driving process are difficult to define. Therefore, the free mode analysis of the truck frame under the unconstrained state is performed in this section. Table 10 shows the first ten-order natural frequencies.
Natural frequencies and mode shapes of the first ten modes of the frame.

Frame free modal results analysis
The maximum working frequency of the main reducer and transmission system of all-electric trucks is approximately 8.5 Hz. The frequency of the wheel unbalance excitation is generally lower than 9 Hz. The electric truck runs on urban roads. The road surface vibration of highways and general urban road surfaces is less than 3 Hz, whereas the frequency of imbalance vibration of the drive shaft is approximately 46 Hz. 28
Table 10 shows that the natural frequency of the all-electric truck frame studied in this article is 9.89–86.22 Hz. The frame avoids the above-mentioned main external vibration frequency, and no resonance phenomenon occurs. However, the frequency of the fifth-order mode is 48.043 Hz (as shown in Figure 15), which is close to the frequency of the unbalanced vibration of the drive shaft. The longitudinal beams between the fourth and fifth beams and the fourth beam may undergo severe deformation.

(a) Fifth-order mode shape and (b) sixth-order mode shape.
Frame transient dynamic calculation
The transient response of the frame’s stress and displacement when the vehicle passes through a small slope at a speed of 36 km/h is simulated. In the simulation, a progressive method is used to apply displacement excitation to the front wheel suspension. The simulated slope height is 20 mm, and the duration is 0.25 s. The type and magnitude of the load applied on the frame are consistent with the conditions under the full-load bending conditions during static analysis. Figure 16 depicts the displacement excitation curves.
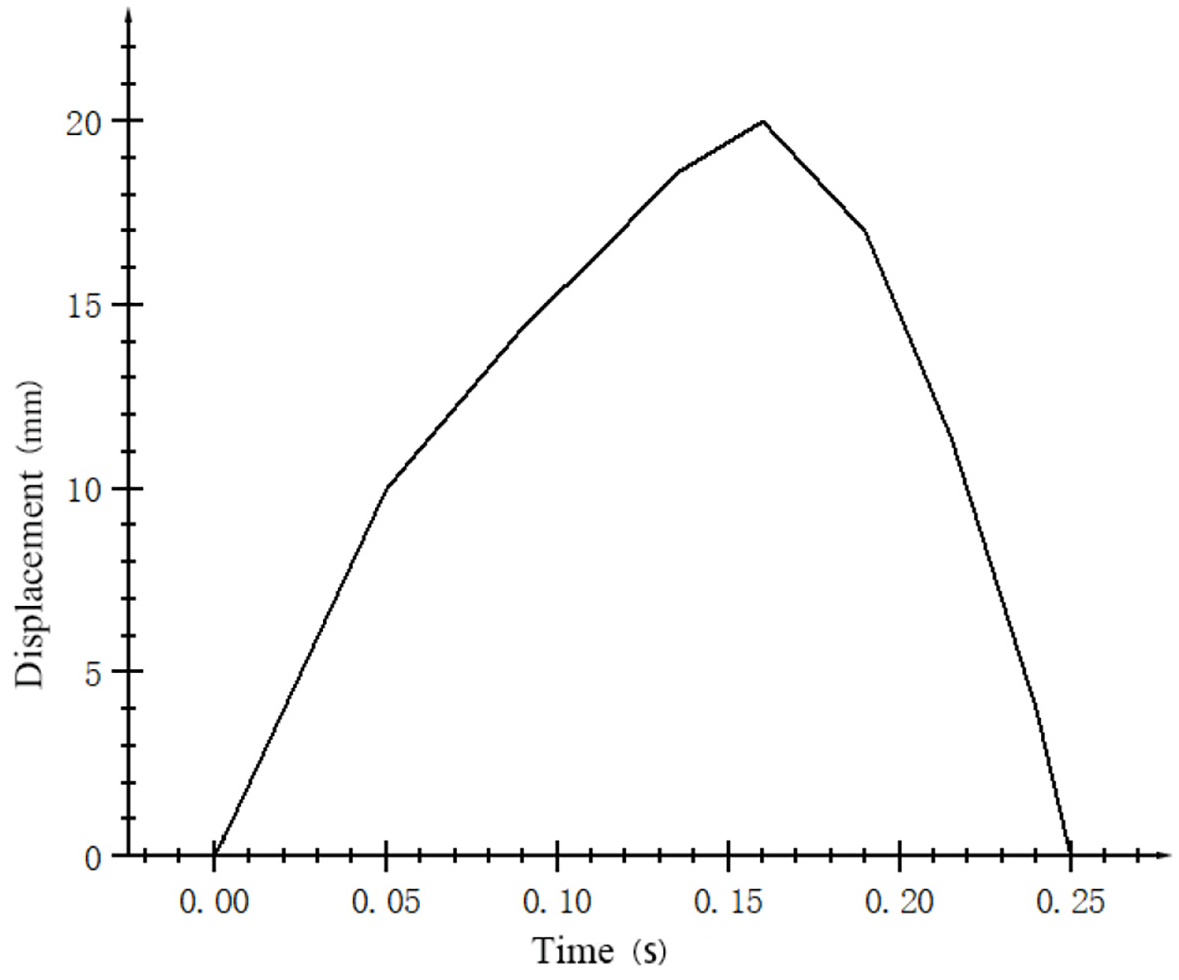
Road displacement excitation curve.
After analysis and calculation, an average of six nodes is sequentially selected in accordance with the length of the longitudinal beam. The displacements and stresses of these nodes are then researched. Figure 17 shows the selection of nodes on the longitudinal beam.

Location of node selection on the longitudinal beam.
Frame instantaneous dynamic response
On the basis of the node displacement response curve, the change trends of the displacement curves of the first three nodes are the same as those of the applied displacement excitation curve. The maximum time of their displacement is approximately 0.16 s. The maximum values are 19.75, 20.82, and 19.08 mm, respectively. The maximum displacement time of node 4 is approximately 0.21 s. The displacement change of node 5 appears a contrary trend, its maximum displacement is 3.23 mm, and its occurrence time is approximately 0.16 s. Node 6 is located at the back of the vehicle, its displacement changes are small, and almost no fluctuation occurs. As shown in the node stress change curve, the maximum stress appears at node 2, reaching 220.6 MPa. In addition, the maximum stresses appear the time of six nodes are all approximately 0.16 s, which is the same as the time when the maximum displacement excitation occurred. Figures 18 and 19 show the displacement and stress curves of each node, respectively.
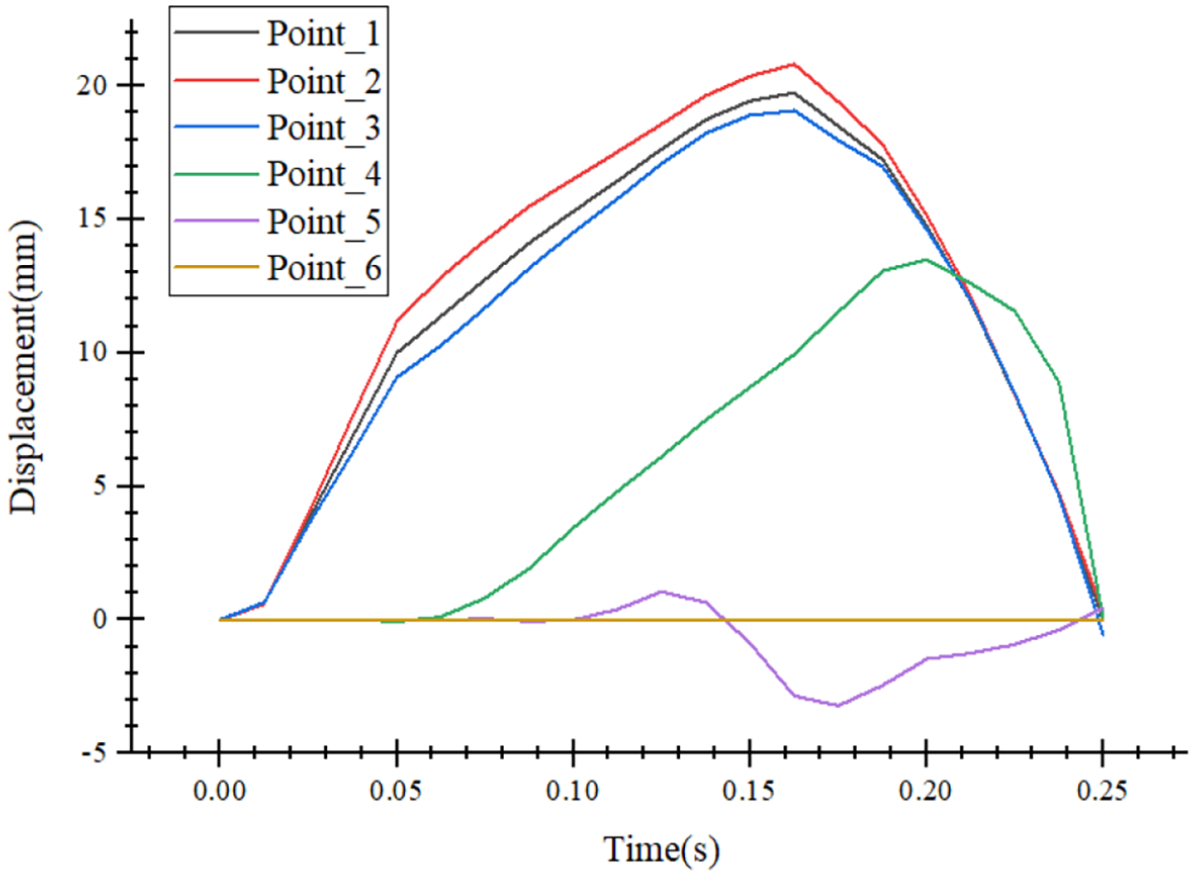
Response curve of node displacement on the stringer.

Stress response curve of the joint on the stringer.
Exploration of frame structure improvement
From the modal analysis of the frame, the longitudinal beam between the fourth and fifth crossbeams might undergo severe deformation. The fourth beam is a simple thin plate structure. In addition, the distance between the fourth beam and the fifth beam is long. Moreover, the installation position of the fourth beam is close to the connection position between the vehicle cab and the power battery pack installation point. This section needs to withstand the weight of pilothouse, power battery pack, cargo box, and cargo. Hence, the stress of the fourth crossbeam and the longitudinal beam joint point, at the between the cab installation point and the power battery pack installation point, becomes large. Consequently, large displacement and severe vibration appear between the fourth beam and the rear lifting lug of the leaf spring.
Therefore, the fourth beam is improved using a channel steel beam structure similar to other beams, with a thickness of 5.5 mm. The fourth crossbeam is moved forward (toward the fifth beam) by 524 mm, between the power battery pack installation point and the rear leaf spring installation point of the front leaf spring. The objective is to improve the stiffness of the front portion of the frame. Figure 20 depicts the improved geometric model of the frame structure.
Geometric model of the modified frame.
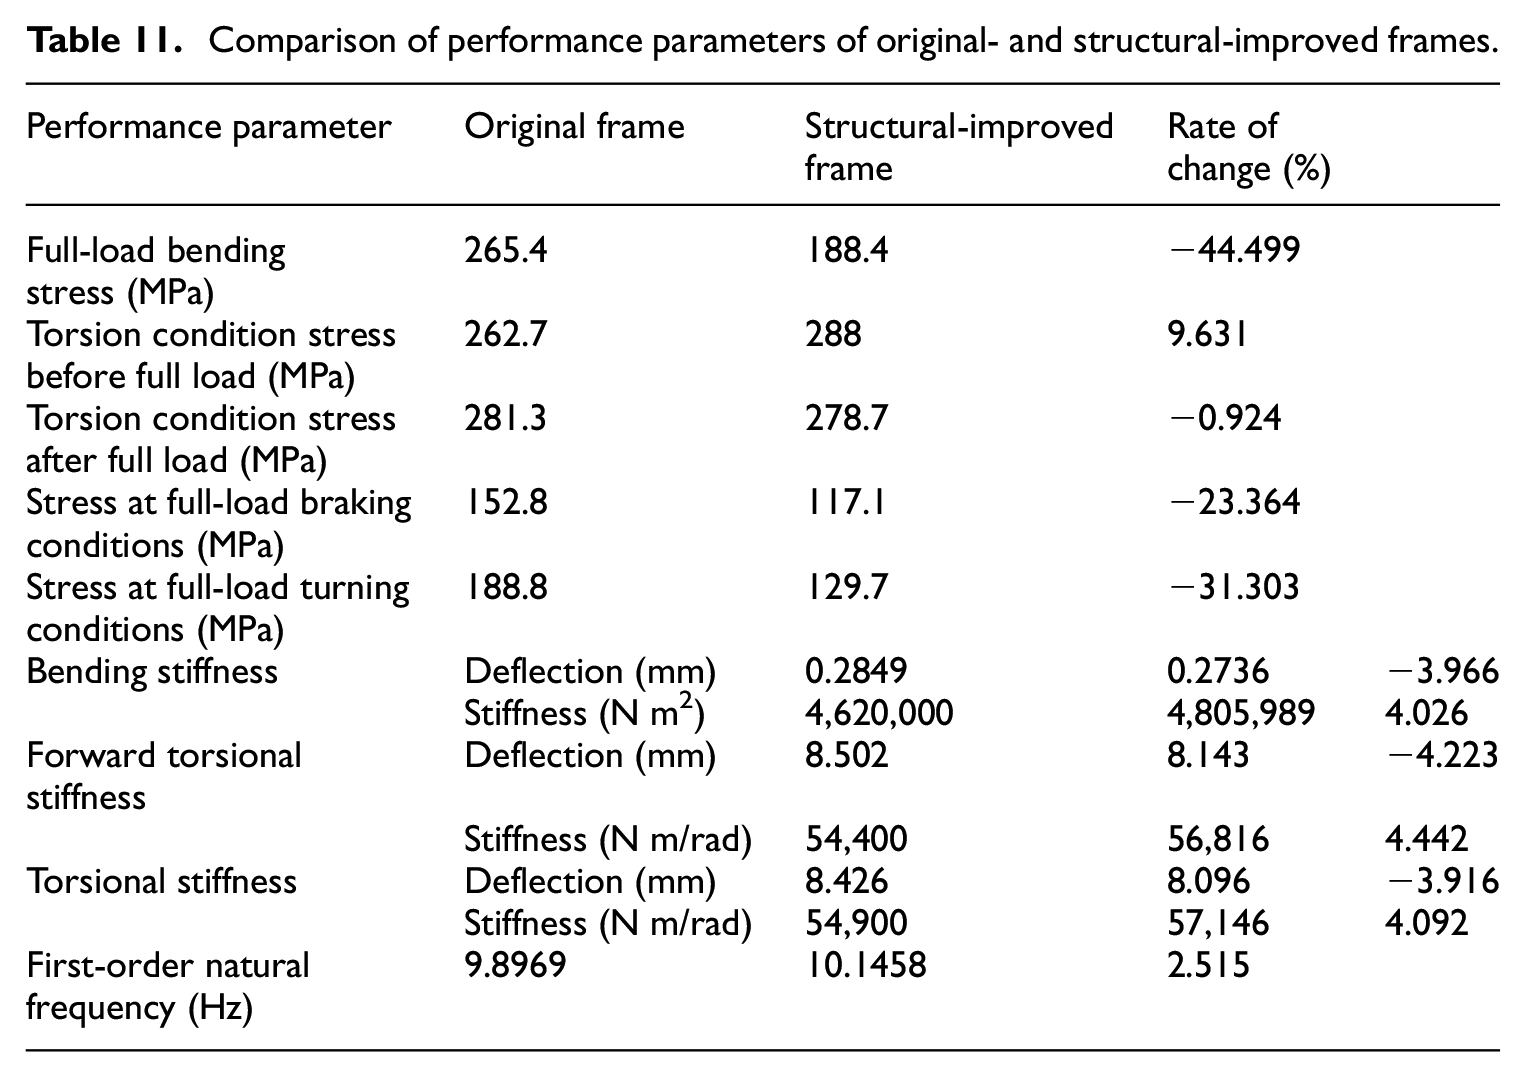
As shown in Table 11, the improved frame structure is analyzed using the finite element analysis method described above. The results show that the maximum stress is 147.3 MPa, and the maximum displacement is 9.843 mm under full-load bending conditions. These values are significantly lower than those of the original frame. They all occur at the connection position of the third crossbeam and the longitudinal beam. Under the front torsion condition, the frame stress increases by 9.631% at the connection between the left side longitudinal beam and the rear lifting ears of the front leaf spring. Afterward, the maximum stress occurs at the connection position between the left side longitudinal beam and the rear lifting lug of the rear leaf spring under the rear torsion condition. However, this stress is reduced by 0.924%. Under the full-load braking conditions, the performance of the frame is significantly improved in comparison to that of the original frame. The maximum stress occurs at the connection position of the right-side longitudinal beam and the fourth crossbeam, and the value is 117.1 MPa. The maximum displacement occurs in the middle of the third beam, with a displacement of 5.527 mm. Under the full-load turning conditions, the maximum frame stress is 129.7 MPa, and the maximum displacement is 8.194 mm. They all occur at the position where the longitudinal beam is connected to the third beam. After the frame structure is improved, the bending stiffness is 4,805,989 N m2, which is 4.026% higher than that of the original frame. The front and the rear torsional bending stiffnesses are 56,816 and 57,146 N m2/rad, which is an increase of 4.442% and 4.092%, respectively. The first-order natural frequency of the frame improved is also increased to 10.793 Hz. The performance of the improved frame is significantly improved compared with the original frame.
Comparison of performance parameters of original- and structural-improved frames.
Conclusion
The frame structure of a van-type electric truck is taken as the research object. The stress, strain, and modal analyses of the frame are searched using Abaqus to verify the rationality and safety of its structural design. Then, the frame structure is optimized. The conclusions are as follows:
The maximum stress in each working condition is within the allowable stress range of the frame material, which can meet the requirements of the frame and has a large space that can be optimized. This result is found by analyzing the strength of the frame under four typical working conditions. However, the power battery pack, electric motor, electronic control system, and cab are concentrated in the front of the frame. Hence, the maximum stress and maximum strain of the frame under various operating conditions are concentrated at the adjacent position of power battery pack installation point and the cab fix point, including the fourth beam. Therefore, the structure should be improved.
With reference to the frame stiffness test method, the bending, torsional, and rear torsional stiffnesses of the frame are analyzed. The frame stiffness can meet the requirements of a vehicle driving by comparing the stiffness of the same type of frame in related literature.
The first ten-order natural frequencies and mode shapes of the frame are analyzed through the unconstrained free modal analysis. The frame avoids the external vibration frequency that the vehicle may be subjected to during driving, and no resonance phenomenon occurs. The instantaneous dynamic response is also analyzed to verify the accuracy of the frame simulation and the safety of the frame dynamic performance. However, the frequency of the fifth-order mode is close to the frequency of the unbalanced excitation of the drive shaft. Furthermore, the longitudinal beams between the fourth and fifth beams and the fourth beam may be severely deformed. The frame structure should also be improved to increase the stiffness.
The frame structure is improved by moving the fourth beam forward 524 mm to the installation point of the power battery pack and the rear lifting lugs of the front leaf spring. The stress of the improved frame is decreased by 44.499% under bending conditions. Moreover, the stress under full-load braking conditions is decreased by 23.364%. The stress under full-load turning conditions is decreased by 31.303%. Furthermore, the bending, front torsional, and rear torsional stiffnesses of the optimized frame are increased by 4.026%, 4.442%, and 4.092%, respectively, thereby reducing the deformation of the frame.
Electric vehicles have become a breakthrough point to alleviate the pressure of urban energy and the environment. Meanwhile, the structural design of vehicles plays an important role in improving vehicle safety and driving performance. The explorations of stiffness and displacement of frame about light van-type electric truck in the article provide a foundation to its light-weight design and research.
Footnotes
Declaration of conflicting interests
The author(s) declared no potential conflicts of interest with respect to the research, authorship, and/or publication of this article.
Funding
The author(s) received no financial support for the research, authorship, and/or publication of this article.