
Abstract
Colorectal cancer is one of the most prevalent noncommunicable diseases worldwide. 5-Fluorouracil is the mainstay of chemotherapy for colorectal cancer. Previously, we have demonstrated that high glucose diminishes the cytotoxicity of 5-fluorouracil by promoting cell cycle progression. The synergistic impact of rosiglitazone on 5-fluorouracil-induced apoptosis was further investigated in this study. Besides control cell lines (CCD-18Co), two human colonic carcinoma cell lines (HCT 116 and HT 29) were exposed to different treatments containing 5-fluorouracil, rosiglitazone or 5-fluorouracil/rosiglitazone combination under normal glucose (5.5 mM) and high-glucose (25 mM) conditions. The cellular oxidative stress level was evaluated with biomarkers of nitric oxide, advanced oxidation protein products, and reduced glutathione. The cell apoptosis was assessed using flow cytometry technique. High glucose caused the production of reduced glutathione in HCT 116 and HT 29 cells. Correspondingly, high glucose suppressed the apoptotic effect of 5-fluorouracil and rosiglitazone. As compared to 5-fluorouracil alone (2 µg/mL), addition of rosiglitazone significantly enhanced the apoptosis (increment rate of 5–20%) in a dose-dependent manner at normal glucose and high glucose levels. This study indicates that high-glucose-induced reduced glutathione confers resistance to apoptosis, but it can be overcome upon treatment of 5-fluorouracil and 5-fluorouracil/rosiglitazone combination. Rosiglitazone may be a promising antidiabetic drug to reduce the chemotherapeutic dose of 5-fluorouracil for colorectal cancer complicated with hyperglycemia.
Introduction
Colorectal cancer (CRC) is ranked as the second most prevalent cause of mortality worldwide. 1 It represents about 10% of total cancer cases in both sexes. The rise in death and incidence points to influence of nutritional practices and lifestyle patterns on cancer risk.
Oxidative stress has ambivalent effects: low exposure of oxidant gives oxidative eustress, which is essential to sustain functional redox signaling while an excessive oxidant burden results in pathophysiological oxidative distress leading to cell death. 2 It is suggested to play a role in CRC carcinogenesis3,4 concurring with elevation of different clinical biomarkers, particularly advanced oxidation protein products (AOPP), malondialdehyde (MDA), 4-hydroxynonenal (4-HNE) and 8-hydroxy-2’-deoxyguanosine (8-OHdG) in CRC patients. 5 Hyperglycemia increases oxidant production in diabetic complications;6,7 however, its consequences on the oxidative stress of CRC are yet to be explored.
Apoptosis is able to control cell proliferation, but its postmortem effect may instigate tumorigenesis by retarding the repertoire of immune activities against potential malignant cells. 8 In addition, apoptosis can be defected transcriptionally, translationally, and post-translationally by cancer cells. 9 Therefore, several novel agents that prevent the apoptosis evasion in human cancers have been developed,10,11 some of which are also inducers of oxidative stress. Oxidative stress activates apoptosis signaling pathways, thereby gaining an effective approach for cancer treatment. 12
5-Fluorouracil (5-FU) is generally used in curative treatment of CRC. However, a recent systemic study revealed that 5-FU efficacy could be alleviated in the presence of diabetogenic glucose level. 13 It is in agreement with the preclinical findings that dealt with several human colonic carcinomas like SW480, SW620, LoVo, HCT 116, and HT 29.14,15 The cancer cells often undergo microenvironment-mediated metabolic reprogramming;16,17 thus, an altered response to chemotherapy at hyperglycemic condition is anticipated. To address this issue, different classes of antidiabetic drugs, including metformin,18,19 pramlintide, 20 and rosiglitazone,14,21 have been proposed as adjuncts to 5-FU therapy against CRC. Despite their prominent synergistic outcome, mechanisms governing the vulnerable points of cancer survival remain elusive and deserve further investigation.
Oxidative stress and apoptosis are interrelated events that influence cancer survival. 12 This study was designed to evaluate the influence of 5-FU and rosiglitazone on oxidative stress as well as its implication on the apoptosis of CRC cells in hyperglycemic condition.
Material and methods
Reagents
Normal-glucose (NG) Dulbecco’s modified Eagle’s medium (DMEM, 11885 Gibco) and high-glucose (HG) DMEM (11995 Gibco) were supplemented with 10% fetal bovine serum, 1% penicillin streptomycin, and 1% amphotericin B. NG MEM (D2279 Sigma) was complemented with 4.0 mM L-glutamine, 1.0 mM sodium pyruvate, 20% fetal bovine serum, 1% nonessential amino acid, and 1% penicillin streptomycin. Glucose solution (1 M) was added to prepare HG MEM. The stocks of 5-FU (F6627 Sigma) and rosiglitazone (Rz, R2408 Sigma) were prepared at concentrations of 5 mg/mL (in phosphate-buffered saline, PBS) and 1 mg/mL (in dimethyl sulfoxide, DMSO), respectively. Radioimmunoprecipitation assay buffer (RIPA) buffer (20-188 Millipore), Bradford reagent (B6916 Sigma), DAF-FM diacetate (D23844 Invitrogen), Annexin V binding buffer (ABB, 556454 BD Pharmingen), Annexin V-FITC (556419 BD Pharmingen), and propidium iodide (PI, P4864 Sigma) were purchased from respective manufacturers.
Cell culture
CCD-18Co (a normal human colon cell line) was grown in NG MEM, whereas two human colonic carcinoma cell lines, namely HCT 116 and HT 29, were cultured in NG DMEM. The cells were maintained in a humidified atmosphere of 5% CO2 at 37 ± 2 °C. Culture condition of, either NG (5.5 mM) or HG (25 mM), was applied based on the glucose level in medium.
Treatment and control groups
Each cell line with appropriate density was seeded into a culture plate (or chamber slide) and was pretreated with 0.2 µg/mL 5-FU in NG medium for 24 h. Next, the spent medium was aspirated and replaced by different assay media as stipulated below:

NG: normal glucose; HG: high glucose; FU: fluorouracil.
The treatments were replicated with substitution of rosiglitazone (low dose: 0.5 µg/mL; high dose: 5 µg/mL) or 5-FU/rosiglitazone combination. The control group was 5-FU pretreated cells in NG medium without any addition of drug substance for 48 h.
Glucose uptake assay
Cellular glucose uptake was determined following the manufacturer’s protocol (ab136955 Abcam) with slight modifications. Cell line HCT 116 (2000 cells/100 µL), HT 29 (2500 cells/100 µL), or CCD-18Co (3500 cells/100 µL) was exposed to designated treatments in a 96-well plate for 48 h. Then, the cells were starved for glucose by incubating them in 100 µL Krebs-Ringer-Phosphate-HEPES buffer (20 mM HEPES, 5 mM KH2PO4, 1 mM MgSO4, 1 mM CaCl2, 136 mM NaCl, and 4.7 mM KCl, pH 7.4) containing 2% bovine serum albumin for 40 min. Next, 10 mM 2-deoxyglucose (2-DG) was added and incubated for another 20 min. Exogenous 2-DG was rinsed with PBS before subjecting the cells to lysis with 80 µL extraction buffer and enzyme denaturation at 85°C ± 2°C for 40 min. The cell lysate was allowed to cool on ice for 5 min and neutralized with 10 µL neutralization buffer. After that, a serial process involving NADPH generation (in 10 µL Reaction Mix A), unused NADPH degradation (heating in 95 µL extraction buffer at 85°C ± 2°C for 40 min), and recycling amplification reaction (in 38 µL Reaction Mix B) was performed. Finally, absorbance of the resulting mixture was read at OD412 nm. The glucose uptake (µM) measured from 2-DG6P calibration curve was normalized to cell viability owing to the cytotoxic effect of the drugs.
Cell lysate extraction
Treatment on respective cell lines, with densities of 40,000 cells/mL (HCT 116), 55,000 cells/mL (HT 29), and 70,000 cells/mL (CCD-18Co), was carried out in a 12-well plate for 48 h. The cells were harvested and lysed in 200 µL RIPA buffer plus protease inhibitor cocktail (cOmplete™) at 4°C for 1 h. After centrifuged at 15,000g, the supernatant containing cell lysate was collected and kept at −80°C prior to the analyses of AOPP level and free thiol level. Total protein of cell lysate was quantified according to Bradford assay described in the manufacturer’s protocol (Sigma, USA).
Assessment for advanced oxidation protein products (AOPP) level
The intracellular AOPP level was determined according to the modified method of Witko-Sarsat et al. 22 Cell lysate (200 µL 2× diluted in PBS) was loaded in a 96-well plate, followed by sequential addition of 10 µL of potassium iodide (1.16 M) and 20 µL of acetic acid (50% v/v). Then, absorbance of the reaction mixture was read immediately at OD340 nm against the blank (PBS). A calibration curve was obtained using chloramine-T standard (0–500 µM), and AOPP level was expressed as µmol chloramine-T equivalent/g protein.
Assessment for free thiol level
The intracellular free thiol level was determined using Ellman assay as described by Inayat-Hussain et al. 23 Cell lysate (50 µL) was loaded in a 96-well plate, followed by sequential addition of 40 µL of reaction buffer (0.1 M Na2HPO4·7H2O and 1 mM EDTA, pH 8) and 10 µL of 5,5’-dithiobis-(2-nitrobenzoic acid) (DTNB) (4 mg/mL in reaction buffer pH 8). After incubation at 37°C ± 2°C for 15 min, absorbance of the reaction mixture was read at OD415 nm against the blank (PBS). A calibration curve was plotted using reduced glutathione (GSH) standard (0–1.28 µM, reconstituted in reaction buffer pH 6.5), and free thiol level was expressed as µmol GSH equivalent/g protein.
Assessment for nitric oxide (NO) level
Treatment on HCT 116 (25,000 cells/100 µL) or HT 29 (30,000 cells/100 µL) was conducted in a 12-well chamber slide for 48 h. The cells were stained with 50 µL of DAF-FM diacetate (10 µM in anhydrous DMSO) and incubated in the dark for 30 min. Next, the stained cells were rinsed with PBS before observing under an upright fluorescence microscope (Model: Leica DM6000B) integrated with Leica Application Suite (LAS) X platform. The intensity was assessed by ImageJ software. 24
Cell apoptosis assay
Treatment on respective cell lines, with densities of 40,000 cells/mL (HCT 116), 55,000 cells/mL (HT 29), and 70,000 cells/mL (CCD-18Co), was carried out in a 12-well plate for 48 h. The cells were harvested, washed, and suspended in 100 µL of 1X ABB. Then, the cell suspension was incubated with 5 µL of Annexin V-FITC for 13 min and subsequently with 5 µL of PI for 2 min in the dark. 1X ABB (400 µL) was added prior to analysis using a flow cytometer (BD FACScanto II) integrated with BD FACSDiva software.
Statistical analysis
Statistical analysis was accomplished using SPSS Statistics 17.0 software (IBM Corp., USA). Analysis of variance (ANOVA) followed by post hoc Duncan’s multiple range test was run to determine the difference in mean. Value of p < 0.05 was considered statistically significant. All data were presented as mean ± SEM from three independent experiments of at least three replicates.
Results
Effect of 5-FU and rosiglitazone on glucose uptake
HCT 116 cells in NG culture and HG culture showed a significant difference (p < 0.05) in glucose uptake. However, under HG culture, the glucose uptake was significantly (p < 0.05) inhibited in the presence of 5-FU (0.2 µg/mL) (Figure 1(a)). Treatment with 5-FU or rosiglitazone did not affect the cellular glucose uptake of HT 29 (Figure 1(b)) or CCD-18Co (Figure 1(c)) regardless of glucose concentration.

Effect of drug treatment on cellular glucose uptake in NG and HG cultures: (a) HCT 116, (b) HT 29, (c) CCD-18Co. The control was 5-FU pretreated cells without subsequent exposure to 5-FU or rosiglitazone for 48 h.
Effect of 5-FU and rosiglitazone on oxidative indices
Advanced oxidation protein products (AOPP)
5-FU and rosiglitazone had no significant effect on cellular production of AOPP under both NG and HG cultures (Figure 2). Interestingly, the AOPP level in cancer cells (HCT 116, 310–360 µmol chloramine T/g protein; HT 29, 350–400 µmol chloramine T/g protein) was about twofold (p < 0.05) higher than normal cells (CCD-18Co, 120–170 µmol chloramine T/g protein).

Intracellular AOPP level in NG and HG cultures: (a) HCT 116, (b) HT 29, (c) CCD-18Co. The control was 5-FU pretreated cells without any subsequent treatment of 5-FU, rosiglitazone, or combination of both for 48 h.
Free thiol
Free thiol level in untreated HCT 116 cells was 32.36 ± 5.05 µmol GSH/g protein, and the value remained unchanged (p < 0.05) across all the treatments with NG culture (Figure 3(a)). Under HG culture, however, the free thiol level was significantly (p < 0.05) reduced by 5-FU or 5-FU/rosiglitazone combined treatment in a dose-dependent manner. Meanwhile, there was a significant difference (p < 0.05) in free thiol production between NG culture and HG culture within the same treatment group. A similar trend was also evident in HT 29 cells (Figure 3(b)). Contrastingly, untreated CCD-18Co cells showed free thiol level of 10–12 µmol GSH/g protein, which was consistent across all the treatments irrespective of glucose concentration (Figure 3(c)).

Intracellular free thiol level in NG and HG cultures: (a) HCT 116, (b) HT 29, (c) CCD-18Co. The control was 5-FU pretreated cells without any subsequent treatment of 5-FU, rosiglitazone, or combination of both for 48 h.
Nitric oxide (NO)
Intrinsic NO level was directly proportional to the relative mean intensity of fluorescence from DAF-FM indicator. Cell lines HCT 116 (Figure 4(i)) and HT 29 (Figure 4(ii)) showed a similarity with respect to NO generation upon the same treatment. Generally, regardless of glucose concentration, high-dose 5-FU (2 µg/mL) and rosiglitazone (5 µg/mL) triggered the cells to have a twofold increase (p < 0.05) in NO production as compared to those subjected to low-dose treatment (5-FU: 0.2 µg/mL; rosiglitazone: 0.5 µg/mL).
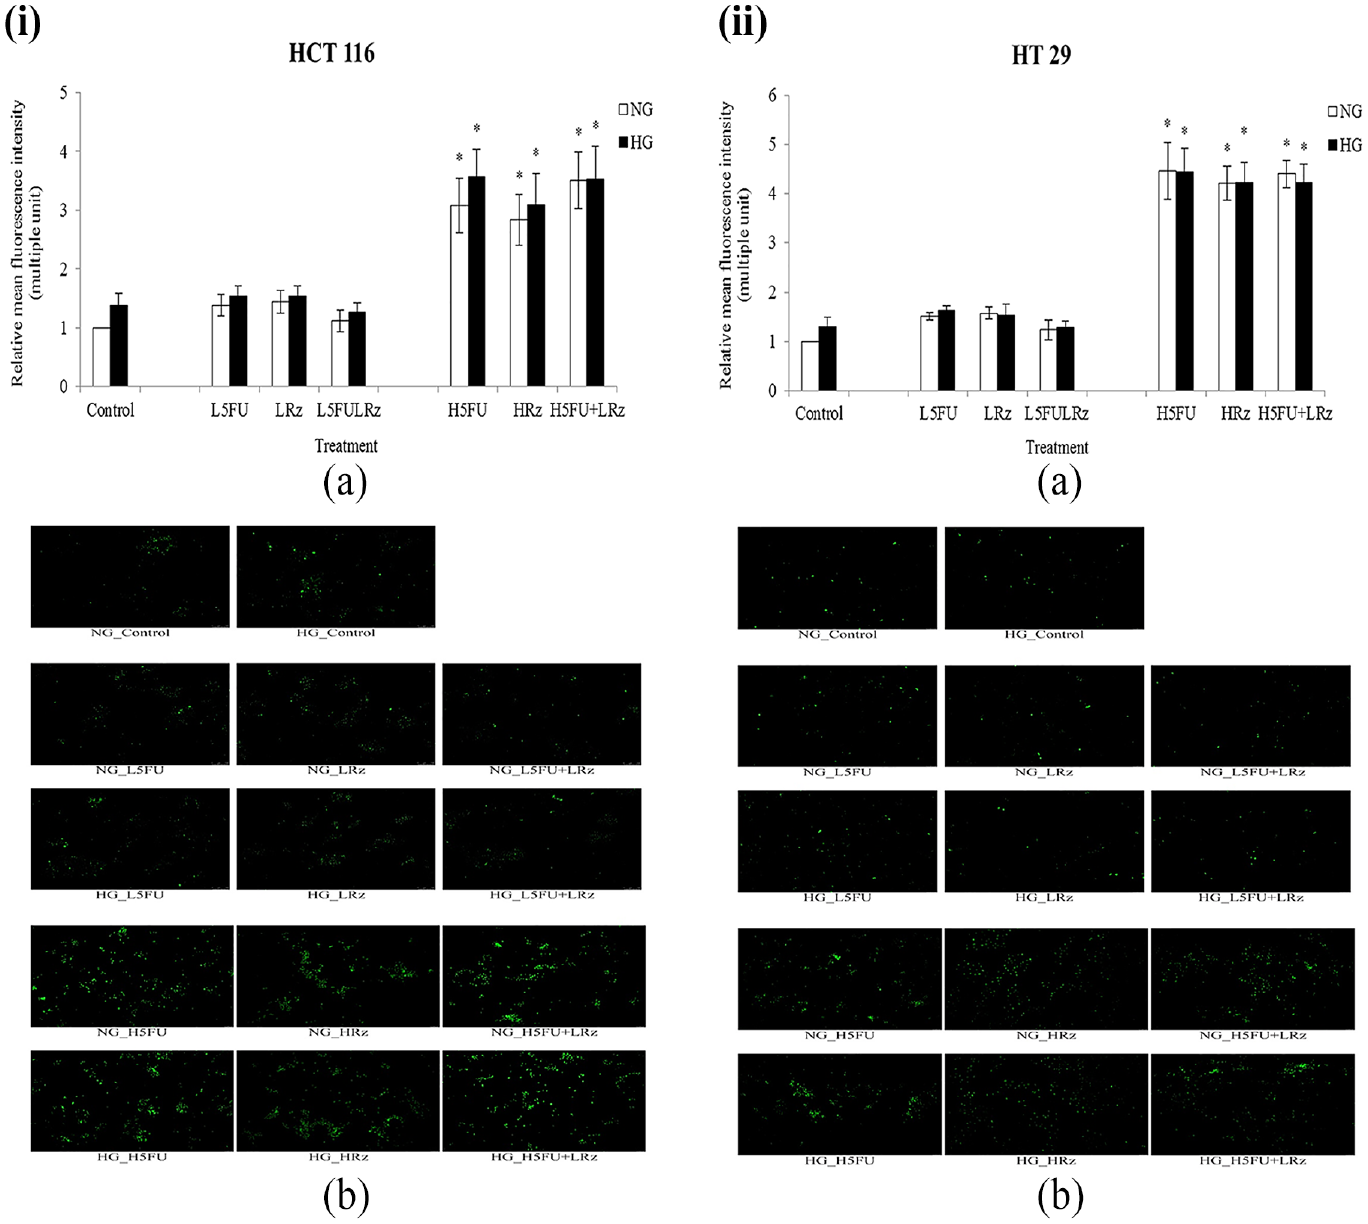
Intracellular nitric oxide (NO) level of (i) HCT 116 and (ii) HT 29 cells upon different treatments in NG and HG cultures. (a) Data are presented as relative mean fluorescence intensity normalized to the NG control (5-FU pretreated cells in NG medium free from drug substance for 48 h). (b) Representative images of DAF-FM staining cells assessed by ImageJ software (Magnification: 100 ×).
Effect of 5-FU and rosiglitazone on cell apoptosis
Under NG culture, the early apoptosis population of untreated HCT 116 (Figures 5(i), 6(i), 7(i)) and HT 29 (Figures 5(ii), 6(ii), 7(ii)) was 23.0% ± 0.7% and 5.0% ± 0.7%, respectively. There was approximately 15% reduction (p < 0.05) in the number of apoptotic HCT 116 cells under HG culture (Figures 5(i), 6(i), 7(i)). 5-FU caused a dose-dependent increase of early apoptosis in both HCT 116 (Figure 5(i)) and HT 29 (Figure 5(ii)) carcinomas. The high-dose (2 µg/mL) 5-FU-treated cells showed 40%–50% apoptosis population under NG culture, and this was significantly (p < 0.05) reduced by 10%–15% in the presence of high glucose. On the other hand, high-dose rosiglitazone (5 µg/mL) triggered late apoptosis in HCT 116 cells under NG (20.4% ± 3.7%) and HG (17.4%±2.3%) cultures (Figure 6(i)). However, the growth of early apoptosis (17.5%±2.5%, NG culture) evidenced in HT 29 cells was significantly (p < 0.05) diminished at 10.0 ± 1.5% under HG culture (Figure 6(ii)).

Apoptosis assay on 5-FU pretreated (i) HCT 116 and (ii) HT 29 cells, which were incubated with 5-FU in the presence of NG or HG for 48 h. (a) Different letters in each quadrant (Q1–Q4) indicate significantly different mean, p < 0.05. (b) Representative histograms consisting of four separated quadrants (Q1: necrotic cells; Q2: late apoptotic cells; Q3: normal cells; Q4: early apoptotic cells).

Apoptosis assessment on 5-FU pretreated (i) HCT 116 and (ii) HT 29 cells, which were exposed to rosiglitazone in the presence of NG or HG for 48 h. (a) Different letters in each quadrant (Q1–Q4) indicate significantly different mean, p < 0.05. (b) Representative histograms consisting of four separated quadrants (Q1: necrotic cells; Q2: late apoptotic cells; Q3: normal cells; Q4: early apoptotic cells).
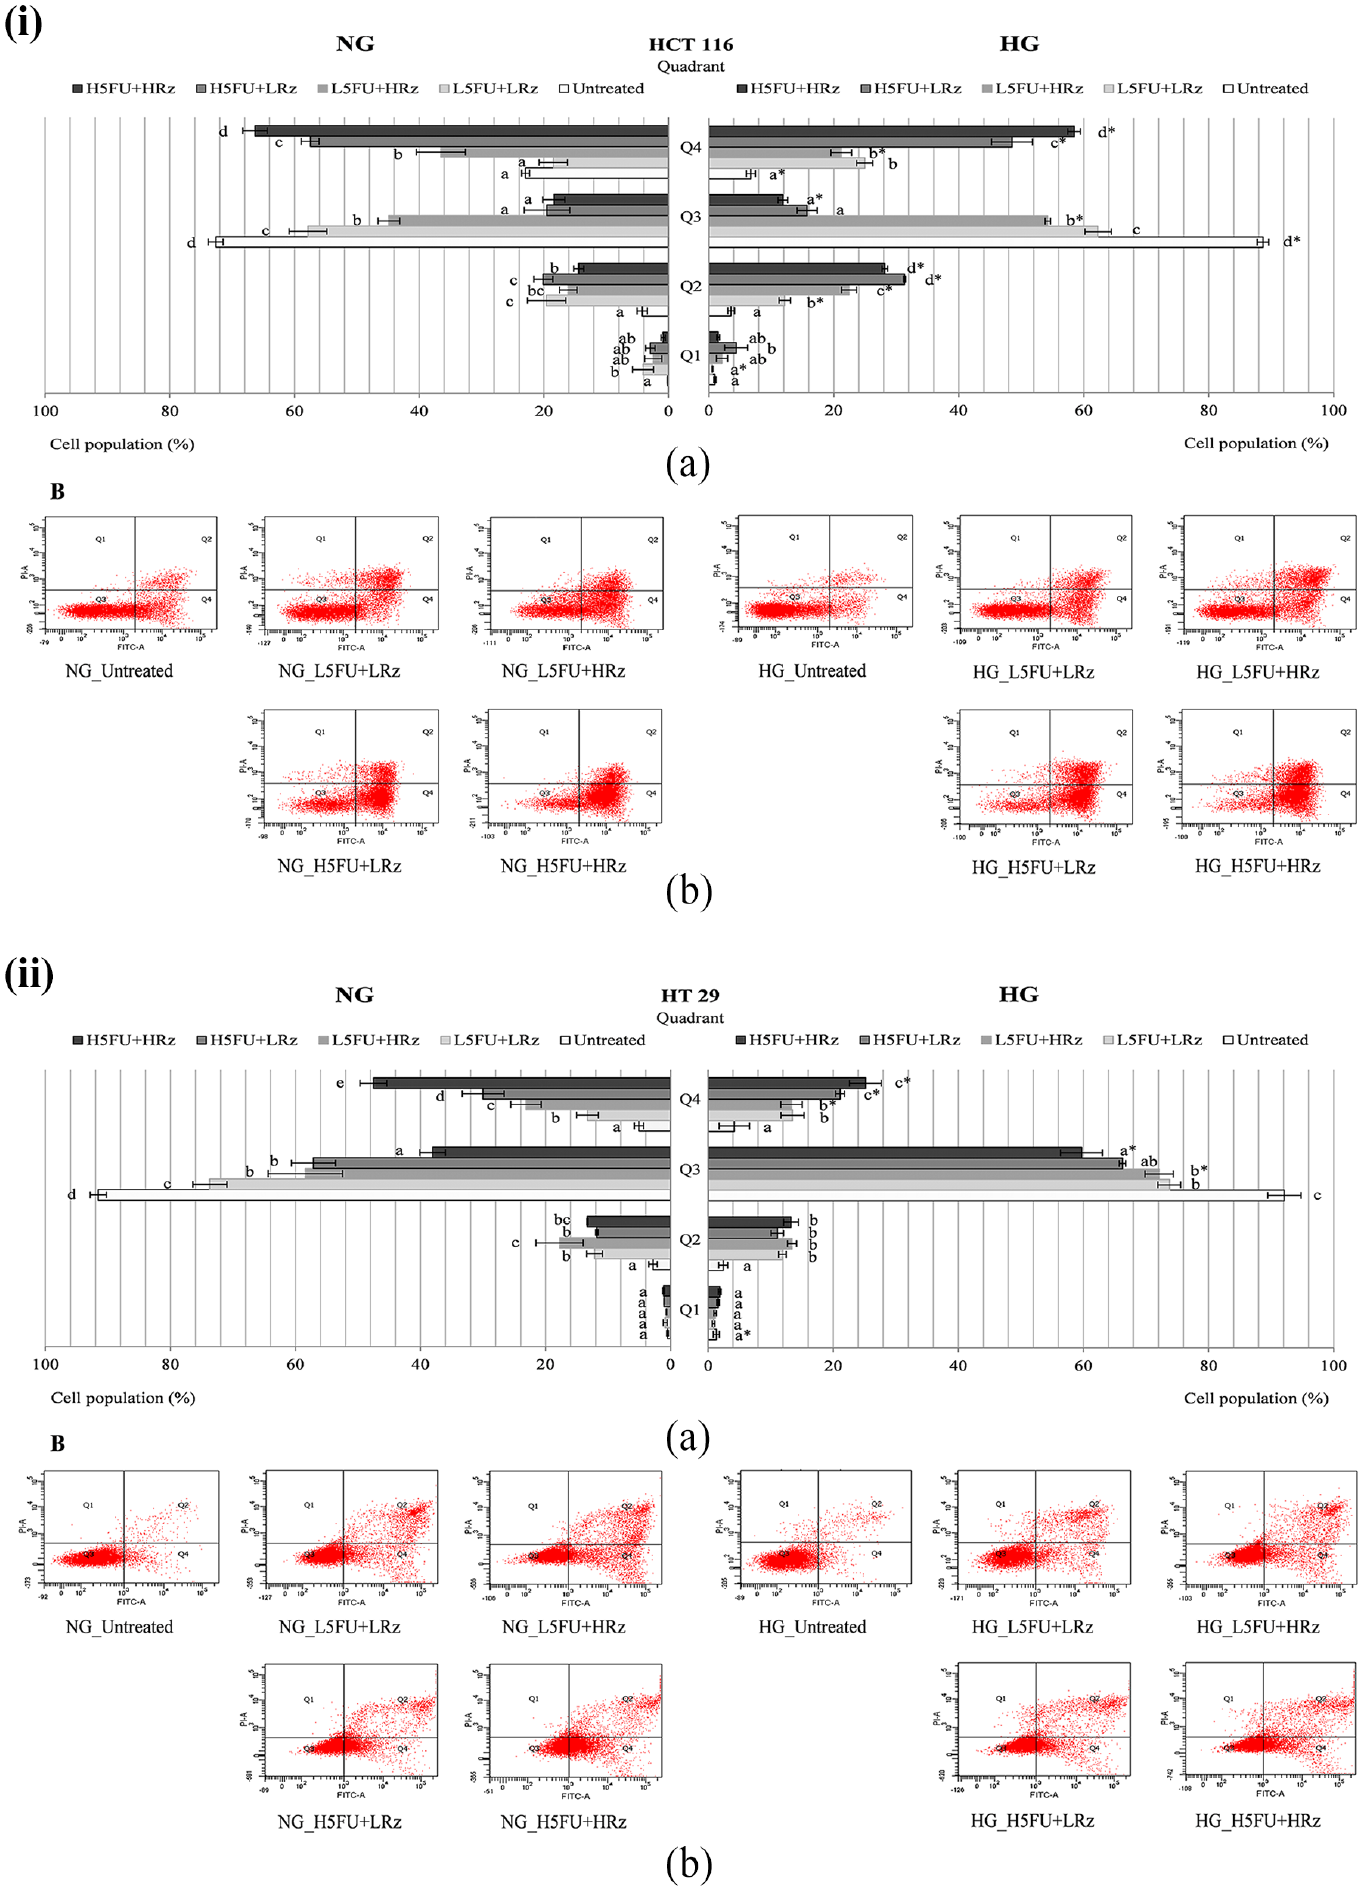
Apoptosis analysis on 5-FU pretreated (i) HCT 116 and (ii) HT 29 cells, which were subjected to combination treatment of 5-FU and rosiglitazone in the presence of NG or HG for 48 h. (a) Different letters in each quadrant (Q1–Q4) indicate significantly different mean, p < 0.05. (b) Representative histograms consisting of four separated quadrants (Q1: necrotic cells; Q2: late apoptotic cells; Q3: normal cells; Q4: early apoptotic cells).
When compared to 5-FU alone (2 µg/mL), its combination with rosiglitazone induced early apoptosis up to 60% in HCT 116 cells under NG culture. The apoptotic cells, however, was significantly (p < 0.05) reduced by 10%–15% under HG culture (Figure 7(i)). Likewise, 5-FU/rosiglitazone-treated HT 29 cells showed a dose-dependent increase of early apoptosis under both NG and HG cultures (Figure 7(ii)). About 10%–20% of the apoptotic cells were significantly (p < 0.05) decreased in the presence of high glucose. HCT 116 and HT 29 cells maintained their necrosis population below 5% in the combined treatments regardless of drug dosage.
5-FU (2 µg/mL), Rz (5 µg/mL), or combination of both caused negligible level of apoptosis (< 5%) in CCD-18Co cells under NG culture (Figure 8). The normal population was kept above 90%. Overall, with respect to chemosensitivity, HCT 116 represented the most sensitive cell line followed by HT 29 and CCD-18Co.

Apoptosis evaluation of 5-FU-pretreated CCD-18Co cells which were incubated with 5-FU, rosiglitazone, or combination of both in NG culture for 48 h. (a) Different letters in each quadrant (Q1–Q4) indicate significantly different mean, p < 0.05. (b) Representative histograms consisting of four separated quadrants (Q1: necrotic cells; Q2: late apoptotic cells; Q3: normal cells; Q4: early apoptotic cells).
Discussion
Carcinogenesis is a multistep process involving the elimination of several cell-imposed barriers such as cell cycle arrest, programmed cell death, and cell senescence. 25 Therefore, cancer cells must comply with an increased energy usage in order to proliferate. Rather than mitochondrial oxidative phosphorylation, cancer cells preferentially utilize the glucose to sustain their energy demand through cytoplasmic aerobic glycolysis. 26 This metabolic shift, termed “Warburg effect,” is always associated with an enhanced glucose uptake, thereby providing beneficial advantages for cancer progression. 27
Warburg effect does not take place under all circumstances. Cancer cells can switch between glycolytic and oxidative metabolism depending on the availability of glucose supply.28,29 In such a scenario, hyperglycemia with excessive glucose substrate may tentatively transform cancer cells to the glycolytic mode and thus promote glucose uptake. Glucose transport is the key rate-limiting step in glucose uptake. It is facilitated by glucose transporters (GluTs) with GluT1 being upregulated in different human colonic carcinoma cell lines such as CX-2, HCT 116, HRT-18, HT 29, SW480, and SW620.30,31,32 Suppression of GluTs impairs proliferation of human CRC cells. 32 Although numerous inhibitors have been investigated, 33 their efficacy under hyperglycemic condition is still a matter of speculation. 5-FU inhibited glucose uptake in HCT 116 cells (Figure 1(a)), and it might be far more effective than other reviewed anticancer agents 33 when taking factors of dosage and glucose concentration into consideration. On the other hand, rosiglitazone had no discernible effect on HCT 116 cells (Figure 1(a)). Nevertheless, the rise in glucose uptake under HG culture might be attributed to glycemia-induced PPAR-delta(δ), which upregulates GluT1 and consequently accelerates glucose influx in cancer cells.34,35
Nitric oxide (NO) has both beneficial and deleterious physiological roles in tumorigenesis depending on its concentration.36,37 While low to moderate amount of NO activates oncogenic pathways, extraordinary NO level (> 400 nM) resulting from overexpression of inducible nitric oxide synthase (iNOS) is detrimental to CRC cells. 38 With the concurrent decrease in cell proliferation, 14 this study indicated that 5-FU (2 µg/mL) and rosiglitazone (5 µg/mL) caused a lethal generation of NO in HCT 116 and HT 29 cells (Figures 4(i) and (ii)). HG has been shown to upregulate basal iNOS by mediating intracellular GSH and NF-κB activity in intestinal epithelial cells. 39 However, according to the nonsignificant change in NO level between NG and HG (Figures 4(i) and 4(ii)), it was apparent that the mechanism of glucose-mediated NO generation in cancer cells differed from that of normal cells. Such mechanistic variation is not fully elucidated but should be worthy of future investigation.
Advanced oxidation protein products (AOPP), generated due to protein oxidation, has been shown to be elevated in CRC patients.5,40 However, to the best of our knowledge, this study is the first to evaluate the AOPP level in colorectal carcinoma cell lines. While Pukana 41 determined an extracellular AOPP level of human foreskin fibroblasts at 0.35–0.45 µM, it was about 100–120 µM chloramine T/g protein in HCT 116 and HT 29 cells (data not shown). AOPP (oxidized albumin) can be taken up and accumulated in cells under stress conditions. 42 In our study, however, the cancer cells (HCT 116 and HT 29) manifested with a constant AOPP level across all the drug treatments (Figures 2(a) and 2(b)). Cells isolated from tumor tissue endure oxidative stress greater than those from normal tissue. 43 Hence, a twofold AOPP level was evident in the cancer cells (HCT 116 and HT 29) versus the normal cells (CCD-18Co) (Figure 2). This finding is in accordance with the consequences of Warburg effect, which retains a high nontoxic oxidative stress in cancer cells to facilitate metastasis. 44
Pyruvate, the end product of glycolysis, is a potent antioxidant in normal cells. 45 Glycolytic cancer cells consume pyruvate and synthesize lactate with the aid of lactate dehydrogenase. Lactate has no antioxidant properties. Therefore, it is believed that cancer cells are deprived of antioxidant capacity due to the loss of pyruvate through reduction into lactate. 44 In parallel with glycolysis, El Sayed et al. 44 hypothesized that pentose phosphate pathway (PPP, a major source of NADPH) is activated so that the oxidative stress can be prevented from reaching cytotoxic levels through regeneration of GSH. Indeed, emerging evidence has revealed that the PPP is linked to various aspects of tumor metabolism, such as cell survival, cell invasion, and angiogenesis.46,47 Through PPP, glucose-6-phosphate (G6P) is oxidized into ribulose-5-phosphate and the resulting NADPH is utilized as substrate of glutathione reductase for regeneration of reduced glutathione (GSH). GSH plays a pivotal role in oxidant detoxification. Gamcsik et al. 48 documented 11.1-26.8 µmol of GSH in tumor tissues of CRC patients. It was about 30 µmol GSH/g protein in untreated HCT 116 and HT 29 cells (Figures 3(a) and 3(b)). In fact, within a cell culture system, the basal intrinsic GSH level of carcinoma-derived cells is found to vary ranging from 18 to 130 µmol/g protein. 49 The increased GSH level under HG culture (Figure 3(a) and (b)) suggested that HG enhanced PPP activity, thus protecting CRC cells against oxidative stress. Consequently, corresponding to the inhibition of glucose uptake (Figure 1(a)), GSH level in HCT 116 cells treated with 5-FU was significantly (p < 0.05) reduced in a dose-dependent manner (Figure 3(a)). Unlike 5-FU, rosiglitazone exerted a negligible effect on the GSH production of colorectal carcinomas (Figure 3(a) and (b)). Huber et al. 50 reported that HCT 116 and HT 29 cells exhibited depletion of intracellular GSH contents with the exposure of 50 µM pioglitazone. While the maximal concentration of rosiglitazone used in the present study was only 5 µg/mL, a higher dosage might be required to induce significant GSH production.
There are two usual means by which apoptosis is initiated: the intrinsic (or mitochondrial) pathway and the extrinsic (or death receptor) pathway. 51 Both pathways converge to the same execution phase through a sequential activation of caspases, including initiator (e.g. caspase-8 and -9) and effector (e.g. caspase-3, -6, and -7). 52 Apoptosis is a requisite process to ensure functional and structural tissue homeostasis. However, cancer cells are able to circumvent it as one of their hallmark capacities. 53 Principally, this is established in part by disrupting the balance between pro-apoptotic and anti-apoptotic regulatory proteins at different signaling steps of apoptosis. 9 Other mechanisms leading to evasion of apoptosis include reduced caspsase activity and impaired death receptor signaling.11,54 Like a double-edged sword, every defect along the apoptotic pathways can be targeted for cancer therapeutic purposes. Therefore, a substantial number of agents designated to restore apoptosis in cancer cells have been well developed over the past decade.10,11 For example, 5-FU has been shown to induce apoptosis in human CRC models (HCT 116, HT 29, SW 620, SW 480) 55 concurring with the results obtained in this study. The activity is caspase-9-dependent and mediated by protein kinase C-δ 55 or facilitated by Bcl-2 family of proteins with pro-apoptotic (BAX, BAD, and BAK) and anti-apoptotic (Bcl-2 and Bcl-XL) properties. 56 These regulatory proteins are core components in intrinsic pathway of apoptosis. 57 5-FU has also been reported to trigger apoptosis in human CRC cells through the extrinsic pathway by sensitizing TNF-related apoptosis-inducing ligand (TRAIL, for example, DR5 and DR4) for consecutive caspase-8 expression. 58 5-FU is a genotoxic drug. At high dose (2 µg/mL), it significantly elevated production of NO (Figures 4(i) and 4(ii)) causing the drastic increase of early apoptosis in HCT 116 cells (≈50%, Figure 5(i)) and HT 29 cells (≈40%, Figure 5(ii)). Given the diverse impact of hyperglycemia on cancer progression, 59 the influence of glucose in modulating 5-FU activities along the apoptotic pathways should not be overlooked. Some studies suggested an association of phosphatidylinositol 3-kinase/protein kinase B/mammalian target of rapamycin (PI3K-AKT-mTOR) signaling with CRC development.60,61 Silencing of GluT1 has triggered apoptosis in HCT 116 cells through the deactivation of PI3K-AKT-mTOR pathway. 32 Contrastingly, in this study, the apoptosis was impeded despite the attenuated glucose uptake with 5-FU treatment (Figure 1(a)). Therefore, the protective effects of HG against 5-FU-induced apoptosis might be due to the increase of intracellular GSH level (Figure 3(a) and 3(b)). This theoretical postulation is supported by Fu et al. 62 showing that antioxidants such as catalase, vitamin C, and GSH confer chemoresistance to 5-FU in human CRC cells by knocking down the Src kinase activity on downstream caspase-7 phosphorylation.
Thiazolidinediones (TZD) including rosiglitazone and pioglitazone are mainly prescribed to patients with type 2 diabetes. TZD exerts insulin-sensitizing action via direct activation of peroxisome proliferator-activated receptors (PPAR). Rosiglitazone, as a PPAR-gamma(γ) agonist, has been shown to favor the commitment toward apoptosis in human CRC models (HT 29 and HCT 15) with concentration of 10 or 25 µM.21,63,64 However, in the present study, lower dosages (0.2 and 2 µg/mL) caused moderate early apoptosis in HCT 116 (≈10%, Figure 6(i)) and HT 29 (≈20%, Figure 6(ii)) cells. Consistent with other TZD drugs such as ciglitazone 65 and troglitazone, 66 it is evident that mechanisms behind the apoptotic impact of rosiglitazone involve downregulation of cyclooxygenase-2 (COX-2) synthase. 64 In fact, the roles of synthetic PPAR-gamma(γ) ligands leading to apoptosis in CRC can be caused by downregulation of survivin, suppression of nuclear factor kappa B (NF-κB), stimulation of Krüppel-like factor (KLF), or upregulation of phosphate and tension homolog (PTEN) as summarized by Park and Kwak. 67 Previous studies demonstrated that apoptosis was triggered under a standard glucose level, either 16.67 or 11.11 mM.21,63,64 The present study further showed that HG (25 mM) alleviated the apoptotic impact of rosiglitazone on human CRC cells (Figures 6(i) and 6(ii)). HG has also been reported to antagonize the proapoptotic effect of metformin through activation of mTOR pathway in breast cancer cells. 68 Undoubtedly, there is an inconspicuous cell death upon single treatment with antidiabetic drugs. However, when rosiglitazone was administrated with 5-FU, the early apoptosis was drastically increased in HCT 116 cells (Figure 7(i)) and HT 29 cells (Figure 7(ii)) as compared to those treated by 5-FU alone. This finding concurs with a past experimental outcome, 21 as well as corresponds with the synergistic effect of rosiglitazone on 5-FU regardless of glucose level. 14 COX-2 is found to overexpress and thus induces the expression of Bcl-2 causing apoptotic arrest in human colon carcinomas.69,70 5-FU 56 and PPAR-gamma(γ) 21 have a common activity in downregulating the Bcl-2 expression. Therefore, 5-FU/rosiglitazone combination can possibly be a good tactic to induce apoptosis in CRC cells.
Conclusion
The present study showed that HG stimulated GSG level in CRC cells, which endured greater oxidative stress than normal cells. The HG-induced GSH conferred chemoresistance to 5-FU by diminishing its apoptotic impact on CRC cells. Therefore, we suggest that 5-FU/rosiglitazone combination can reduce chemotherapeutic dose of 5-FU and offer an effective regimen against CRC associated with hyperglycemia.
Footnotes
Declaration of conflicting interests
The author(s) declared no potential conflicts of interest with respect to the research, authorship, and/or publication of this article.
Funding
The author(s) disclosed receipt of the following financial support for the research, authorship, and/or publication of this article: This work was supported by Postgraduate Research Grant [PG245-2015B], University of Malaya.