
Abstract
The in-plane crashworthiness of multi-layer regularly arranged circular honeycombs are investigated numerically at v = 1–250 m/s, with aim to disclose the influences of t/R ratio and crushing velocity, v. A novel evaluation methodology of crashworthiness and a new mechanical term, most appropriate strain, are put forward, which results in some new evaluation parameters. The theoretical analysis shows the most appropriate strain is a significant parameter for measuring the crashworthiness. Different deformation modes cause different change rules of these evaluation parameters. Under the quasi-static homogeneous mode and transition mode, the most appropriate strain is linear with the t/R ratio for a given v; the crushing force efficiency is approximately independent of t/R and sensitive to the v; the maximum energy absorption efficiency roughly decreases and then fluctuates. With the increase of v, the crushing force efficiency first becomes smaller sharply, and then fluctuates. Under dynamic mode, the maximum energy absorption efficiency is nearly constant for a given t/R ratio. Based on the finite element results, the empirical expressions of all evaluation parameters are given. The finite element calculated results of optimal specific energy absorption are consistent with those calculated by empirical expressions, which validates all empirical expressions.
Keywords
Introduction
As important two-dimensional (2D) lightweight cellular materials with excellent cushioning performance, the multi-layer regularly arranged circular honeycombs (MRACHs) are always widely applied in the fields of construction, vehicle manufacturing, military affairs, aviation, packaging, and so on. Some theoretical, finite element (FE) and experimental investigations have been carried out for the elastic deformation, plastic collapse, and energy absorption of the circular honeycombs. Chung and Waas 1 theoretically derived the equivalent elastic properties of hexagonally packaged circular honeycombs (HPCHs) and analyzed the orthotropy of honeycomb stiffness caused by the departure from cell circularity to cell ellipticity. Mora and Waas 2 calculated the Cosserat constant of polycarbonate HPCHs experimentally. Chung and Waas 3 derived a set of expressions characterizing the HPCHs as micropolar elastic solids using the non-dimensional analysis and numerical analysis. Lin et al.4,5 theoretically analyzed the in-plane elastic modulus, Poisson’s ratio, brittle crushing strength, and plastic yielding strength of the honeycombs with hexagonally packed circular and elliptical cells. Cernescu et al. 6 presented the analytical equations about the equivalent stiffness properties of cylindrical cell honeycomb cores, and the FE simulations proved that the analytical equations can accurately predict the stiffness coefficients and effective elastic modules. Papka and Kyriakides 7 presented the response curves and deformation modes of polycarbonate HPCHs under the in-plane static uniaxial compression loadings, and Chung and Waas8,9 further discussed the reasons for the orthotropic response of HPCHs. Papka and Kyriakides10,11 recorded the responses of the polycarbonate HPCHs in both directions using a developed testing facility and a video camera, and accurately reproduced the experiments through FE numerical simulations. Chung and Waas12–15 investigated the compressive responses of polycarbonate HPCHs under in-plane biaxial loadings where the specimens were compressed in one direction with an initial load in the perpendicular direction. Moreover, they also studied the sensitivities of the in-plane macroscopic linear stiffnesses to three types of initial imperfections analytically and numerically. 16 Hu et al. 17 conducted in-plane uniaxial and equi-biaxial compression experiments on the polycarbonate HPCHs where a special testing rig was designed to carry out the tests in the conventional universal testing machine. The deformation characteristic of polycarbonate HPCHs under the uniaxial compression was quantitatively discussed, and the initiation of deformation inhomogeneity and its evolution in polycarbonate HPCHs were characterized. Karagiozova and Yu18,19 numerically showed the post-collapse and strain localization characteristics of HPCHs under in-plane uniaxial and biaxial loadings. Lin et al. 20 made a theoretical analysis of the steady-state creep strain rates and creep rupturing times along the two principal directions of hexagonally packaged elliptical cell honeycombs using a unit cell model and assuming that solid cell walls follow the power law creep and Monkman–Grant relationship. D’Mello et al. 21 studied the dynamic axial crush response of the polycarbonate HPCHs with three and seven cells experimentally, and the FE results were found to agree well with the experimental results. D’Mello and Waas 22 investigated the compressive response and energy absorption of a composite honeycomb with the base material of polycarbonate HPCHs filled by hyperelastic elastomer, and the good agreement between experimental and FE results was seen. Sun et al. 23 gave the empirical formulas of critical velocity of deformation mode transition, dynamic densification strain, and dynamic plateau stress of MRACHs and used a simplified energy absorption model to evaluate the energy absorption performance. Hu et al. 24 studied the dynamic crushing of HPCHs and MRACHs under the out-of-plane crushing loadings with a wide range of velocities using both theoretical and numerical methods and good agreements with each other were shown. They also discovered the out-of-plane dynamic behavior of circular honeycombs under the internal pressure by both numerical simulations and theoretical analysis. 25 Under different internal pressure, three deformation modes were observed, and the formulas about the critical internal pressure of mode transition and plateau stress were derived.
Even though a few investigations mentioned above focus on the MRACHs, the specimens were still subject to the quasi-static loadings with low velocities. Investigations of Hu et al.24,25 are confined to the out-of-plane dynamic crushing of the HPCHs and MRACHs. Nikkhah et al. 26 addressed the crashworthiness performance of thin-walled windowed tubes under dynamic impact loading. The crashworthiness responses of the different windowed tubes were compared and the best performing tube was identified using a multi-criteria decision-making method. A multi-objective optimization analysis was performed to find the optimal configuration of the best tube. Shams et al. 27 presented a novel method to improve energy absorption performance of thin-walled circular tubes under quasi-static lateral loading experimentally and numerically. Simple circular tubes were shaped into four different types of preformed specimens that were simulated to investigate influences of wall thickness, preformed type, internal span of the specimen cross section and loading direction on the energy absorption performance of the preformed specimens. The new hollow prismatic samples have the energy absorption capability 11.5 times of the corresponding benchmark value and various types of preformed specimens have better energy absorber than the corresponding simple circular tubes. The methodology employed by Nikkhah et al. 26 and Shams et al. 27 can be used in the crashworthiness investigations of MRACHs. Up to now, the analysis of the cushioning performance of MRACHs has not been thoroughly carried out. Thereby, it is very necessary to disclose the crashworthiness of MRACHs under the in-plane crushing loadings.
Owing to the advantages of FE simulations over experiments, the FE numerical method has been solely and widely used in the investigations of 2D honeycombs.28–41 The existing investigations have shown that the configuration parameters and crushing velocity affect the dynamic behaviors of 2D honeycombs. The typical configuration of the MRACHs (with 9 × 9 cells in directions x1 and x2) is shown in Figure 1, and Figure 1(c) is the front view of periodic representative cell in the out-of-plane direction (direction x3). Each representative cell of MRACHs is packaged by four surrounding cells. The radius and cell wall thickness of representative cell are R and t, respectively. The cell depth of total honeycombs is assumed as b in direction x3.

Configuration of MRACHs with 9 × 9 cells excerpted from Sun et al.: 23 (a) front view, (b) left view, and (c) front view of representative cell.
In this article, the in-plane (direction x2 or x1 in Figure 1) crashworthiness of MRACHs is investigated numerically using the explicit FE analysis software, ANSYS/LS-DYNA, at the crushing velocities 1–250 m/s. The calculated results of crashworthiness parameters, such as most appropriate strain, optimal energy absorption per unit volume, mean plateau stress, maximum energy absorption efficiency, minimal cushioning coefficient, crush force efficiency, and optimal specific energy absorption are presented in the forms of tables and diagrams, with the aim to disclose the influence laws of cell configuration parameters and crushing velocity on the in-plane crashworthiness of MRACHs.
Methodology
Relative density of MRACHs
The density of the cell wall base material in MRACHs is assumed as ρS and the density of MRACHs is ρ*. According to the configuration characteristics, the relative density of MRACHs,

FE model
As used by Ruan et al., 30 Sun and colleagues,31,32 Zheng et al., 33 Li et al., 34 Liu et al., 35 Ali et al., 36 Qiu et al., 38 Zhang et al., 39 An et al., 40 and Gao et al. 41 for various 2D honeycombs, the FE model for the in-plane crashworthiness analysis of MRACHs is the same as the one used by Sun et al. 23 ANSYS/LS-DYNA is employed to construct the model here. R is 3 mm for all simulations. The cells are periodically extended in directions x1 and x2 to generate the entire specimen in which the adjacent cells are overlapped somewhere. The specimen is placed between two rigid plates. The crushing plate, P1, moves in in-plane direction at a constant crushing velocity, v, until the specimen collapses absolutely, and the support plate, P2, is stationary. v is from 1 to 250 m/s. All nodes of specimen are constrained from displacement in direction x3 to ensure the in-plane strain state of deformation. All cell walls of specimen are discretized with the Belytschko-Tsay Shell163 elements with five integration points by the way of free meshing. Automatic single surface contact (ASSC) without friction is defined between the surfaces of the cell walls in specimen which may contact each other during deformation. Automatic surface-to-surface (ASTS) contact with the friction coefficient of 0.02 is defined between the specimen and the plates P1 and P2. Following Papka and Kyriakides, 28 the elastic linear strain-hardening (also known as bilinear) model (see also Gao) 42 is used to represent the true stress–strain relation of cell wall base materials, of which the typical is one kind of aluminum alloy with the following mechanical properties: Young’s modulus, ES = 68.97 GPa, yield stress, σyS = 292 MPa, tangent modulus, Etan = 689.7 MPa, Poisson’s ratio, uS = 0.35 and density ρS = 2700 kg/m3. Also, the behavior of cell wall base material is treated as rate-independent, as was done by Ruan et al., 30 Zheng et al., 33 Li et al., 34 Liu et al., 35 Ali et al. 36 and Sun and colleagues.23,31,32
Some tentative simulations were carried out to determine the appropriate cell number and depth of specimens with consideration of the size sensibility on the dynamics of MRACHs to eliminate the influence of size sensibility as much as possible. 23 First, with b kept as 8 mm, simulations of the MRACHs (t = 0.15 mm) were carried out with cell number of 4 × 4, 6 × 6, 8 × 8, 10 × 10, 12 × 12, 14 × 14, 16 × 16, 18 × 18, and 20 × 20 in directions x1 and x2 at the crushing velocities of 20, 70, 125, and 200 m/s, respectively. The mean plateau stresses become stable approaching to a level when the cell number is more than or equal to 12 × 12. Then, more in-plane crushing tentative simulations were carried out for the MRACHs with 12 × 12 cells in directions x1 and x2 and b = 0.5, 3, 5, 8, 10, 12, and 15 mm at the crushing velocities of 20, 70, 125, and 200 m/s, respectively. The FE results show that the mean plateau stresses fluctuate less with the increase of b, and the proper depth of specimens should be larger than 8 mm. Therefore, in our simulations, the depth and cell number of all specimens are, respectively, set to be 10 mm and 16 × 16 in directions x1 and x2, respectively. In these tentative simulations above, the edge length of all meshed elements is 0.2 mm. Finally, the in-plane crushing simulations were further carried out for the MRACHs with 16 × 16 cells in directions x1 and x2, b = 10 mm, and the element edge length was 0.1, 0.2, 0.3, 0.4, 0.5, 0.6, 0.7, or 0.8 mm at the crushing velocities of 20, 70, 125, and 200 m/s, respectively. When the element edge length is smaller than 0.4 mm, the mean plateau stresses become stable and fluctuate less. According to this convergence calculation, the element edge length in our simulations is 0.3 mm.
Calculation of crashworthiness parameters
Basic terms
All response curves of specimens can be obtained in the commercial software, LS-PrePost. F refers to the contact force between P1 and specimen; u means the displacement of P1; A0 is the equivalent cross-sectional area of specimen in crushing direction; L0 is the initial length of specimen in crushing direction. Then, the nominal stress, σ, and strain, ε, are respectively 23

The external work is converted into the kinetic energy and internal energy of specimen, the sum of which is the total energy absorption. The internal energy includes the elastic strain energy and plastic dissipation. The energy absorption per unit volume, E, of the specimen at a particular strain, εa, is 23

The stress corresponding to εa is assumed as σa. Then, the corresponding energy absorption efficiency, Ee, is defined as43–46

Ee physically reflects the energy absorption ability of specimen under a certain stress level. The reciprocal of Ee is the cushioning coefficient, C, which in the cushioning applications is defined as 23

The specific energy absorption, Se, is the most important factor in the cushioning design by considering the objective of minimum material weight. Se corresponding to the strain, εa, of MRACHs is43–46

So, Se is the energy absorption per unit mass of specimen.
Most appropriate strain
Under in-plane dynamic crushing loadings, the deformation of MRACHs can be cataloged into three modes, quasi-static homogeneous mode (QHM) at low velocities, transition mode (TM) at moderate velocities, and dynamic mode (DM) at high velocities, respectively. 23 Likewise, the σ–ε curves have different characteristics at different crushing velocities. However, all σ–ε curves have four successively different phases: linear elastic phase, yield phase, flat plateau stress phase, and densification phase. Figure 2 shows the typical response curves of the MRACHs with t of 0.15 mm at a moderate crushing velocity of 40 m/s. The linear elastic phase has tiny deformation and energy absorption, and quickly reaches to the point, P, with the initial peak stress, σ0, corresponding to the initial strain, ε0. Then, the stress drops sharply to a very low level and is then strengthened during the yield phase which is followed by a long flat plateau with large strain and a roughly constant stress level in the flat plateau stress phase until the specimen is densified. In the densification phase, the stress steeply rises and exceeds the preceding values of stress. So, in the cushioning applications, the cushioning material of MRACHs must deform over the initial strain so as to absorb the total kinetic energy of protected object. In other words, the protected object must withstand the initial peak stress.

σ–ε and E–ε curves of MRACHs with t of 0.15 mm at a moderate crushing velocity of 40 m/s: (a) σ–ε curve and (b) E–ε curve.
Following Li et al., 34 Sun and colleagues31,32 viewed the strain corresponding to the first localized maximum value of specimen’s kinetic energy as the densification strain which is called the actual densification strain. Ali et al. 36 and Gibson and Ashby 47 used the expression of 1 − ρ*/ρS to calculate the theoretical densification strain. Our simulations show that the theoretical densification strain is always much larger than the actual densification strain. In actual cushioning applications, its cushioning performance is not fully exhausted if the material deforms to the actual densification strain. However, the reaction stress of protected object, caused by the cushioning material deforming to the theoretical densification strain, must be much larger than σ0 so that the protected object is damaged. In short, there is the most appropriate strain, εM, between actual and theoretical densification strains that is the strain in the densification phase at the point, O, where σ = σ0. The corresponding point, W, on the E–ε curve is located near its inflection point, as shown in Figure 2(b).
At low and high crushing velocities, the σ–ε curves have absolutely different forms from the curves in Figure 2(a). At low crushing velocities, the initial peak stresses on the σ–ε curves of the MRACHs are smaller than any stress values in flat plateau stress phase, as shown in Figure 3. After the point, P, where the linear elastic phase ends, the stress similarly drops to a low level during the yield phase. But in the flat plateau stress phase, the stress is then continuously strengthened to a level and then slowly increase with the increase of strain until densification of specimen. In the flat plateau stress phase, the energy absorption efficiency first increases and then decreases with increasing strain as shown in the Ee–ε curve as shown in Figure 3(b). At the point, M, the energy absorption efficiency has the maximum value and the corresponding strain is the most appropriate strain. After the point, M, the increase of energy absorption cannot keep up with the increase of stress with increasing strain. The specimen has the optimal energy absorption ability at the point, M.

σ–ε and E e –ε curves of MRACHs with t of 0.1 mm at a low crushing velocity of 3 m/s: (a) σ–ε curve and (b) E e –ε curve.
At high crushing velocities, the σ–ε curve fluctuates more and more violently in the flat plateau stress phase with increasing velocities, as shown in Figure 4. The cells are crushed sequentially in the “I”-shaped planar manner and the collapse band is perpendicular to the crushing direction. 23 From the uppermost row of cells, each row of cells is successively involved in the collapse band. When the complete collapse of a row of cells happens, the next cell row has begun to be into the collapse band and meanwhile a new localized maximum value arises on the σ–ε curve (Figure 4). The maximum of all localized maximum values is named the peak stress, σmax. In the same way, the strain corresponding to the stress satisfying σ = σmax in densification phase is the most appropriate strain, εM, as shown in Figure 4.

The σ–ε curve of MRACHs with t of 0.05 mm at a high crushing velocity of 250 m/s.
Optimal energy absorption per unit volume
When ε > εM, the specimen is in the densification phase and σ increases suddenly. In the densification phase, the energy absorption is notable but the stress becomes much larger where the specimen has the elastic modulus similar to that of cell wall material (Figures 2–4). In the cushioning applications, the external kinetic energy should be totally absorbed when ε ≤ εM, otherwise the sharply rising stress damages the protected object.
Therefore, the O points in Figures 2–4, can be called the optimal energy absorption points. The corresponding energy absorption per unit volume is named the optimal energy absorption per unit volume, EO, defined as

Crush force efficiency
The mean plateau stress of MRACHs, σm, is also called dynamic plateau stress and defined as43–46

The crush force efficiency, Fe, is the ratio of the mean plateau stress to σmax, and expressed as 44–46

It evaluates the stress uniformity of a structure during the crushing process. The higher the value of Fe, the better the crashworthiness performance.
Maximum energy absorption efficiency and minimum cushioning coefficient
To accurately describe the energy absorption ability of MRACHs under a certain stress level, hereby another novel term named the maximum energy absorption efficiency, EeM, is defined according to expressions (4) and (7). As shown in Figures 2–4, each specimen has experienced the maximum stress σmax when deformed to εM. So, EeM should be defined as

In combination with expressions (7)–(9), EeM can be further displayed in the form of

The reciprocal of EeM is the minimum cushioning coefficient, CM, expressed as

Optimal specific energy absorption
The specific energy absorption corresponding to εM is named the optimal specific energy absorption, SeO. According to expressions (1) and (6)–(8), SeO of MRACHs is

It is shown that all crashworthiness parameters are related with εM which is an important indicator of the cushioning performance of MRACHs. Moreover, relative density, most appropriate strain, mean plateau stress, and crush force efficiency are four basic terms characterizing the crashworthiness of MRACHs, because other crashworthiness parameters can be calculated by them.
Reliability of FE model
As mentioned above, for the MRACHs with various cell configuration parameters at different crushing velocities, Sun et al. 23 have verified that the inertia effect leads to three different deformation modes of MRACHs, QHM, TM, and DM, similar to other 2D honeycombs.28–41 The same deformation modes are observed.
Under the QHM as shown in Figure 5, the initial deformation of cells in specimen is homogeneous with the transverse expansion which is broken by the “V”-shaped collapse band first appearing near the supporting plate. The alternate cells parallel to the two ramifications of this “V”-shaped collapse band propagate in the way that the slantwise cells in the center of collapse band is packaged by the surrounding four quasi-elliptic collapsing cells. The reverse “V”-shaped collapse band subsequently appearing in the upper part of specimen near the crushing plate also evolves in the same way. Finally, the packaged cells hold the quasi-elliptic shape and gradually collapse from two ends to the center of specimen.

Typical deformation stages of MRACHs for QHM (t = 0.15 mm and v = 3 m/s): (a) ε = 0.076, (b) ε = 0.187, (c) ε = 0.454, and (d) ε = 0.644.
Under the TM as shown in Figure 6, the deformation is inhomogeneous. The upper first row cells first collapse in the form of regularly arranged orange segments. With further crushing, each row of cells deform alternately in two different modes of quasi-circular shape and collapsing ellipse in the collapse band with the transverse expansion. Such alternate deformation mode happens between cell rows so that each quasi-circular cell is also surrounded by four quasi-elliptic collapsing cells. The cells in the center of specimen deform earlier than those in both sides, which leads to the “V”-shaped collapse bands. Quasi-circular cells in all collapse bands strengthen each other so that the cells in both sides of specimen completely collapse earlier than those in center.

Typical deformation stages of MRACHs for TM (t = 0.15 mm and v = 50 m/s): (a) ε = 0.032, (b) ε = 0.211, (c) ε = 0.387, and (d) ε = 0.640.
Under the DM as shown in Figure 7, the cells are crushed sequentially in the “I”-shaped planar manner from the crushing end so that the collapse band is oriented perpendicular to the loading direction with only a single row of cells involved in the collapse band.
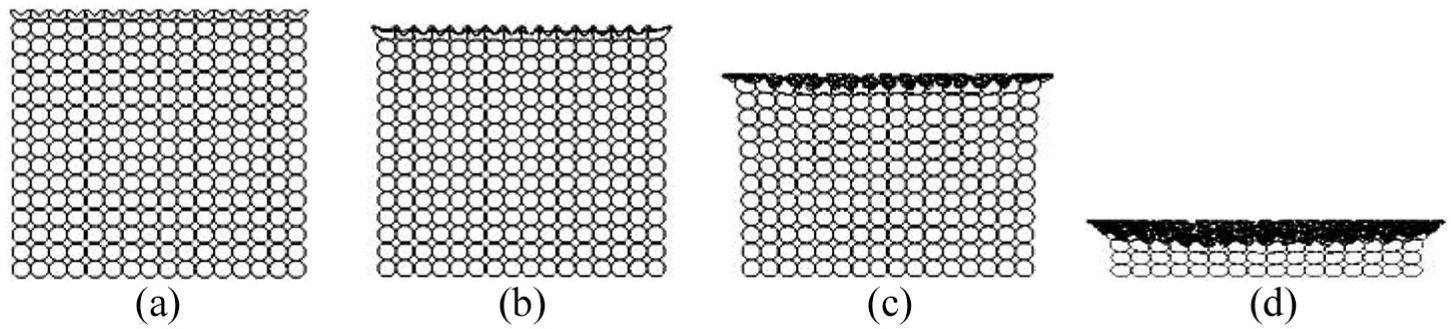
Typical deformation stages of MRACHs for DM (t = 0.15 mm and v = 150 m/s): (a) ε = 0.026, (b) ε = 0.080, (c) ε = 0.256, and (d) ε = 0.765.
As mentioned in section “Most appropriate strain,” all σ–ε curves have four different phases: linear elastic phase, yield phase, flat plateau stress phase, and densification phase, which are similar to the curve patterns of other 2D honeycombs,28–41 even though the σ–ε curves have different characteristics at different crushing velocities. Mean quasi-static and dynamic plateau stresses are discussed in detail in section “Mean plateau stress.” The FE calculated mean plateau stresses have good agreement with the one-dimensional (1D) shock wave model proposed by Reid and Peng 48 and the empirical expressions given by Ruan et al. 30 and Qiu et al. 38 The FE calculated results about the σ–ε curves and mean plateau stresses of MRACHs are also consistent with those simulated by Sun et al. 23
These facts above, such as similarity of deformation modes and pattern of σ–ε curves to the previous investigations, and consistency between FE calculated and theoretical results, all prove that the FE model in our simulations is reliable.
Crashworthiness evaluation
To clarify the influence of cell configuration parameters and crushing velocity on the in-plane crashworthiness parameters of MRACHs mentioned above, FE parametric simulations have been carried out under in-plane crushing loadings. The crushing velocity range is from 1 to 250 m/s. The t values of specimens are 0.03, 0.05, 0.07, 0.1, 0.15, 0.2, 0.25, and 0.3 mm, respectively.
Most appropriate strain
According to the determination method in section “Most appropriate strain,” the calculated εM values of MRACHs are listed in Table 1. Similar to the densification strains, 23 the most appropriate strains of MRACHs are affected both by the t/R ratio and v under the in-plane dynamic crushing loadings. Generally, the εM values of MRACHs decrease with increasing t/R ratio for a given v and increase with increasing v when the t/R is fixed. This is due to that difference in-plane crushing velocities result in different deformation modes that determine the εM values of MRACHs. Sun et al. 23 gave out the empirical equations of two critical velocities of mode transition for three in-plane deformation modes of MRACHs as

where vQ2 is the critical velocity of mode transition from TM to DM and vQ1 is from QHM to TM. The corresponding vQ2 values are listed in the 27th row of Table 1.
Most appropriate strains of the MRACHs with R of 3 mm under the in-plane crushing loadings.

MRACHs: multi-layer regularly arranged circular honeycombs.
More FE simulations were carried out at the crushing velocities ranging from 1 to vQ2 in contrast with the calculations of Sun et al. 23 and the corresponding results are listed in Table 1. Under QHM, the initial deformation is well distributed in every part of specimen. The subsequent localized collapse bands break the deformation uniformity and strengthen the load-bearing ability of specimen, so that the decrement beginning of Ee triggers the emergence of εM. The lower the crushing velocity, the closer the response of specimen is to the static. At the low crushing velocity of 1 m/s, the ration of kinetic energy to internal energy in specimen is so small (<5%) 49 that the corresponding quasi-static most appropriate strain, εMQ, is approximately equal to the static one. From our simulations, it is shown that the crushing is quasi-static at the low crushing velocities (v ≤ 5 m/s) and the corresponding average values of εM is regarded as εMQ listed in the 28th row of Table 1. Under DM, the planar “I”-shaped collapse band has been compacted during the deformation course and continues to move forwards until the specimen is totally densified. Such deformation characteristic means that the influence of v on εM can be neglected when the specimen deforms under DM at the high crushing velocities. Therefore the average most appropriate strain under the DM is viewed as the most appropriate strain for DM, εMD, listed in the 29th row of Table 1. So, it can be said that εMQ and εMD are only associated with the configuration parameters of MRACHs.
Being similar to the densification strain, theoretically εM has linear relationship with

where λ is the correction coefficient and k0 is a constant. Generally speaking, theoretically k0=1 but its actual value is less than and tends to reach 1 with increasing v. Based on our calculated results in Table 1, as shown in Figure 8(a), εMQ and εMD can be best fitted by, respectively


Fitted εM–t/R curves of MRACHs under the in-plane crushing loadings (R = 3 mm): (a) for QHM and DM and (b) under different crushing velocities.
For a given crushing velocity (5 m/s ≤ v ≤ vQ2), it is also seen that εM–t/R curves can also be well fitted by expression (15) as shown in Figure 8(b) and the corresponding values of k0 and λ are listed in the last two columns of Table 1, respectively. It is confirmed that k0 increases and tends to reach 1 with increasing v, and meanwhile λ decreases slowly.
For a given t/R ratio, the specimen of MRACHs experiences the QHM and TM in turn with increasing velocities from 5 m/s to vQ2. As shown in Figure 9(a), the increase of εM with increasing v under the QHM is much faster than that under the TM where the densification strain is linearly related to v nearly as reported by Sun et al. 23 Thereby, it is shown that the following empirical expression can best fit the εM–v curve (Figure 9) for a given t/R ratio

The combination of expressions (16)–(18) generates the complete empirical expression of εM as follows


Fitted εM–v curves of MRACHs under the in-plane crushing loadings (R = 3 mm): (a) t = 0.15 mm, (b) t = 0.05 or 0.20 mm, (c) t = 0.07 or 0.25 mm, and (d) t = 0.10 or 0.30 mm.
Mean plateau stress
From the determination method of εM in section “Most appropriate strain,” it is seen that εM is close to the dynamic densification strain, εD, of MRACHs. 23 Under QHM, εM is a little smaller than εD while εM is slightly larger than εD under TM and DM. Such difference between them is too little to change the laws of mean plateau stress on v and t/R. A 1D shock wave model proposed by Reid and Peng can be used to explain the inertia effect of MRACHs under dynamic crushing loadings and the mean plateau stress can be expressed as 48

where σS is the static plateau stress and Av2 is the dynamic enhancement caused by the inertia effect. The relation parameter of crushing velocity, A = ρ*/εSD. εSD is the static densification strain.
Ruan et al. 30 and Qiu et al. 38 gave the following empirical expressions of mean plateau stress


Here, A1, C2, C1, C0, B1, and B2 are the fitting coefficients depending on the configuration parameters of honeycomb cores, and apparently 37

For each t/R ratio of MRACHs, the calculated σm values at the crushing velocities 1–250 m/s are listed in Table 2. It is seen that expression (20) has good agreement with the calculated results for the MRACHs, as shown in Figure 10. At a very low crushing velocity, for example, v = 1 m/s, the mean plateau stress can be viewed as the corresponding σS.
49
From the least-square fitting, the fitted

The A values obtained by the least-square fitting from expression (20) are listed in the last row of Table 2. Based on expressions (1), (21), and (22), the A–t/R curves fitted by the least-square fitting are shown in Figure 12. The absolute squared errors between the formula prediction and the FE results are 157.7016, 914.5932, and 295.9599 corresponding to expressions (21)–(23), respectively. This shows that expression (21) best fits the FE results for the MRACHs. The fitting coefficients are C2 = 1.3280, C1 = 0.8986, C0 = 0.0013, B1 = 1.0763 and B2=0.5996, respectively. So, the mean plateau stress of MRACHs can be calculated by each of the following formulas


σm–v curves of the MRACHs with different t/R ratios (R = 3 mm).

Mean plateau stresses of MRACHs (R = 3 mm) under in-plane crushing loadings.

MRACHs: multi-layer regularly arranged circular honeycombs.
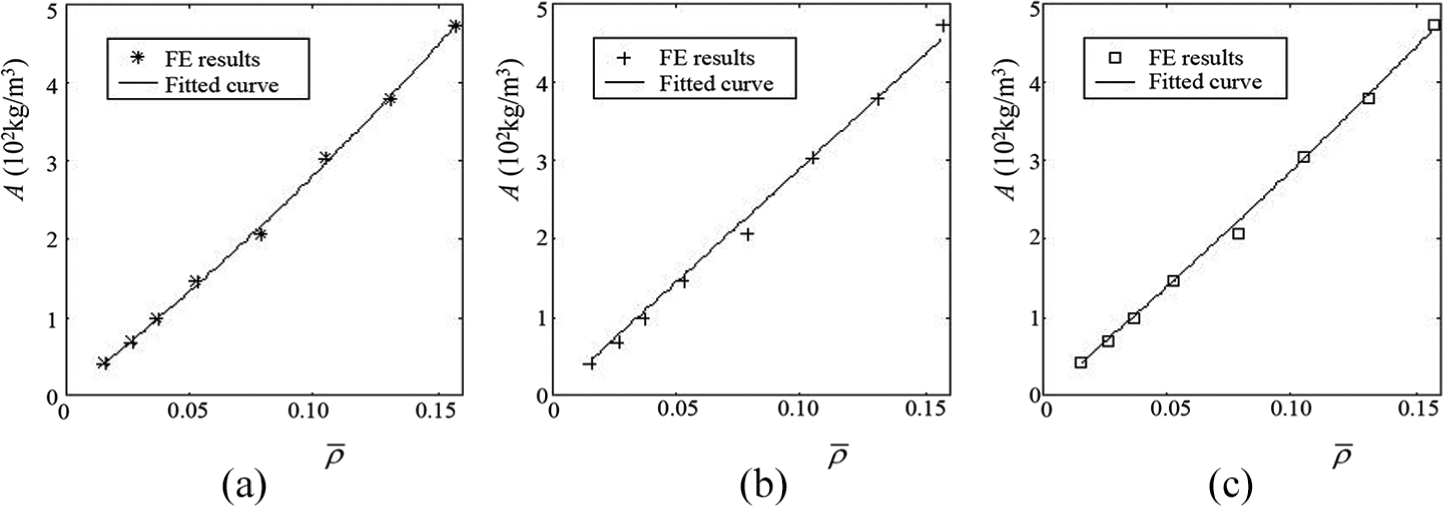
Fitted
Crush force efficiency
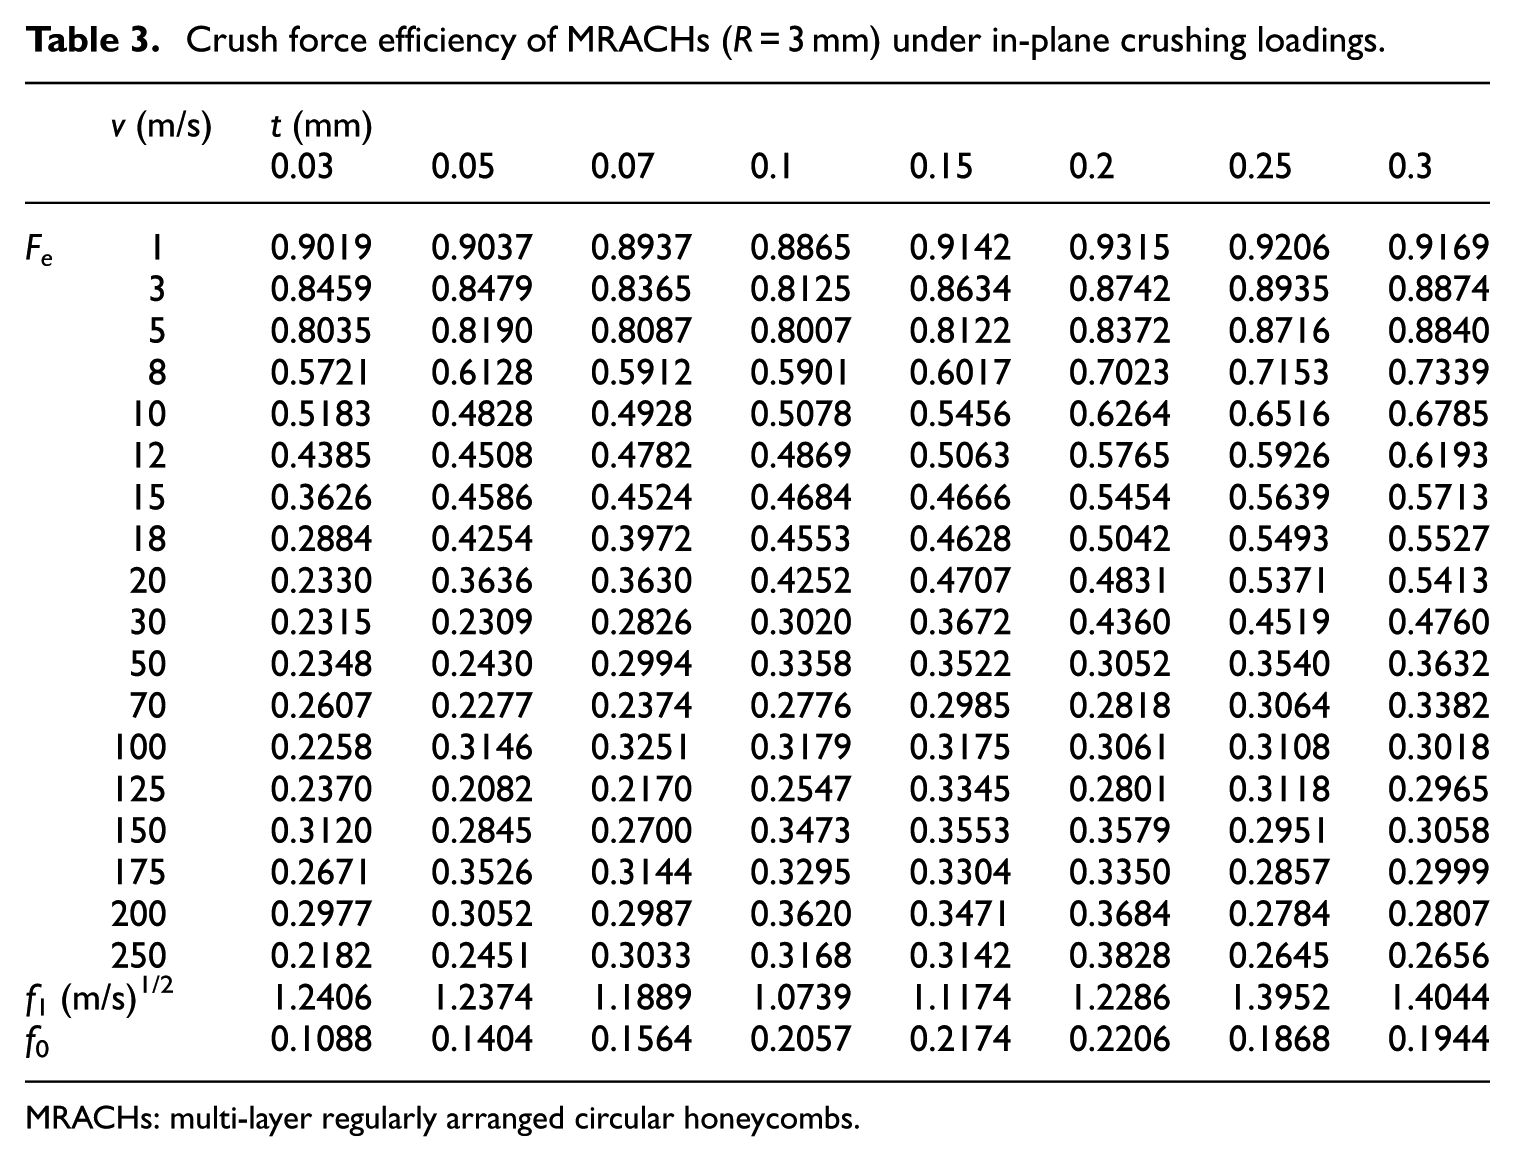
For each t/R ratio, the FE calculated Fe values of MRACHs at different crushing velocities are calculated according to expression (9) and listed in Table 3. It is shown that Fe is approximately independent of t/R and sensitive to the crushing velocity especially ranging from 1 m/s to vQ2. For the sake of brevity, only four typical Fe–v curves are depicted in Figures 13 (a)–(d) for t=0.05, 0.1, 0.2, and 0.3 mm, respectively. The patterns of σ–ε curves influence the crush force efficiencies of MRACHs at different crushing velocities.
Crush force efficiency of MRACHs (R = 3 mm) under in-plane crushing loadings.
MRACHs: multi-layer regularly arranged circular honeycombs.

Fe–v curves of the MRACHs with different t/R ratios (R = 3 mm): (a) t = 0.05 mm, (b) t = 0.1 mm, (c) t = 0.2 mm, and (d) t = 0.3 mm.
Under QHM, the typical σ–ε curve is shown in Figure 14(a) and the corresponding σ0 is approximately equal to σm. The slight increase of stress level yields the maximum value of Ee before the densification phase comes so that the corresponding σmax is slightly greater than σm. So, Fe is slightly smaller than 1 and approaches to 0.9. The average crush force efficiency at the crushing velocity of 1 m/s is viewed as the static crush force efficiency, FeS, expressed as

When v > 1 m/s, the σ–ε curves are shown in Figure 14(b)–(f). First there comes the point P corresponding to the initial peak stress during the linear elastic phase and meanwhile the first row cells of specimen reach the elastic limit and begin the plastic collapse (Figure 14(b)). With increasing velocities, the initial peak stress increases and becomes larger than σm (Figure 14(b)–(d)) so that Fe becomes smaller. When the crushing velocity goes up to a certain extent (v > vQ2), Fe drops and fluctuates up and down around a level of about 0.3 (Figure 13). Under dynamic loadings (Figure 14(b)–(d)), the total deformation of specimen is not homogeneous any more and the linear elastic phase exhausts smaller strain than the static loading (Figure 14(a)). The plastic deformation occur in turn in lower cell layers after the yield phase, which leads to the stress peaks and oscillation during the flat plateau stress phase (Figure 14(c)–(f)). Moreover, such oscillation becomes more obviously and violently with increasing velocities ((Figure 14(d)–(f)). But the influence of such oscillation on Fe can be neglected; that is to say, Fe becomes independent of v (Figure 13). When v > vQ2, Fe fluctuates up and down around a level. When v > 1 m/s, for a given t/R ratio, the law of dynamic crush force efficiency, FeD, on v can be fitted by

where f1 and f0 are fitting coefficients about the t/R ratio. The corresponding values of f1 and f0 calculated by the least-square fitting are listed in the last two rows of Table 3. To sum up, the empirical expression of Fe can be represented as


σ–ε curves of MRACHs under different crushing velocities (t = 0.3 mm): (a) v = 1 m/s, (b) v = 5 m/s, (c) v = 12 m/s, (d) v = 50 m/s, (e) v = 125 m/s, and (f) v = 200 m/s.
Maximum energy absorption efficiency
For each t/R ratios, the EeM values of MRACHs at different crushing velocities are calculated according to expression (11). Under quasi-static crushing loading, for example, v = 1 m/s, expression (16) means that the static most appropriate strain has linear relationship with t/R ratio and expression (29) shows that the static crush force efficiency is constant. So, in view of expression (11), the static maximum energy absorption efficiency, EeMS, should be linearly related with t/R ratio as shown in Figure 15. The corresponding FE calculated results can be best fitted by

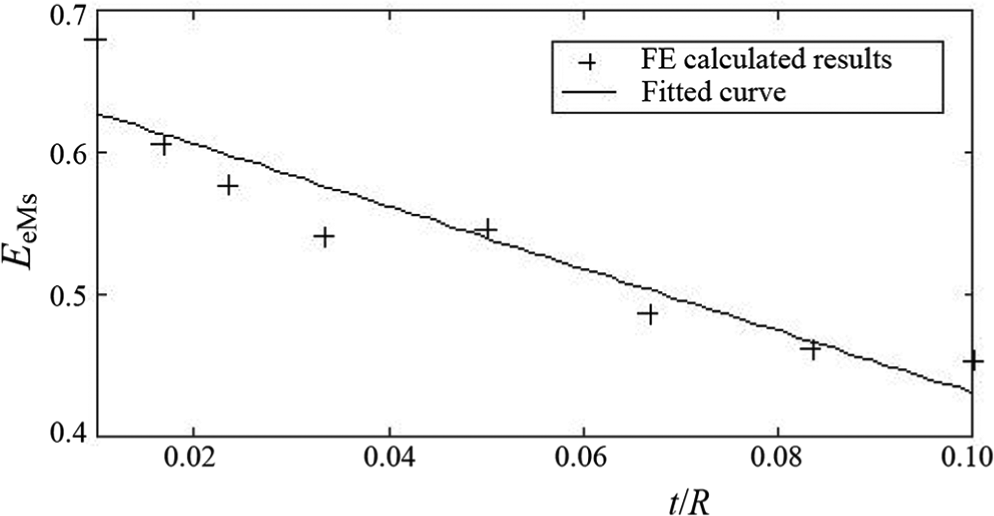
EeMS–t/R curve of the MRACHs (R = 3 mm).
Fe fluctuates up and down around a level of 0.3 although Fe approximately satisfies with expression (30) when v ≥ vQ2. Expression (17) means that the most appropriate strain has linear relationship with t/R ratio but the εMD has small range from 0.8802 to 0.9645 when v ≥ vQ2. So, the maximum energy absorption efficiency under DM is nearly constant for a given t/R ratio as shown in Figure 16. When vQ2 > v > 1 m/s, Fe drops about from 0.9 to 0.3 (Figure 13) and εM increases approximately from 0.5 to 0.9 (as listed in Table 1) with increasing crushing velocities so that EeM roughly decreases from 0.5 to 0.27 and then fluctuates between 0.23 and 0.33 (Figure 16). From Figure 16, it is shown that the law of EeM–v curve is analogous to that of Fe–v curve (Figure 13) following the form of expression (31) for a given t/R ratio.

EeM–v curves of the MRACHs with different t/R ratios (R = 3 mm): (a) t = 0.05 mm, (b) t = 0.1 mm, (c) t = 0.2 mm, and (d) t = 0.3 mm.
Verification of empirical expressions
In combination with expressions (13) and (19), SeO can finally be expressed as

where σm can be calculated through one of expressions (26)–(28). For the sake of brevity, typical SeO–v curves are depicted in Figures 17–19 only for the MRACHs with the t/R ratios of 0.01, 0.05, and 0.1, respectively. As shown in Figures 17–19, the theoretical values of SeO corresponding to one of expressions (26)–(28) and the FE calculated results at different crushing velocities are plotted, respectively.

SeO–v curves of the MRACHs with the t/R ratio of 0.01 based on different empirical expressions of σm: (a) expression (26), (b) expression (27), and (c) expression (28).

SeO–v curves of the MRACHs with the t/R ratio of 0.05 based on different empirical expressions of σm: (a) expression (26), (b) expression (27), and (c) expression (28).

SeO–v curves of the MRACHs with the t/R ratio of 0.1 based on different empirical expressions of σm: (a) expression (26), (b) expression (27), and (c) expression (28).
From Figures 17–19, it is shown that the empirical expression (33) has good consistency with the FE calculated results of SeO, which validates the empirical expressions (19) and (26)–(28) of σm and εM.
Conclusion
In this article, using the FE source codes ANSYS/LS-DYNA, the influences of t/R ration and crushing velocity on the in-plane crashworthiness of MRACHs under in-plane crushing loadings are studied when t/R is from 0.01 to 0.1 and the crushing velocity is from 1 to 250 m/s.
The crushing plate moves at a constant crushing velocity until the specimen collapses absolutely, and the support plate is stationary. The corresponding reliable FE model is constructed using ANSYS/LS-DYNA. R is 3 mm for all simulations. The bilinear model is used to characterize the stress–strain relation of cell wall material. In addition, the behavior of cell wall material is treated as rate-independent. Some tentative simulations determine the proper cell number of specimen and b value. The convergence calculation confirms the element edge length.
Basic terms of stress, strain, energy absorption per unit volume, energy absorption efficiency, cushioning coefficient, and specific energy absorption are systemically summarized. A new mechanical term, most appropriate strain, is put forward, which results in a novel evaluation methodology of crashworthiness. The computational formulas of new evaluation parameters, such as optimal energy absorption per unit volume, mean plateau stress, crushing force efficiency, maximum energy absorption efficiency, minimal cushioning coefficient and optimal specific energy absorption are presented. The theoretical analysis shows the most appropriate strain is a significant parameter for measuring the crashworthiness.
For a given crushing velocity, the most appropriate strain is only associated with the configuration parameters and has linear relationship with the relative density of MRACHs. For a given t/R ratio, at the crushing velocities from 5 m/s to vQ2, the increase of εM with increasing v under the QHM is much faster than that under the TM where εM is linearly related to v nearly. The law of mean plateau stresses on v is consistent with the 1D shock wave theory proposed by Reid and Peng. 48 The FE results of mean plateau stresses can be well fitted by the three empirical expressions given by Qiu et al. 38 It is shown that crushing force efficiency is approximately independent of t/R and sensitive to the crushing velocity ranging from 1 m/s to vQ2. Under quasi-static crushing loading, the crushing force efficiency is approximately equal to 0.9086. When v > 1 m/s, Fe becomes smaller with increasing velocities. When the crushing velocity goes up to a certain extent (v > vQ2), Fe drops and begins to fluctuates up and down. Under dynamic loadings, Fe becomes independent of v and fluctuates around a level of 0.3. Under quasi-static crushing loading, the maximum energy absorption efficiency is linearly related with t/R ratio. When vQ2 > v > 1 m/s, EeM roughly decreases from 0.5 to 0.27 and then fluctuates between 0.23 and 0.33. When v ≥ vQ2, the maximum energy absorption efficiency under DM is nearly constant for a given t/R ratio. It is shown that the law of EeM–v curve is analogous to that of Fe–v curve for a given t/R ratio. Based on numerical simulations, the empirical expressions of most appropriate strain, mean plateau stress, crushing force efficiency, and maximum energy absorption efficiency are given. The comparison between the FE calculated and empirically calculated results of optimal specific energy absorption validates these empirical expressions.
Footnotes
Declaration of conflicting interests
The author(s) declared no potential conflicts of interest with respect to the research, authorship, and/or publication of this article.
Funding
The author(s) disclosed receipt of the following financial support for the research, authorship, and/or publication of this article: This work is financially supported by the National Natural Science Foundation of China (51575327), the Program for Innovative Talents Promotion of Shaanxi Province (2017KCT-02), and the Key Laboratory Research Project of Education Department of Shaanxi (16JS014).