
Abstract
Based on the biological characteristics of earthworm, the dorsal pore jet parameters were analyzed to establish elbow erosion model. The discrete phase model and standard k-ε turbulence model were used to carry on numerical simulation of the erosion characteristics and study the mechanism of improving elbow erosion characteristics. The results showed that the most serious erosion area was the elbow lower surface, while bionic earthworm dorsal pore jet could significantly reduce the erosion rate of this area, thereby reducing the overall erosion rate. When the jet velocity was the same, the smaller the jet distance, the lower the erosion rate would be. With the increase of the jet velocity, the erosion rate decreased first and then increased. When the jet distance was 0.5 times the elbow diameter and the jet velocity was 0.3 times the flow velocity, the erosion rate was the lowest (decreased by 79.29%). When the jet velocity was less than 0.5 m·s−1, low-velocity strips formed at elbow lower surface due to the jet and reduced the kinetic energy of the solid particles near the wall; when the jet velocity was greater than 0.2 times the flow velocity, vortex cushion effect formed, therefore reduced the erosion rate significantly.
Introduction
In the actual gas phase and liquid phase transport, the fluid in the pipeline generally contains a certain amount of solid particles, which is the main reason for the erosion of the pipeline. While in the pipeline system, elbow is considered as a key component, mainly because the elbow is under complicated forces, which leads to high stress. And elbow is the most vulnerable part to erosion, which has the highest risk coefficient.1,2 Previous studies have shown that the erosion of elbow is 50 times more serious than that of the straight-through part in pipeline transportation; failure analysis of boiler tubes indicated that about one third of the pipe accident was caused by impact erosion.3–5 Usually, by studying the impact erosion characteristics of solid particles on the elbow, we could use better erosion resistance material or spray abrasion resistant coating on the elbow to strengthen it.6,7 In recent years, by applying bionics to engineering fields, better performance could be achieved. In the long process of evolution, organisms have evolved to the physical structure and function to adapt the environment. In the study of bionics, specific functions are realized by defining the working principles of the biological system and using the methods of analogy, simulation, and reconstruction of the model. For example, imitate the arrangement of parenchyma cells gathered as a closed-cell foam matrix and helically arranged fiber bundles, to enhance axial compressive strength. 8 And according to the principle of turtle hydrofoil movement, the biomechanical optimization control design 9 was provided. Wang et al. 10 introduced the structural bionics (the human tibia) to the structural design of crash box; the novel crash box could improve the energy absorption characteristics and comprehensive crashworthiness more effectively. In the study of Wolfgang Tillmann et al., 11 they found that bionic structures were suitable to locally adjust the friction condition and proved to be an appropriate method to control the material flow of sheet metals in bulk forming operations.
Studies on earthworm crawling and body surface showed that earthworm dorsal pore could secrete the body liquid, which could not only assist respiration but also reduce the damage on the body surface from environment.12,13 In addition, the change of biological charge caused by the body liquid also played a role to protect the surface of earthworms.14–16 Imitating the ability of the earthworm body surface to resist wear can promote the progress of wear-resistant technology. Based on the biological characteristics of bionic earthworm dorsal pore jet, the biological parameters of the jet were analyzed, and the engineering model of elbow erosion was established. Computational fluid dynamics method was adopted to study the influence of the jet on the erosion characteristics of the elbow and explore the mechanism of reducing the erosion rate of the elbow surface.
Earthworm biological characteristics
Earthworm is a typical animal of oligochaeta of annelida. They live in a wet environment and feed on the corrupted organic matter. The body is cylindrical, bilaterally symmetrical, and divided into more than 100 metameres. From the 11th metamere, there is a dorsal pore in the center of the back of each metamere. Earthworm is an invertebrate and has no skeleton. The body surface is exposed and with no corneum, only covered with a layer of corneum membrane. Apart from the first two metameres of the body, the rest of the metameres have setaes. 17 Figure 1 is a photo of pheretimoid earthworm.

A photo of pheretimoid earthworm. 17
The muscle of earthworm is oblique muscle, which accounts for about 40% of the body volume, and the muscles are developed and flexible. Through the alternately contractile and diastolic of the longitudinal and ring muscles of different metameres, the contractile waves of the muscles are gradually transferred from the front to the back. The setaes are produced by the seta sac in the epithelium, and the component is mainly chitin. The epithelial tissue that wraps the setae can stretch and contract be traced by the traction of the muscle bundle. Earthworms rely on muscle contraction to provide power and rely on setae to attach to the uneven ground of the soil, so as to increase the friction between the body and the ground and move the body forward.18,19 The transverse of the earthworm and the position of the dorsal pore are shown in Figure 2.

(a) The transverse of the earthworm; (b) the position of the dorsal pore. 17
The body wall of the earthworm consists of the corneum membrane, the epithelium, and the longitudinal and ring muscles. The outermost layer is a monolayer columnar epithelial cell, and the exudates of these cells form the corneum membrane. 20 However, the corneum membrane is very thin. When earthworms is moving in the ground and soil, they are easily damaged by the collision and friction of stone and gravel.
Therefore, the epithelia of the earthworm can secrete ivory-white protein dilute solution with high water content. When earthworms are in a dry or irritating environment, dorsal pore can spray the solution secreted by epithelia, forming a lubricating interface between the soil and body surface, to reduce the impact from soil particles and protect body surface. At the same time, when the earthworms stretch forward, single metamere forms convex gap between the soil and body surface. The solution injects into the gap and reduces the contact area of earthworm body and soil, so as to reduce the damage. In addition, when earthworms are stimulated by the surrounding soil during movement, they will form a positive and negative potential distribution on body surface, which can improve the distribution of the solution film on surface and increase the film thickness, to avoid the adhesion of soil particles and the impact erosion. 21
Earthworm dorsal pore jet characteristics and bionic jet model
Measurement of jet velocity of earthworm dorsal pore
In order to determine the jet velocity of earthworm dorsal pore, 10 live pheretimoid earthworms of close size were selected and carefully cleaned with warm water, and were numbered as 1–10. The earthworm numbered 1 was placed in a tray, and the position of the earthworm dorsal pore was adjusted to vertical upward. And the head and tail of the earthworm were gently pressed with tweezers. We absorbed a small amount of 75% alcohol and dropped it on the back of the earthworm. Under the stimulation of alcohol, some dorsal pores spray the body solution. The laser displacement sensor was used to measure the height of the solution spray height h (the measurement accuracy of the laser displacement sensor is 0.03–0.1 mm), and the data were collected. The above experiment was repeated on the earthworms numbered 2–10, and the solution spray height of dorsal pore was measured and recorded. The initial dorsal pore jet velocity v0 could be calculated by equation (1)

In the equation, g is acceleration of gravity.
The experimental data and calculation of dorsal pore jet velocity were shown in Table 1.
The experimental data and dorsal pore jet velocity.
Known from Table 1, earthworm dorsal pore jet velocity was relatively stable, and its amplitude was maintained in the interval of 0.5–0.65 m·s−1.
Design of elbow jet model
Bionic design needs to be adaptable to the practical working conditions based on the biological characteristics. In order to study the interaction change of earthworm body surface and soil particles under dorsal pore jet, and fluid mechanics characteristics of solid–liquid two-phase flow when jet flow mixing with soil particles, and the application of jet flow in actual working conditions to improve the erosion characteristics, it is necessary to establish a reasonable model of bionic jet. The main improvement are the following: compared with the instantaneous jet of earthworm dorsal pore, it is necessary to provide stable jet supply in actual working conditions; when earthworm moves in the soil, it needs to reduce the wear and erosion of the body surface by the jet, but there is no completely similar condition in the actual working condition, so it could be analogous as a cylindrical elbow pipe transporting solid–liquid two-phase flow.
Based on the characteristics that earthworms reduce the erosion of soil particles to the body surface by dorsal pore jet, we established the elbow jet model, as shown in Figure 3. The elbow jet model included the inlet straight pipe section, the outlet straight pipe section, the elbow section, and the jet section. The inlet straight pipe section, the elbow section, and the outlet straight pipe section were the mainstream field, conveying fluid containing a certain amount of solid particles. The pressurized fluid was input into the mainstream field through the jet section, and the continuous supply of jet fluid was realized based on the simulation of earthworm dorsal pore jet.

Schematic diagram of elbow jet model.
The actual working condition of a slurry pipeline was the data source. The medium of the pipeline was water containing sand, and the working environment was at normal temperature and atmospheric pressure. The main composition of the sand particles was SiO2. The particles could be considered as a sphere with a diameter of 0.2 mm. The particle mass concentration was 20.97%. The geometric parameters of the pipe were as follows: nominal size DN150, diameter d = 112.72 mm, elbow radius R = 3d = 338.16 mm. In order to make the mainstream fully extended, the inlet straight pipe section and the outlet straight pipe section were set before and after the elbow, and the length of the straight pipe section lin = lout = 1000 mm. The mainstream flow velocity v = 3.8 m·s−1. The jet hole diameter djet = d = 112.72 mm, namely the jet pipe and the inlet pipe intersecting. Jet pipe length ljet = 200 mm.
The jet parameter was derived from the earthworm dorsal pore jet, but it should be optimized and improved according to the actual working conditions. Therefore, two variables, jet distance l (the distance between the jet section axis and the elbow section entry) and the jet velocity vj, were set up to explore the best parameters of the jet. vj first set as the jet velocity of earthworm dorsal pore, 0.5 m·s−1, to study the influence on the flow field and wall erosion characteristics when l = 0.5 d, 1.0 d, and 1.5 d, respectively. At the same time, in order to study the relationship between vj and v, the numerical simulations of vj = 0.1 v, 0.2 v, 0.3 v, and 0.4 v were carried out, respectively.
Numerical calculation method of elbow jet
The fluid field models of elbow jet with different l were established. In order to ensure the accuracy and convergence of the calculation, structured mesh was adopted. Mesh refinement was carried out on the wall of the elbow, and the number of boundary layers was 12. Three monitoring surfaces (the wall of the outlet straight pipe, the upper wall of elbow, and the lower wall of elbow) were set to quantitatively analyze the overall erosion characteristic of the fluid domain.
The mainstream field conveying sand containing water was a typical solid–liquid two-phase flow. The medium of jet was water. It was necessary to make the following assumptions on the numerical calculation of the solid–liquid two-phase flow. (1) Liquid water was the first phase. The solid particle size was uniform and the shape was spherical. The solid particle was the second phase, there was no phase transition. (2) The solid particles of the incoming flow were evenly distributed in liquid water.
The discrete phase model of the particle orbit was adopted to solve the particle velocity, flow field, and erosion characteristics. The erosion model proposed by Oka was used to calculate and analyze the effect of erosion characteristics of elbow under different jet parameters. The computational equations of this model were equations (2) and (3)22,23


In the equations, WR is the weight loss rate. Fp is the particle properties coefficient; it was assumed that the object of the study was spheroidal particles, so Fp = 1. vp is the solid phase impact velocity, m·s−1. θ is the impact angle of particles, deg. ER is erosion rate, kg·s−2·m−1. mp is the mass of a single solid particle. t is the total collision time. Acell is the wall mesh area of computational element. F( θ ) is the impact angle function, piecewise linear distribution according to the parameters of Table 2.
Impact angle function.
It can be seen from the above equations that the erosion rate of the wall is closely related to three parameters, which are impact angle, impact velocity of particles, and the number of particle collisions. But in fact, Meng and Ludema 24 summed up a large number of erosion equations and erosion models and found that the variables affecting the erosion rate were more than 100. It is almost impossible for a single model to consider all factors that affect the erosion rate. However, the Oka model can obtain more accurate prediction results in the range of discrete phase calculation.
Set discrete phase reflection coefficients. The normal polynomial function was as equation (4), and the tangent polynomial function was as equation (5)


In the equations, yn and yt are the discrete phase reflection coefficient of normal and tangential direction, respectively.
The standard k-ε turbulence model and SIMPLEC pressure velocity coupling algorithm were adopted. The inlet boundary was set as velocity inlet of 3.8 m·s−1, and the outlet condition was free outflow. The inlet of the jet was set as velocity inlet, and the results of different vj were calculated sequentially. The first order upwind scheme was used to calculate the flow field. All the wall surfaces were non-slip conditions. The atmospheric pressure was defined as the reference pressure. The convergence accuracy was 10−3.
Influence of different jet distance on flow field and erosion characteristics
Analysis of the erosion rate of different jet distance
Figure 4 is the line chart of average erosion rate of monitoring surface of original model and average erosion rate at different l of vj = 0.5 m·s−1. From Figure 4, when the jet section was set, monitoring surfaces total average erosion rate decreased sharply: the monitoring surfaces total average erosion rate was 1.12 × 10⁻⁶ kg·s−2·m−1. But when the jet section was set and l = 1.5 d, ER = 3.38 × 10⁻⁷ kg·s−2·m−1, there was a significant decrease of 69.82%. And when l = 0.5 d, ER = 2.62 × 10⁻⁷ kg·s−2·m−1, there was a significant decrease of 76.61%. It showed that the jet section had a significant effect on reducing the erosion of the elbow. At the same time, the smaller the jet distance, the greater the decrease of the erosion rate would be. When l = 0.5 d, the jet section was tangent to the elbow section, and the erosion rate was the lowest. When the jet section was not set, the average erosion rate of the lower wall of elbow was much higher than the other two monitoring surfaces; when the jet section was set, or jet distance changed, change trend of the average erosion rate of the lower wall of elbow was the same as the total average erosion, which meant that the erosion of the lower wall of elbow was the leading part of the elbow erosion. When the jet section was set, the average erosion rate of the upper wall of elbow and the wall of outlet straight pipe was slightly increased, while the change of the erosion rate was small when jet distance changed.
Average erosion rate of monitoring surface of original model and average erosion rate at different l of vj = 0.5 m·s−1.
Figure 5 is the contour of the erosion rate of monitoring surfaces of original model and the erosion rate at different l of vj = 0.5 m·s−1. From Figure 5, it could be seen that when the jet section was not set, the whole lower wall of elbow was worn out, and the erosion rate was very high. The erosion rate of the wall of outlet straight pipe was low, and the erosion occurred in scattered and discontinuous area and was of no regularity. And there was hardly any erosion on the upper wall of elbow. Compared with that without jet section, when the jet section was set, as shown in Figure 5(b)–(d), even if l was different, the changing trend of the erosion rate of the monitoring surface was the same: the erosion area and erosion rate of the lower wall of elbow were all decreased; erosion appeared on the upper wall of elbow, and the erosion area was on both sides of the upper wall, while the erosion rate was relatively low; large area of the outlet straight pipe section showed a certain wear erosion, but it was less than the lower wall of elbow. When l = 1.5 d, the erosion of the lower wall of elbow decreased remarkably, and almost no erosion was found. But an erosion strip appeared in the central axis of the outlet pipe. With the decrease of l, the erosion rate of the lower wall of elbow decreased continuously, and the decreasing trend developed along the axis to the top of lower wall and expanded to both sides; the erosion area of the upper wall of elbow slightly expanded, but the erosion rate of the wall of outlet straight pipe decreased gradually, and the erosion area decreased, the erosion strip also disappeared.

Erosion rate of monitoring surface of original model and erosion rate at different l of vj = 0.5 m·s−1: (a) original model; (b) l = 0.5 d; (c) l = 1.0 d; (d) l = 1.5 d (the lower left: the upper wall of elbow; the lower right: the lower wall of elbow; the middle: wall of outlet straight pipe).
From the above analysis, though the jet would cause a slight erosion increase of the straight pipe section and the upper wall of elbow, the erosion of the whole area actually dominated by the erosion of the lower wall of elbow. The effect of the jet was mainly to reduce the average erosion rate of the whole area by reducing the erosion of the lower wall of elbow. When l decreased, the total erosion rate of the monitoring surface would further decreased. The erosion rate of the lower wall of elbow and the outlet straight pipe further decreased, and the erosion rate of the upper wall of elbow would increase slightly.
Anti erosion mechanism of different jet distance
According to the main parameters in the erosion equations—impact angle, impact velocity of particles, and the number of particle collisions—in order to reveal the anti erosion mechanism of bionic earthworm dorsal pore jet, the velocity, streamline, velocity angle, and particle trajectory in the flow domain were analyzed. And according to hypothesis (2), the velocity and velocity angle of the liquid phase in a certain position in the flow field could be considered as the velocity and velocity angle of the solid particle in this position.
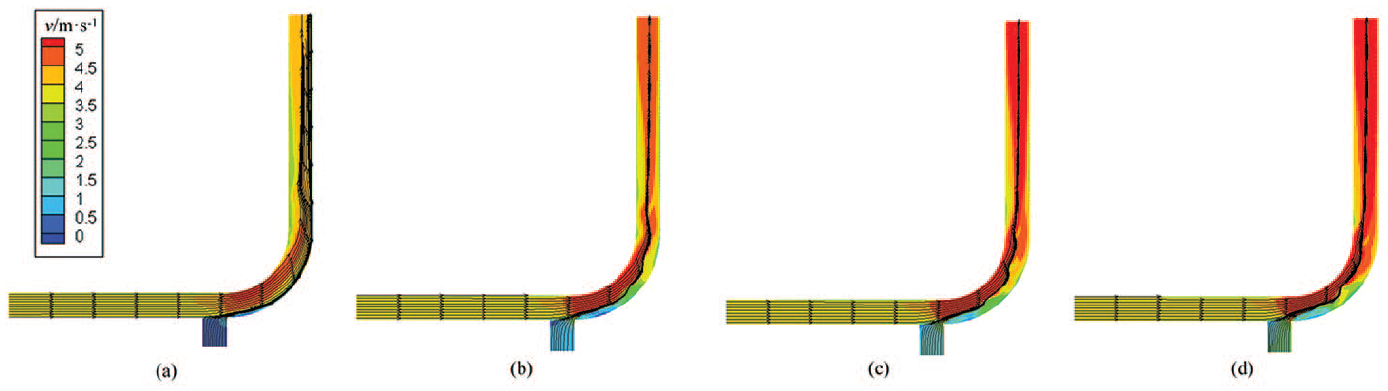
Figure 6 is the velocity contour and streamline of axial section of fluid domain of original model and erosion rate at different l of vj = 0.5 m·s−1. From Figure 6, the jet had the following effects on the main flow field in the elbow:
The jet had converged effect on the fluid near the jet side in the mainstream field. Under the influence of the jet, the streamline near the wall converged to the center of the flow field, while the fluid opposite to the jet side was closer to the wall due to the action of the jet.
Due to the influence of jet, low-velocity strip and zone formed in the bottom boundary layer of the lower wall of elbow, and the strip and zone gradually expanded with the decrease of l. The Reynolds number of the fluid in the low-velocity strip and low-velocity zone became lower, and the velocity gradient decreased greatly, so as to inhibit the turbulent bursting strength. At the same time, the viscous force and the Reynolds shear stress of boundary layer decreased, so the solid particles entering the area by kinetic energy reduced, the impact erosion also decreased.
Contrary to the lower wall of elbow, when the jet section was not set, the fluid velocity of upper wall of elbow was higher. Due to the influence of the jet, the velocity was further increased, and the original high velocity gradient became larger. The velocity pulsation near the wall also increased, which led to more serious turbulent burst near the wall, and the flow state was more difficult to predict. The turbulent kinetic energy of the fluid was transmitted to the solid particles in this region, causing serious erosion.
The jet would cause the fluid velocity of outlet straight pipe increase, but with the decrease of l, the velocity reduced gradually, approaching the state of original model. The higher the velocity of the fluid meant the higher the impact velocity of the solid particles to the wall, so the erosion rate of the outlet pipe was slightly higher when l was larger.

Velocity contour and streamline of axial section of fluid domain of original model and erosion rate at different l of vj = 0.5 m·s−1: (a) original model; (b) l = 0.5 d; (c) l = 1.0 d; (d) l = 1.5 d.
Figure 7 is the velocity angle contour and the solid particle trajectory of axial section of fluid domain of original model and erosion rate at different l of vj = 0.5 m·s−1. From Figure 7, due to the influence of the jet, a low-velocity angle strip formed on the lower wall of elbow, while the jet had little effect on the velocity angle in the other regions of the mainstream. Due to that the particle erosion obeyed the impact angle function of Table 2, namely when the impact angle was 30°, the impact erosion of solid particles to the wall was the strongest. When the impact angle was 0°, there was no impact erosion. So the low-velocity angle strip caused by jet could protect the wall. When the jet section was not set, the solid particles mainly rebounded by impacting the lower wall of elbow to change the velocity direction. This was also the reason for the highest erosion rate of the lower wall of elbow. Due to the influence of the jet, there was a greater velocity difference between the upper wall and the lower wall of elbow, causing a large pressure difference. Under the double effects of pressure and fluid, the impact frequency of solid particles to the lower wall of elbow reduced greatly, and the erosion rate also reduced. However, the jet led to the spiral trajectory and vibration of the solid particles, resulting in more solid particles impacting the wall of outlet straight pipe, causing the increase of erosion rate in the area.
Velocity angle contour and solid particle trajectory of axial section of fluid domain of original model and erosion rate at different l of vj = 0.5 m·s−1: (a) original model; (b) l = 0.5 d; (c) l = 1.0 d; (d) l = 1.5 d ( θ = 0 when velocity angle was horizontally to the right).
Influence of different jet velocity on flow field and erosion characteristics
Analysis of erosion rate of different jet velocity
The total average erosion rate of the monitoring surfaces was the lowest when l = 0.5 d, so the study on the effect of different vj on the erosion characteristics of the elbow based on the situation of l = 0.5 d.
Figure 8 is the line chart of average erosion rate of monitoring surfaces of different vj. From Figure 8, the total average erosion rate of the monitoring surface decreased first and then increased with the increase of the jet velocity, though the amplitude of the change was small. The erosion rate reached the minimum value at vj = 0.3 v. Meanwhile, with the increase of jet velocity, the erosion rate of the lower wall of elbow decreased, and the erosion rate of the upper wall increased, while the erosion of the wall of outlet straight pipe decreased first and then increased.

Average erosion rate of monitoring surface of different vj.
Figure 9 is the contour of the erosion rate of monitoring surfaces of different vj. From Figure 9, when vj = 0.1 v, the erosion rate of the lower wall of elbow was high and the erosion area was very large, while the upper wall of elbow was almost none of erosion, which was similar to that of the original model. But there was high erosion rate in huge range of the outlet straight pipe, which was the opposite of the situation of the original model. However, when the jet velocity increased, such as vj = 0.2 v and vjet = 0.3 v, the area of almost none of erosion appeared from the bottom to top on the lower wall of the elbow, at the same time the erosion area and the erosion rate of the outlet decreased. When vj = 0.4 v, the erosion of the lower wall of elbow further weakened, but the erosion of the outlet pipe was greatly improved.

Erosion rate of monitoring surface of different vj: (a) vj = 0.1 v; (b) vj = 0.2 v; (c) vj = 0.3 v; (d) vj = 0.4 v.
In summary, the elbow erosion was no longer dominated by the erosion of the lower wall of elbow when l = 0.5 d. Different jet velocities would have different effects on the upper wall, the lower wall, and the outlet straight pipe section. It was necessary to integrate the erosion of the three parts to select the best plan. Under the conditions of this study, the best plan was vj = 0.3 v, and the total surface area ER = 2.32 × 10⁻⁷ kg·s−2·m−1. Compared with the original model, the erosion rate decreased by 79.29%.
Anti erosion mechanism of different jet velocity
In order to reveal the anti erosion mechanism of bionic earthworm dorsal pore jet of different jet velocities, the velocity, streamline, velocity angle, and particle trajectory in the flow domain were analyzed.
Figure 10 is the velocity contour and streamline of axial section of fluid domain of different vj. From Figure 10(a), when vj = 0.1 v, the jet velocity was too low, low-velocity strip only formed in the entrance area of the lower wall of elbow. At the same time, the fluid sprayed into mainstream by the jet and the mainstream converged, so the solid particles in the mainstream were concentrated in the lower wall of elbow and the wall of the outlet straight pipe. So the erosion resistance was not ideal. As jet velocity increased, as shown in Figure 10(b)–(d), the jet flow converged with main flow, which made the velocity of the fluid downstream of jet section gradually increase. However, due to the increase of jet velocity, the low-velocity area of the lower wall of elbow decreased gradually. In order to explore how the jet reduced the erosion rate of the lower wall of elbow, the flow state in the area was studied further.
Velocity contour and streamline of axial section of fluid domain of different vj: (a) vj = 0.1 v; (b) vj = 0.2 v; (c) vj = 0.3 v; (d) vj = 0.4 v.
Figure 11 is the velocity vector of the lower wall of the elbow of different vj. Compared with the situation of vj = 0.1 v in Figure 11(a), when vj = 0.2 v, 0.3 v, and 0.4 v, as shown in Figure 11(b)–(d), more vortexes formed in the downstream of the jet section, namely the lower wall of elbow. And as the velocity increasing, the scale of vortexes increased. It showed that the jet fluid contacted with the main flow, forming the vortex cushion effect. The vortex cushion effect changed the turbulent coherent structure in this area, so the near wall turbulence intensity was significantly reduced, at the same time it had a significant impact on the flow state in this region: as the Reynolds shear stress of the high velocity fluid outside the vortexes was high, the low-velocity liquid in the vortexes would not mix with the mainstream, making the internal low-velocity fluid form a closed system; so solid particles of the high velocity main flow were isolated from the wall, to reduce the erosion of the lower wall of the elbow and thus to protect the elbow. With the increase of the jet velocity, the range of the vortexes expanded and the erosion rate would be further reduced.
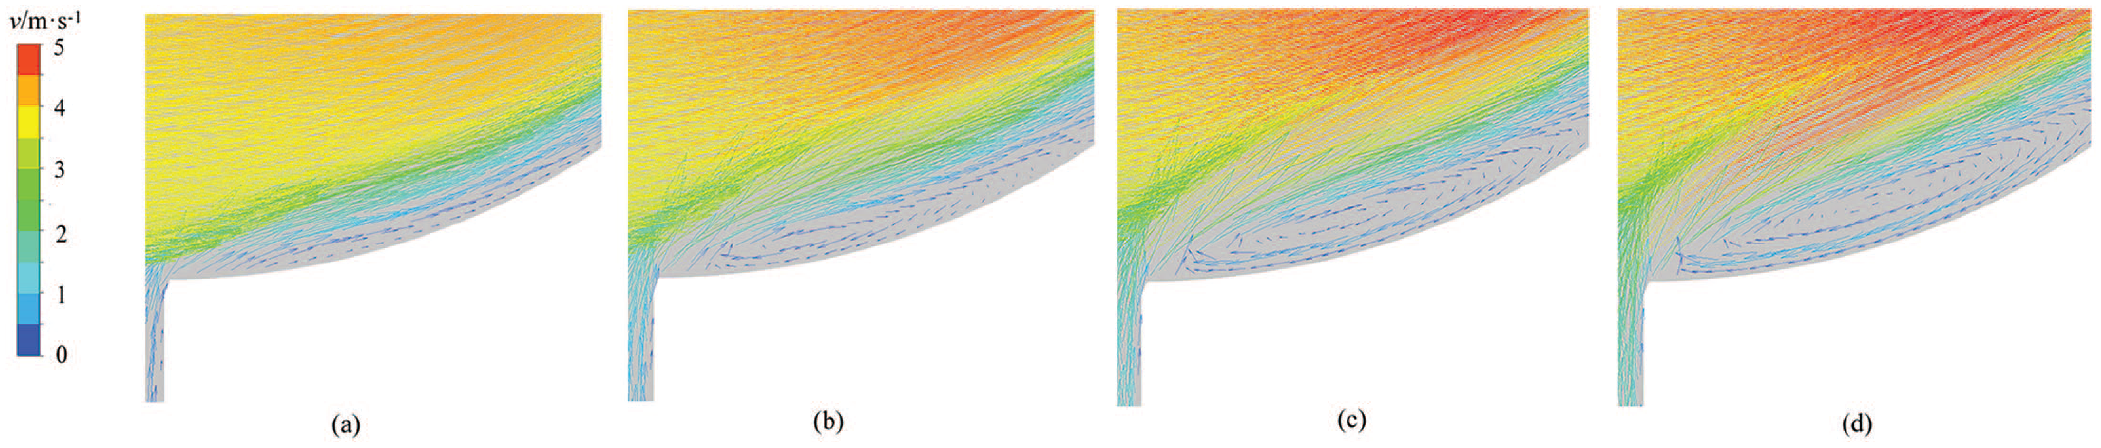
Velocity vector of the lower wall of elbow of different vj: (a) vj = 0.1 v; (b) vj = 0.2 v; (c) vj = 0.3 v (d) vj = 0.4 v.
Figure 12 is the velocity angle contour and solid particle trajectory of the axial section of fluid domain of different vj. From Figure 12, with the increase of the jet velocity, the range of the lower velocity angle strip in the lower wall of elbow was also enlarged. The change of jet velocity had little effect on the velocity angle of other regions. As shown in Figure 12(d), when vj = 0.4 v, the jet had a great influence on the trajectory of the particles in the mainstream. Under the influence of high velocity jet, the solid particles in the main flow field would impact the wall of the outlet straight pipe more frequently, which was the reason for the rapid increase of erosion rate in the outlet straight pipe section.

Velocity angle contour and solid particle trajectory of axial section of fluid domain of different vj: (a) vj = 0.1 v; (b) vj = 0.2 v; (c) vj = 0.3 v; (d) vj = 0.4 v.
Conclusion
Based on the biological characteristics of earthworm, the bionic technology of earthworm dorsal pore jet was applied to the study of the elbow erosion.
The dominated erosion area of the elbow for conveying solid–liquid two-phase flow was the lower wall of the elbow. The bionic earthworm dorsal pore jet reduced the erosion rate of the elbow greatly and improved the erosion resistance of the elbow mainly by reducing the erosion of the lower wall of elbow. The smaller the jet distance was, the better the improvement of the erosion characteristics of the elbow would be. But with the increase of the jet velocity, the total average erosion rate first decreased and then increased. When the jet distance was 0.5 d, the jet velocity was 0.3 v, the erosion rate was the lowest, and the decrease was 79.29% compared with the original model.
The mechanism of the jet to reduce the erosion rate of the elbow was as follows: (1) A very low-velocity angle strip formed in the area of the lower wall of the elbow. (2) When the jet velocity was less than 0.5 m·s−1, in the jet section downstream, namely the lower wall of the elbow, the low-velocity strip, and the low-velocity area formed, that suppressed the impact of the solid particles into the boundary layer of the wall. When the jet velocity was greater than 0.2 v, the vortex cushion effect formed at the lower wall of the elbow. The vortexes formed by the jet became the protective layer of the lower wall of the elbow, which effectively reduced the erosion rate of the lower wall.
Footnotes
Declaration of conflicting interests
The author(s) declared no potential conflicts of interest with respect to the research, authorship, and/or publication of this article.
Funding
The author(s) disclosed receipt of the following financial support for the research, authorship, and/or publication of this article: This study was supported by the National Natural Science Foundation of China (Grant NO. 51779226) and Zhejiang Provincial Natural Science Foundation of China (No. LY19E050003).