
Abstract
Introduction
The Northeast Black Soil Region, a key agricultural area in China and one of the four globally recognized black soil zones, is renowned for its high production of maize and japonica rice. This region plays a pivotal role in China's grain production and distribution. However, extensive cultivation and development in this area have led to severe soil degradation, compaction, and salinization, significantly reducing soil productivity.1 Additionally, being highly sensitive to climate changes, the region faces challenges such as rising temperatures and increased precipitation variability, which further exacerbate soil erosion. These climatic shifts are likely to affect both the intensity and dynamics of soil erosion.1–4 In the context of China's transition toward precision agriculture, an accurate assessment of soil erosion and its response to climate variability is crucial. This knowledge is essential for developing effective soil conservation strategies and ensuring sustainable grain production. This study aims to provide a comprehensive assessment of soil erosion in the Northeast Black Soil Region, focusing on the role of climate change and its implications for agriculture and environmental sustainability.
The advancement of Geographic Information Systems (GIS), spatial interpolation techniques, and the enhancement of environmental geospatial data have significantly elevated soil erosion models in regional soil assessment and decision-making support. The Global Applications of the Soil Erosion Modelling Tracker (GASEMT)5 database, which lists 435 different models and model variants, indicates a predominant use of the (R)USLE family of models. The Universal Soil Erosion Equation (USLE),6 Revised Universal Soil Loss Equation (RUSLE),7 RUSLE with Sediment Delivery Ratio (RUSLE—SDR)8; Sediment Delivery Distributed (SEDD) model,9 and the Soil and Water Assessment Tool (SWAT)10 are included among them. Among them, RUSLE is the most widely applied soil erosion estimation model globally, accounting for 17.1% of all models listed in GASEMT.
In China, a large amount of rill erosion estimation data has been obtained through the application of the RUSLE model. At the regional scale, Shanxi Province saw an estimated reduction of 287.17 tons·km−2 in annual average rill erosion from 2000 to 2015.11 The total rill erosion in the Qinling region in 2015 was 569.95 ton·km−2.12 At smaller watershed scales, the rill erosion value in the Houzhai River Basin in the southwest karst mountains decreased from 222.72 ton·km−2 in 1973 to 103.82 ton·km−2 in 2013.13 The Loess Plateau recorded an average annual rill erosion of 14.46 ton·km−2,14 with agricultural land in the Wangjiaqiao watershed of the Three Gorges Reservoir area average annual lost 0.26 ton·km−2 and sloping farmland lost 0.52 ton·km−2.15 The rill erosion amount in the Caijiamiao watershed of the Loess Plateau was 78.78 tons·km−2 in 2002.16 Rill erosion in a typical karst cultivated area in northwest Guangxi ranged from 0.001 to 0.0022 ton·km−2.17 It is important to note that RUSLE estimates serve only as an indicator of relative erosion rates, primarily used for estimating sheet erosion and rill erosion on short slope segments, rather than for precise quantitative assessment of land degradation. In scenarios where fluvial processes do not dominate soil movement, RUSLE is unable to account for large-scale gully erosion or temporary stream channel erosion, which limits its applicability in certain contexts. Nevertheless, the diverse applications and research outcomes of RUSLE in China highlight its practicality across various geographical settings. From regional assessments to slope-scale analyses, RUSLE provides valuable insights for environmental management and policy-making.
Most current studies focus on plot, slope, and gully scales,18–20 with limited research at the small watershed or larger regional scales. In particular, there is a significant gap in understanding the quantitative relationship between soil erosion and global climate change, especially in assessing the impact of extreme climatic events on soil erosion.
This study hypothesizes that extreme precipitation events have a significant impact on soil rill erosion in the Northeast Black Soil Region, and that this impact varies over time. By leveraging meteorological observations, remote sensing, and soil data, utilizes the RUSLE model is applied to simulate the rill erosion value in the typical black soil areas of northeast China from 1980 to 2020. It analyzes the spatiotemporal characteristics of rill erosion and establishes a quantitative relationship between rill erosion and extreme precipitation events. The primary goal is to enhance our understanding of climatic effects on rill erosion in the Northeast Black Soil Region. This research offers valuable insights for developing strategies to protect the black soil in the Northeast and adapt to climate change.
Materials and methods
Research area
The research area boundary was delineated based on the methods and data described by Gao, et al.,21 which defines the typical black soil region in northeast China. It is spans from 117.03°E to 135.79°E and 43.11°N to 50.72°N, covering a total area of 333,400 km2. The region includes parts of 138 counties (districts), as shown in Figure 1(a). The western part of the area is classified as the Eastern Mongolia typical black soil subregion, the central part is the Songnen typical black soil subregion, and the elongated eastern part comprises the Sanjiang typical black soil subregion. The primary soil types in the research area include pachic udic haploborolls, mollisols, inceptisols, and alfisols, among which mollisols and inceptisols each account for over 20% of the total area (Harmonized World Soil Database, HWSD, 2023). The land use classification results of 2020 reveal that 60.18% of the research area is arable land and 27.33% grassland with arable lands predominantly located in the Songnen and Sanjiang subregions, and grasslands primarily found in the Eastern Mongolian subregion (Figure 1(b)). The area experiences a temperate monsoon climate, with cold and dry winters, and hot, rainy summers. Over the last 30 years (1991–2020), the average annual temperature has ranged from −1.60°C to 7.37°C, decreasing from south to north. The annual precipitation varies from 306 to 672 mm, exhibiting a meridional distribution pattern.

Study area overview. (a) Location map, (b) land use types, (c) climate data (1991–2020). Region boundary redrawn based on Liu et al.22
Precipitation data
Precipitation data were used for estimating the rainfall erosivity factor and to assess the impact of extreme rainfall on soil erosion. These data, covering the period from 1980 to 2020, were obtained from the daily observational records available on the Meteorological Big Data Cloud Platform of the China Meteorological Administration. The data were first subjected to quality control in accordance with “Surface Meteorological Observation Data Quality Control” (QX/T 11–2010). Following the methodology of Zhai et al.,22 observational data from any year missing more than 20 days of measurements were excluded, as were records from stations that had been relocated. Ultimately, daily precipitation data from 142 meteorological stations were selected. This includes 65 observation stations within the study area and 77 observation stations in the surrounding areas (Figure 1(c)).
Soil physicochemical properties data
Soil physicochemical properties data were used to estimate the soil erodibility factor. These data were sourced from the World Soil Database, developed jointly by the Food and Agriculture Organization (FAO) of the United Nations and the International Institute for Applied Systems Analysis (IIASA) (https://www.fao.org/soils-portal/en/). For China, the data was provided by the Nanjing Soil Institute from the Second National Land Survey at a scale of 1:1,000,000. This dataset mainly follows the FAO-90 soil classification system, with soil particle size grading based on the international standard. Notably, the K-value calculation in equation (3) follows the American particle size grading standard, which necessitates converting soil particle sizes from the international system to the American system.
Digital elevation model
In this study, the FABDEM (Forest And Buildings removed Copernicus DEM) V1—2 dataset was used as the foundational data for estimating the slope length and steepness factor. This dataset was obtained from the University of Bristol (https://data.bris.ac.uk/data/). FABDEM corrects height biases caused by buildings and trees in the Copernicus GLO 30 Digital Elevation Model (DEM), providing a global (60°S to 80°N) DEM dataset with a 1-arc second grid spacing. Compared to COPDEM30 (Global and European Digital Elevation Model) and MERITDEM (Multi-Error-Removed Improved Terrain DEM), FABDEM exhibits smaller errors.23
Vegetation Index
In this study, the Normalized Difference Vegetation Index (NDVI) served as the foundational data for calculating the vegetation cover factor. The NDVI data used in this research were sourced from NOAA's National Centers for Environmental Information (http://www.ncei.noaa.gov), a global daily dataset with a spatial resolution of 0.05° × 0.05° derived from AVHRR/NOAA data. To process the NDVI time series, the Savitzky-Golay filter was applied,24 which effectively removing significant noise and aligns the data more closely with vegetation growth patterns.
We standardized raster data by resampling to a spatial resolution of 500 m. This resolution was chosen because it is well-suitable for regional-scale soil erosion assessments, particularly in large areas like northeast China's black soil region. While higher resolutions may provide more detailed local insights, they would require significantly more computational resources, which are not necessary for this study. Furthermore, the RUSLE model, which is primarily used to estimate sheet and rill erosion on slope segments, is well-suited for this resolution at the regional scale.25 Future studies could explore higher resolutions or incorporate more detailed hydrological models to improve the precision of local soil erosion estimations.
RUSLE parameter calculation
The Revised Universal Soil Loss Equation (RUSLE) is a widely used model, formally adopted by the United States Department of Agriculture (USDA) in 1997, based on the earlier Universal Soil Loss Equation (USLE). Its fundamental expression is given in equation (1).


In this study, a logarithmic linear interpolation method is used for soil particle size conversion. The specific formula is given as equation (9).


Soil rill erosion parameters in the typical black soil region of northeast China in 2012. (a) The precipitation erosivity factor, (b) the soil erodibility factor, (c) the slope length and slope factor, and (d) the vegetation coverage factor.


In the formula: S represents the slope factor, which is dimensionless and θ the slope, measured in degrees. The calculation of the slope length factor based on the DEM. The slope length factor calculation formulas proposed by Liu et al.,32 Wischmeier and Smith,33 and Suhua, et al.34 are applied. The specific calculations are presented in equation (13).

Based on the research findings of Qin et al.,35 the slope length index values are calculated using equation (14).


RClimDex software precipitation index.

Note: Partially referenced from He et al. (2019).
CDD: Maximum number of consecutive days with precipitation =1mm; CWD: Maximum number of consecutive days with precipitation >=1mm; PRCP: Annual total PRCP in wet days (RR>=1mm); RR: precipitation; WEPP: Water Erosion Prediction Project.
Extreme precipitation indices
In this study, 11 extreme precipitation indices developed jointly by the World Meteorological Organization (WMO) and the Climate Variability and Predictability Research Program were selected (Table 2). These indices are widely used in extreme precipitation research.37–39 The indices were analyzed using the Simple R package for ETCCDI/CRD climate change indices calculations (RClimDex) (https://github.com/ECCC-CDAS/RClimDex),40,41 developed based on the R editor with Excel by research institutions. The tool can calculate 27 extreme climate indices, including 16 extreme temperature indices and 11 extreme precipitation indices.
The correlation between rill erosion value and monthly extreme precipitation index in typical black soil areas.
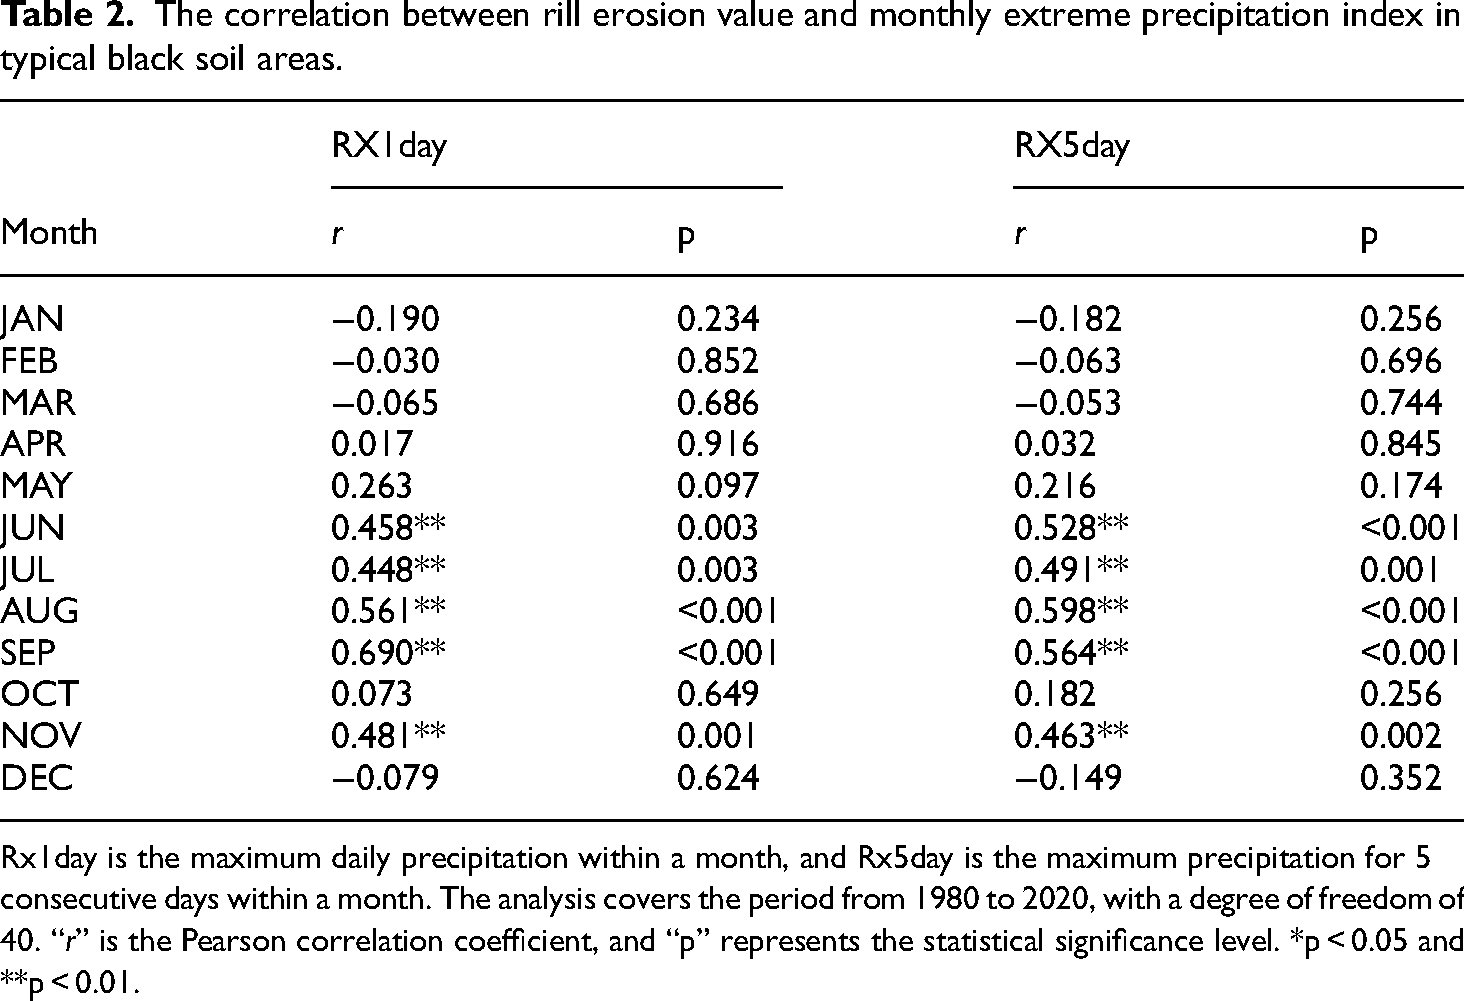
Rx1day is the maximum daily precipitation within a month, and Rx5day is the maximum precipitation for 5 consecutive days within a month. The analysis covers the period from 1980 to 2020, with a degree of freedom of 40. “r” is the Pearson correlation coefficient, and “p” represents the statistical significance level. *p < 0.05 and **p < 0.01.
Extreme precipitation indices were calculated using meteorological station data. The soil rill erosion rate corresponding to each extreme precipitation index was calculated by deriving the average value of individual pixels within the Thiessen polygons for each station from annual soil rill erosion rate raster maps.
The correlation between soil rill erosion rates and extreme precipitation indices was categorized based on the following statistical thresholds, where extremely significant positive (p < 0.01) indicates a very strong positive correlation, significant positive (p < 0.05) indicates a moderate positive correlation, no correlation (p ≥ 0.05) indicates no significant correlation, significant negative (p < 0.05) indicates a moderate negative correlation, and extremely significant negative (p < 0.01) indicates a very strong negative correlation.
Results and discussion
Soil rill erosion value estimation and evolution trend
In this study, meteorological station data were used to calculate R (Figure 2(a)). The inverse distance weighting (IDW) method was then applied to convert the point data into surface data. Analysis reveals that the R factor in the eastern region is generally higher than in the western region. As shown in Figure 2(b), the soil erodibility factor is below 0.0235 in most areas of the study region, with the southwestern part of the Songnen typical black soil subregion showing a significantly lower soil erodibility factor than the eastern region. The slope length and gradient factor in the Eastern Mongolia typical black soil subregion are higher than that in the eastern region (Figure 2(c)). The vegetation cover factor in the northern part of the Songnen typical black soil subregion and the western part of the Eastern Mongolia typical black soil subregion is higher than in other areas (Figure 2(d)).
The statistics for the rill erosion rate of typical black soil in northeast China from 1980 to 2020 showed an annual average rill erosion rate was 0.75 ± 0.20 t·ha−1·yr−1. The average was calculated as the arithmetic mean of the rill erosion rates for each year from 1980 to 2020. Two significant peaks were observed in 1983 (rill erosion rate of 1.26 t·ha−1·yr−1) and 1998 (1.28 t·ha−1·yr−1). A period of low values occurred from 1999 to 2010, ranging from 0.44 to 0.71 t·ha−1·yr−1, which was below the study period's average (Figure 3(a)).
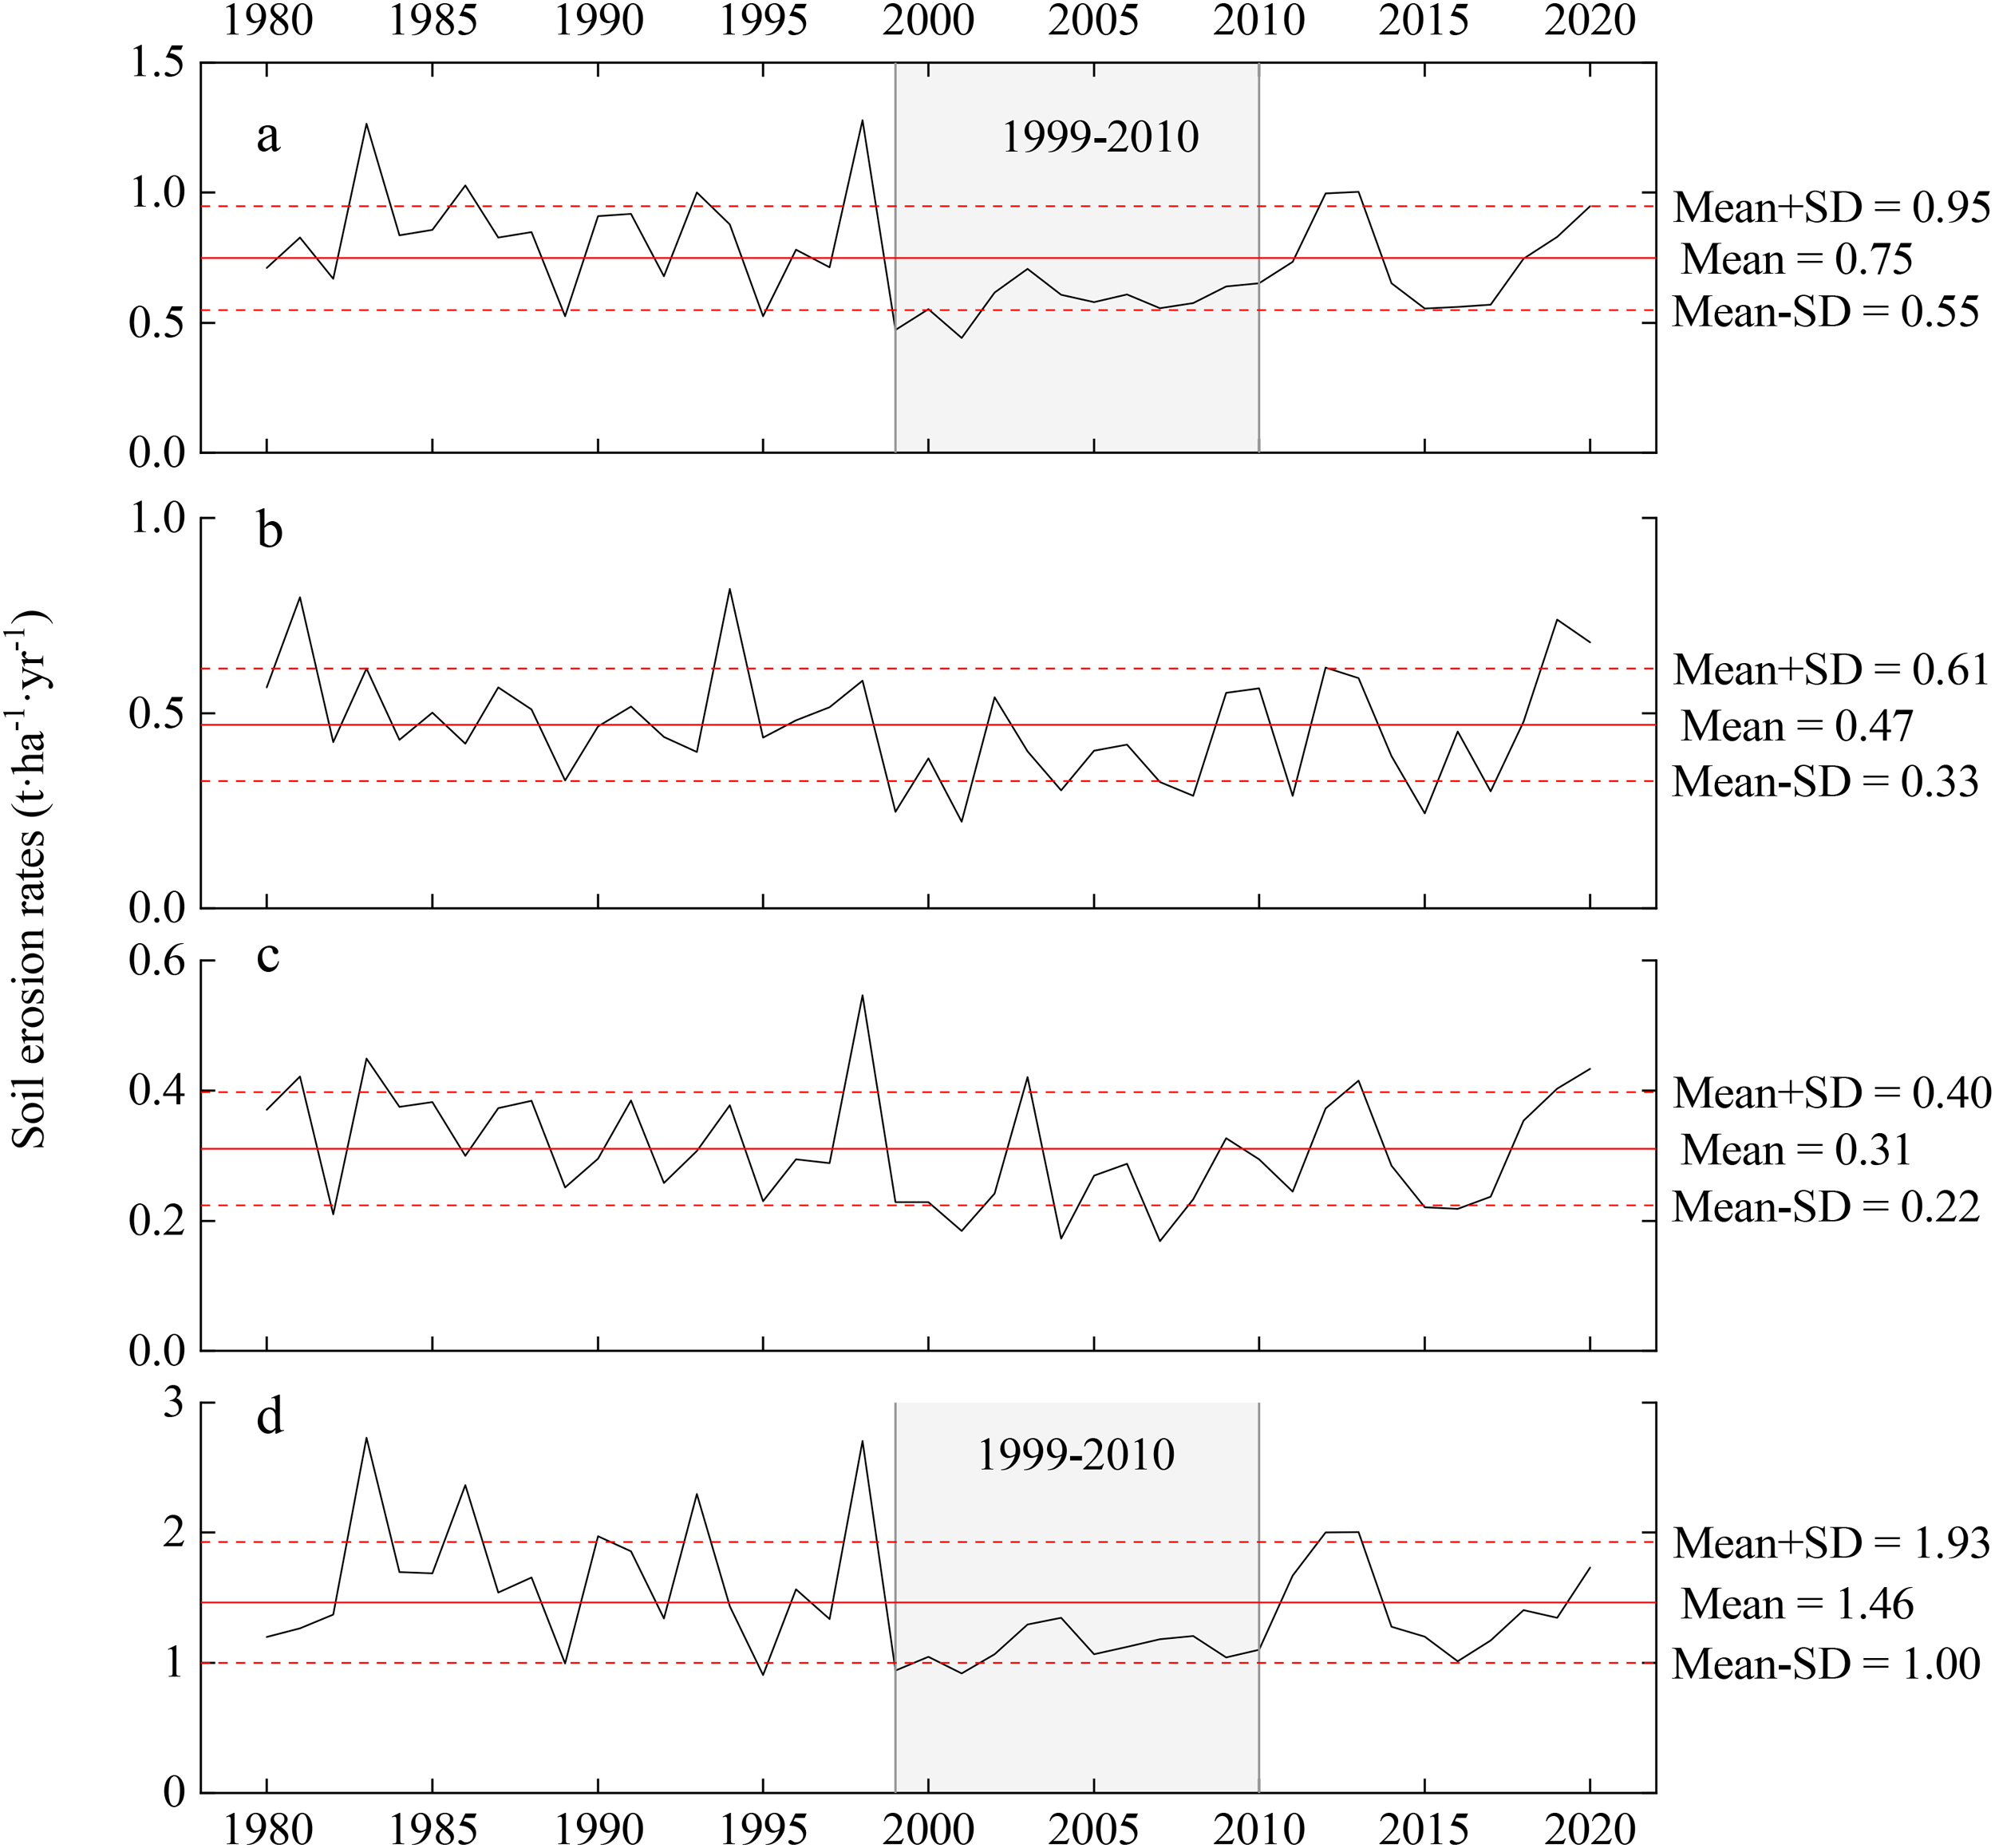
Soil rill erosion value in typical black soil areas of northeast China from 1980 to 2020. (a) Study area, (b) Sanjiang typical black soil subregion, (c) Songnen typical black soil subregion, and (d) Eastern Mongolia typical black soil subregion.
When analyzed by region, the Eastern Mongolia typical black soil subregion had the highest rill erosion rate (Figure 3(d)), with an annual average of 1.46 ± 0.47 t·ha−1·yr−1. This region also experienced two significant peaks in 1983 (2.73 t·ha−1·yr−1) and 1998 (2.70 t·ha−1·yr−1), and a period of low values between 1999 and 2010, ranging from 0.92 to 1.35 t·ha−1·yr−1, below the study period average. The Sanjiang typical black soil subregion (Figure 3(b), with an average of 0.47 ± 0.14 t·ha−1·yr−1) and the Songnen typical black soil subregion (Figure 3(c), with an average of 0.31 ± 0.09 t·ha−1·yr−1) did not show significant trends in rill erosion rate over the study period. The estimates from this study were similar to those of Wang et al.,42 in which the SNP region, roughly corresponding to the Songnen Plain typical black soil subregion in this study, had a soil erosion rate of 0.469 t·ha−1·yr−1.
Analysis of Figure 4(a) revealed that the rill erosion rate in most areas of the Eastern Mongolia typical black soil subregion exceeded 2.0 t·ha−1·yr−1, significantly higher than that in the two other typical black soil subregions, where most areas had erosion moduli between 0 and 2.0 t·ha−1·yr−1. In the Songnen typical black soil subregion, the northern area (the low mountain and hilly region transitioning from the Songnen Plain to the Lesser Khingan Mountains) exhibited higher erosion rate then the central and southern plain areas. Combining this with the analysis of Figure 4(a), regions with higher soil rill erosion moduli also showed higher standard deviations (stdev), indicating greater variability in rill erosion rate in those regions.

Spatial distribution of soil rill erosion values in typical black soil areas of northeast China from 1980 to 2020. (a) Annual average soil rill erosion rate, (b) standard deviation (stdev) of soil rill erosion rate.
Utilizing the “Soil Erosion Classification and Grading Standards” (SL 190—2007), the study area's annual average soil rill erosion intensity was categorized into two levels: slight and light.
Light soil rill erosion within this region is predominantly found in the southern section of the Eastern Mongolian typical black soil subregion (Figure 5). Analysis of regional dynamics shows that the light erosion area was initially concentrated in the southern part during the 1980s. This area expanded northward in the 1990s and contracted southward in the 2000s, significantly decreasing compared to the 1980s. By the 2010s, the erosion area had expanded once more; however, this overall expansion was less extensive than in the 1990s. These spatial and temporal changes in erosion dynamics are linked to variations in precipitation patterns and land conservation policies. The northward expansion of erosion in the 1990s aligns with increased precipitation intensity and frequency during this period. Conversely, the contraction observed in the 2000s may have been influenced by government-driven conservation initiatives, such as afforestation, reforestation, and the “Grain for Green” program. These measures likely improved vegetation cover and enhanced soil stability, especially in southern regions. The moderate expansion observed in the 2010s could be linked to the increase in extreme rainfall events during that decade, which exacerbated rill erosion, though to a lesser extent than in the 1990s.

Spatial distribution of soil rill erosion intensity across decades in the typical black soil subregions of Eastern Mongolia. The subfigures are labeled as follows: (a) the period from 1980 to 1989, (b) 1990 to 1999, (c) 2000 to 2009, and (d) 2010 to 2020.
Research on rill erosion in black soil regions has predominantly focused on the soil erosion mechanisms and estimation in sloping farmland, with relatively few studies on regional soil erosion estimation. Additionally, due to the lack of a unified definition of the Northeast Black Soil Region and the differing study areas in various studies,28,43–45 only a simple comparison of the research results can be made. Wang et al.46 estimated the spatial and temporal characteristics of soil rill and wind erosion in northeast China, offering a comparative analysis of soil erosion changes across different geographical units and ecosystem types. This research offered valuable insights into the baseline conditions of soil erosion in the region. Their conclusion that slight erosion dominated soil rill erosion from 2000 to 2020, with an increasing trend in rill erosion, aligns with the findings of this study. However, this study emphasizes the long-term trends in soil rill erosion in the black soil region from 1980 to 2020, as well as the impact of extreme climate events on rill erosion. This focus offers more targeted reference data for scientific research and policymakers concerned with the protection of black soil regions and adaptation to climate change.
Impact of extreme precipitation events on soil rill erosion
Analysis of Figure 6 revealed that, except for maximum number of consecutive days with precipitation =1mm (CDD) (Figure 6(b)), which showed no significant correlation with the rill erosion rate of typical black soil regions (hereafter referred to as A1), all other extreme precipitation indices showed a highly significant linear correlation with A1. A1 represents the annual average soil rill erosion rate for the entire black soil region. The soil rill erosion rates for all pixels in the study area were aggregated annually using regional-scale raster data. The arithmetic mean of these pixel values was calculated to represent the overall erosion rate for the entire region in a given year. A1 was primarily used to analyze temporal trends and regional correlations with extreme precipitation indices.

Relationship between the soil rill erosion rate and extreme precipitation indices in typical black soil regions. The indices are represented as follows: (a) CWD, (b) CDD, (c) R10mm, (d) R20mm, (e) R25mm, (f) RpTOT, (g) RpTOT, (h) SDII, and (i) PRCPTOT. The black dots in the figure represent the annual average values of each index. The statistical time range covers the period from 1980 to 2020, and the spatial scope encompasses the typical black soil regions in northeast China.
From the duration indices perspective, CDD showed no significant correlation with A1, suggesting that prolonged dry periods have little impact on the soil rill erosion rate in typical black soil regions. In contrast, maximum number of consecutive days with precipitation >=1mm (CWD) (Figure 6(a)) exhibited a highly significant linear correlation with A1, with each additional day with daily rainfall of ≥1 mm resulting in an increase of 0.16 t·ha−1·yr−1.
From the threshold duration indices perspective, R10mm (Figure 6(c)), R20mm (Figure 6(d)), and R25mm (Figure 6(e)) all showed highly significant linear correlations with A1, with correlation coefficients in the order of R10mm < R20mm < R25mm. This indicates that higher daily rainfall amounts have stronger correlations with A1. Furthermore, according to the regression equations, each additional day with daily rainfall ≥10 mm increased A1 by 0.05 t·ha−1·yr−1; each additional day with daily rainfall ≥20 mm increased A1 by 0.09 t·ha−1·yr−1; and each additional day with daily rainfall ≥25 mm increased A1 by 0.12. Hence, the greater the daily rainfall, the higher the A1.
From the perspective of relative threshold indices, R95pTOT (Figure 6(f)) and R99pTOT (Figure 6(g)) both exhibited highly significant correlations with A1. The correlation coefficient of R95pTOT with A1 was greater than that of R99pTOT, indicating that the annual total precipitation exceeding the 95th percentile had a stronger relationship with A1 compared to the annual total precipitation exceeding the 99th percentile. Furthermore, according to the regression equations, for every 10 mm increase in the annual total precipitation exceeding the 95th percentile, A1 increased by 0.03 t·ha−1·yr−1; for every 10 mm increase in the annual total precipitation exceeding the 99th percentile, A1 increased by 0.06 t·ha−1·yr−1, indicating that the annual total precipitation exceeding the 99th percentile is more destructive to the soil.
From the perspective of total amount indices, SDII (Figure 6(h)) and PRCPTOT (Figure 6(i)) both exhibited highly significant linear correlations with A1, indicating that both daily average rainfall intensity and annual total precipitation have a highly significant impact on A1. The correlation coefficient of PRCPTOT with A1 was greater than that of SDII, indicating that total precipitation is more strongly correlated with A1 than daily average rainfall intensity. Furthermore, according to the regression equations, for every 10 mm/d increase in daily average rainfall intensity, A1 increased by 1.63 t·ha−1·yr−1; for every 10 mm increase in annual total precipitation, A1 increased by 0.02 t·ha−1·yr−1. This shows that rainfall intensity contributes more to the increase in A1 than the total amount of rainfall.
Analysis of Table 3 revealed that the soil rill erosion rate in the study area showed significant (p < 0.05) or highly significant (p < 0.01) correlations with extreme precipitation indices (Rx1day and Rx5day) from June to September and in November. For other months, no significant correlations were observed (p > 0.05). From 1980 to 2020, the total precipitation from June to September accounted for 73.26% of the annual precipitation, with heavy rainfall occurring during this period. Consequently, correlation coefficients between the soil rill erosion rate and extreme precipitation indices (Rx1day and Rx5day) were significantly higher during these months.
The proportion of correlation area between soil rill erosion value and extreme precipitation index in typical black soil areas (unit: %).

Although precipitation decreased in October and November, the correlation coefficients in November were still significant (p < 0.01) and higher than those in October. This is likely due to the fact that in October, vegetation, including crops, starts to wither and harvest begins, maintaining ground cover and reducing the impact of precipitation on soil erosion. However, mechanical harvesting practices in the study area result in the farmland surface is left without crop residue after harvest, leading to reduced ground cover. In November, as vegetation fully withers and farmland becomes bare, even small amounts of precipitation can have a notable scouring effect on the soil, increasing the correlation between extreme precipitation and rill erosion.
From January to April and in December, the ground surface in the study area is frozen, which reduces the direct impact of precipitation on soil erosion. In May, when the ground surface begins to thaw, the correlation is relatively weak and not statistically significant. These findings indicate soil erosion processes in these months may be influenced by other factors, such as previous precipitation or snowmelt, which should be addressed in future studies.
Analysis of Figure 7 and Table 3 revealed that the soil rill erosion rate (referred to as A2 in this section) in typical black soil regions generally exhibited strong spatial correlations with extreme precipitation events, excluding CDD. A2 refers to the spatially distributed soil rill erosion rate, focusing on the spatial correlation between soil erosion and extreme precipitation indices. Meteorological data (e.g. precipitation indices) were interpolated using the Inverse Distance Weighting (IDW) method to create continuous spatial surfaces. The interpolated meteorological data were then matched with soil erosion raster data on a pixel-by-pixel basis. This method ensures that spatial correlations between soil erosion and extreme precipitation indices are calculated at the same resolution, allowing for detailed analysis of localized patterns

Spatial distribution diagram of the correlation between soil rill erosion value and extreme precipitation index in typical black soil areas. The statistical period is from 1980 to 2020, with a degree of freedom of 40. According to the significance test table of the correlation coefficient,
Analysis of the duration indices revealed that 98.54% of the regions showed no significant correlation between A2 and CDD. This is because precipitation in the study area was concentrated mainly from June to September, and soil rill erosion also predominantly occurred during this period. CDD, which measures the longest consecutive days with daily precipitation less than 1 mm over the entire year, typically has higher values in the drier seasons. Therefore, the correlation between CDD and the soil rill erosion rate is likely not practically significant.
In contrast, the correlation between A2 and CWD was significantly higher than that between A2 and CDD. This is because the maximum consecutive precipitation days mostly occurred during the concentrated rainfall period from June to September. However, significant correlations were found only in the Sanjiang typical black soil subregion, the western part of the Songnen typical black soil subregion, and the central part of the Eastern Inner Mongolia typical black soil subregion. Further analysis revealed that only these regions had significant correlations between CWD and other precipitation indices. This suggests that the maximum consecutive precipitation days did not necessarily correspond to higher precipitation amounts or intensities, and therefore have a limited impact on soil rill erosion. Thus, analyzing CWD in isolation may provide limited insights into soil rill erosion.
The abovethreshold duration indices all showed highly significant correlations with A2, with stronger correlations in the western regions compared to the eastern regions. This suggests that daily precipitation significant impact on the soil rill erosion rate.
Analysis of the relative threshold indices and their correlation with A2 indicated that a stronger correlation in the western regions than in the eastern regions. The area with a highly significant correlation between A2 and R95pTOT was larger than that with A2 and R99pTOT, suggesting that the total amount of heavy (or extreme) precipitation significantly impacts the soil rill erosion rate, with the effect of heavy precipitation being more pronounced.
The correlation analysis of the total amount indices with A2 showed a stronger correlation in the western regions than in the eastern regions, indicating that both the annual total precipitation and rainfall intensity significant impacts on the soil erosion rate in typical black soil regions.
The soil texture beneath the black soil layer in northeast China is characterized by a high clay. The plough pan produced by long-term cultivation facilitates interflow, which accelerates the breakdown of cohesive forces between soil particles and further increasing the risk of soil water erosion.47–50 The above analysis showed that there were significant (or extremely significant) correlations between the soil water erosion rate and the number of continuous precipitation days, the number of days with daily precipitation ≥ 25 mm, the total annual precipitation exceeding 95% quantile, and the total annual precipitation in most of the study areas. Some studies have confirmed the role of extreme precipitation in promoting soil erosion. The study by Dai et al.51 found that a single extreme rainfall event could cause up to 35.0% of the annual soil loss, and grazing could further exacerbate this loss. Zhu et al.52 found significant correlations between extreme precipitation indices, such as Rx1day, Rx5day, R20mm, R95pTOT, and R99pTOT, and soil erosion when studying hillside erosion in alpine areas of Australia, which aligns with the results of this study. However, Zhu et al.53 considered that Rx5day had the greatest impact on soil erosion, while this study found that R25 mm had the highest correlation with soil erosion. This difference may be due to variations in soil properties across the study areas, or because Zhu et al.'s53 study did not include R25mm as an extreme precipitation index
Summary and conclusions
This study used the RUSLE model to estimate soil rill erosion in the Northeast Black Soil Region and established a quantitative link between rill erosion values and extreme precipitation events. The results show that the average annual hydrological erosion modulus in the typical black soil region of northeast China is 7.58 ± 3.07 t·ha−¹·yr−¹, with no significant trend from 1980 to 2020, but a notable dip from 1999 to 2010. The hydrological erosion modulus is higher in the Eastern Mongolia subregion and lower in the Songnen and Sanjiang Plains subregions. Over 99% of the study area experiences slight erosion. The hydrological erosion modulus in most regions is significantly (or highly significantly) correlated with consecutive rainy days, total rainfall, annual extreme precipitation, total annual precipitation, and rainfall intensity, underscoring the critical role of extreme precipitation in soil erosion.
Precipitation is recognized as the primary driver of soil rill erosion. The erosive potential of raindrops, which is closely linked to their size and intensity, is crucial in causing splash erosion.53 When compared to free infiltration, the impact of raindrops can increase soil erosion in black soil regions by 70% to 90%.54,55 Moreover, the dense, clay-rich composition of the soil beneath the black soil layer in northeast China, combined with a plow pan layer formed from prolonged cultivation, creates interflow conditions. This interflow accelerates the breakdown of soil particle bonds, heightening the risk of soil water erosion.51,56–58 The study's findings show that in most of the typical black soil region in northeast China, the soil rill erosion value is significantly (or highly significantly) correlated with several factors: the number of consecutive rainy days, the frequency of days with daily precipitation ≥25 mm, the total annual precipitation surpassing the 95th percentile, and the overall annual precipitation. These findings underscore the importance of key precipitation-related factors, which provide essential quantitative parameters for improving the predictive accuracy and reliability of regional-scale soil rill erosion models.
Existing studies have shown that extreme precipitation events significantly affect soil erosion, particularly in areas with loose soil structure.53,59 However, these studies mainly focus on small-scale regions and lack systematic analysis of long-term time series across large areas. In contrast to the existing literature, this study not only examines the multidimensional impacts of extreme precipitation but also quantitatively analyzes the long-term effects of precipitation intensity, consecutive rainfall days, and extreme precipitation values on soil erosion using the RUSLE model. It highlights the unique role of extreme precipitation events in soil erosion in the Northeast Black Soil Region.
The RUSLE model has been widely applied in regional-scale soil erosion assessments, and field validation being crucial to enhancing its reliability. Due to resource and logistical constraints, this study lacks direct field validation; however, the alignment of the estimated rill erosion rates with prior research findings supports the model's reliability. For example, the annual average rill erosion rate in this study (0.75 t·ha−¹·yr−¹) closely matches the 0.469 t·ha−¹·yr−¹ estimated for the Songnen Plain region by Jia et al.,60 a region with similar climatic and soil characteristics. Moreover, Wang et al.28 validated RUSLE against field observations in Niger, and Sidi Almouctar et al.26 conducted similar comparisons in Finland, both confirming the model's ability to reliably estimate rill erosion when properly calibrated.
Despite the valuable data provided in this study, some limitations remain that need further exploration. Firstly, the RUSLE model was used to estimate soil rill erosion. While RUSLE is an empirical model widely applied in soil erosion estimation, it cannot simulate key hydrological processes such as soil surface sealing, infiltration dynamics, and runoff, which are critical mechanisms influencing rill erosion during extreme precipitation events.53,61 Therefore, although this study highlights the impact of precipitation intensity and extreme precipitation values on soil erosion, the limitations of the model may introduce bias into regional soil erosion estimates. Future research could combine additional hydrological models or integrate RUSLE with mechanistic models (such as water erosion prediction project (WEPP) or SWAT) to improve estimation accuracy.
Secondly, although this study used extensive meteorological and remote sensing data, field validation was not included due to resource and time constraints. As a result, the lack of field data may impact the accuracy of the model's results. Previous studies have shown that the applicability of the RUSLE model can vary across different regions when compared to field observation data.60 To further validate the results, future work should incorporate more field monitoring data to enhance the model's reliability.
Additionally, this study relied on remote sensing and meteorological station data for soil erosion estimation. While these data cover broad areas, they may not accurately reflect the soil heterogeneity in local regions. Soil properties, topographic features, and land use changes in the black soil region can vary significantly across different areas, and these factors play a crucial role in soil erosion. With advancements in remote sensing and GIS technologies, future research could incorporate higher-resolution remote sensing data to further enhance the model's precision in local regions.
Despite these limitations, this study provides a systematic spatiotemporal analysis, revealing the impact of extreme precipitation on soil rill erosion and offering new insights for improving regional-scale soil erosion models. The findings suggest that extreme precipitation events not only significantly affect soil erosion intensity but also exacerbate the differences in soil erosion across different regions. These findings provide important data support for the development of soil conservation and climate adaptation strategies in similar regions in the future.
Footnotes
Acknowledgements
The authors would like to acknowledge the support from the Innovation and Development Project of China Meteorological Administration and the Joint Opening Fund of Key Laboratory of Agro-Meteorological Disasters of Liaoning Province.
Authors contributions
DL and CY were involved in conceptualization and writing—original draft preparation; LG, RF, and SY in data curation; DL, CY, RF, SY, and YP in formal analysis; DL and LG in funding acquisition; RF, LG, and SY in investigation; DL, CY, and LG in methodology; DL in project administration; and DL, YP, and CY in writing—review & editing.
Data availability statement
The datasets generated and/or analyzed during the current study are available from the corresponding author upon reasonable request. The meteorological data were obtained from the China Meteorological Administration's Meteorological Big Data Cloud Platform (https://data.cma.cn/). The soil data were sourced from the World Soil Database developed by the Food and Agriculture Organization (FAO) and the International Institute for Applied Systems Analysis (IIASA) (![]() ).
).
Declaration of conflicting interests
The authors declared no potential conflicts of interest with respect to the research, authorship, and/or publication of this article.
Funding
The authors disclosed receipt of the following financial support for the research, authorship, and/or publication of this article: This work was supported by the Innovation and Development Project of China Meteorological Administration, the Natural Science Foundation of Heilongjiang Province, and the Key Laboratory of Agrometeorological Disasters Joint Open Fund of Liaoning Province (CXFZ2023J059, LH2022D023, 2023SYIAEKFMS27, 2023SYIAEKFZD06).