
Abstract
Objectives:
Decreases in routine vaccination have been reported since the COVID-19 pandemic. To identify age groups and vaccine types potentially affected by pandemic disruptions and vaccine hesitancy, we assessed routine vaccination delays among children in Chicago before and after the onset of the COVID-19 pandemic.
Methods:
We used the Illinois Comprehensive Automated Immunization Registry Exchange to estimate the median time to vaccination after eligibility, vaccination incidence rates, and hazard ratios for vaccination of children and adolescents aged ≤18 years vaccinated in 2018-2019 (pre–COVID-19) and 2021-2022 (post–COVID-19 onset). We established 3 age categories: early childhood (0-3 y), childhood (4-6 y), and adolescence (11-18 y).
Results:
The post–COVID-19 onset cohort had a greater number of median (IQR) days to vaccination than the pre–COVID-19 cohort for adolescent vaccines (249 [86-624] vs 219 [69-614] d). The post–COVID-19 onset cohort had greater median days of delays by dose than the pre–COVID-19 cohort did, specifically for human papillomavirus (HPV) dose 2 (difference of 91 d); HPV dose 3 (52 d); inactivated poliovirus dose 4 (51 d); and diphtheria, tetanus, and acellular pertussis dose 5 and tetanus, diphtheria, and acellular pertussis dose 1 (43 d). In adjusted models, hazards (instantaneous rate of vaccination) were lower for the post–COVID-19 onset cohort than for the pre–COVID-19 cohort, particularly for vaccinations recommended for children aged 4 to 6 years and adolescents, indicating greater postpandemic onset delays for these groups.
Conclusions:
Vaccination delays after the COVID-19 pandemic were greatest among children aged 4 to 6 years and adolescents. Clinicians should verify the vaccination status of these groups to prioritize catch-up vaccinations, especially vaccines not required for school or childcare.
Routine childhood vaccination is a cornerstone of modern public health and a vital component of disease prevention and control. Childhood vaccination provides long-term immunity for many infectious diseases and has been shown to reduce community transmission of disease through herd immunity, among numerous other individual and social benefits. 1 The US Advisory Committee on Immunization Practices (ACIP) developed the routine childhood immunization schedule to protect children from communicable diseases by providing vaccination timing and administration recommendations. Adherence to the timing outlined in the schedule is essential, because the time at which a child is vaccinated must be carefully considered to balance likely exposure to disease and when the vaccine will be at peak efficacy. 2 When vaccination is required for entry into schools and daycare facilities, vaccinations are typically more likely to occur at the recommended time. 3 Therefore, vaccination rates before the COVID-19 pandemic were generally high and exemptions fairly low, albeit with degrees of differences among states. 4
The COVID-19 pandemic broadly disrupted health care delivery throughout the United States, forcing facilities to take numerous adaptive measures to continue treating patients. 5 The continued use of telemedicine and the overall deferment of care up to 2022 limited the ability to provide vaccinations on the usual schedule. 6 Certain analyses indicated that older children were more likely than younger children to have missed or delayed preventive care, including well-child visits, during the pandemic.7,8
Although multiple analyses confirmed that delays in routine vaccination and decreases in vaccination coverage have occurred since the COVID-19 pandemic began,9-11 less work has been done to identify age groups and vaccine types that have been most affected. This information can help guide recommendations for catch-up vaccinations. Our objective was to use time-to-event analyses to estimate the timing of vaccination by vaccine type and year of vaccination (2018-2019 vs 2021-2022) among all children and adolescents residing in Chicago and vaccinated in Illinois. We hypothesized that delays would be longer among those vaccinated during 2021-2022 than among those vaccinated during 2018-2019 and that vaccines recommended for adolescents would have greater delays than vaccines recommended for younger age groups.
Methods
We conducted a retrospective cohort study to assess delays in the administration of routine childhood vaccinations before and after onset of the COVID-19 pandemic among children and adolescents in Chicago. We used vaccination data recorded in the Illinois Comprehensive Automated Immunization Registry Exchange (I-CARE) 12 for Chicago residents to create 2 cohorts based on the year of vaccination and age. We defined people aged ≤18 years vaccinated during January 1, 2018, through December 31, 2019, as the pre–COVID-19 cohort and people aged ≤18 years vaccinated during January 1, 2021, through December 31, 2022, as the post–COVID-19 onset cohort. We excluded records administered in 2020 due to interruptions in primary care at the onset of the pandemic; we sought to describe the subsequent effect of the COVID-19 pandemic on routine vaccination, not intentional interruptions to control the pandemic (such as required delays in primary care delivery at the pandemic onset). We further classified cohorts into age groups based on when children become eligible for vaccine doses: early childhood (0-3 y), childhood (4-6 y), and adolescence (11-18 y). We removed duplicate vaccination records. Given available data, this analysis focused on the timing of vaccines actually received, rather than doses missed in a series.
Data Management and Analysis
We used SAS version 9.4 (SAS Institute, Inc) to conduct the statistical analysis and RStudio (Posit Software, PBC) to create data plots. We used the Centers for Disease Control and Prevention’s (CDC’s) 2023 Child and Adolescent Immunization Schedule by Age 13 to determine a child’s vaccine eligibility date (eTable 1 in the Supplement). We considered a child to be eligible for a vaccine on the date their age first matched the earliest recommended age for routine vaccination as outlined in the immunization schedule (eTable 2 in the Supplement). If a child fell behind schedule for a multidose series, then we calculated the date of eligibility for the subsequent dose based on the minimum time interval required between doses as outlined in the immunization schedule (eTable 2 in the Supplement).
We calculated the number of days to vaccination by subtracting the date of vaccine eligibility from the date of vaccine administration; in our models, we counted per-person time at risk until the last vaccine was received for each vaccine series. If a child received a vaccine earlier than the recommended age for routine vaccination, we assessed whether the child was vaccinated at or after the minimum age for the vaccine. We considered children vaccinated 1 to 4 days before the date they became eligible for a vaccine to be vaccinated appropriately, and we determined the number of days to vaccination to be 0. If the child was vaccinated >4 days before the minimum age, then we considered the dose to be invalid, and we excluded it from analysis (eTable 1 in the Supplement). If the child was vaccinated at or after the minimum age, but before the recommended age, then we determined the number of days to vaccination to be 0. We created a variable to flag doses administered in excess of routine vaccination recommendations and special situation vaccination recommendations, such as considerations for travel or immunocompromised patients. We excluded extra doses from analysis. We reviewed all changes in CDC, ACIP, and Illinois Department of Health recommendations (eTable 2 in the Supplement) that occurred during the study period that could have affected the timeliness of routine vaccination; we found no guidance that would have had such an effect.
After we calculated the time to vaccination for each vaccine dose, we calculated the median (IQR) time to vaccination for each vaccine dose and the difference in median time to vaccination between cohorts. We estimated the dose-specific hazard ratio (HR) of vaccination (ie, instantaneous rate of vaccination) for each cohort by using Cox proportional hazard models, adjusting for potential patient-level and vaccine-level confounders identified in a literature review. At the patient level, we included age, sex, race and ethnicity, and the CDC/Agency for Toxic Substances and Disease Registry’s Social Vulnerability Index based on zip code of patient residence. 14 At the vaccine level, we included vaccine funding source and vaccine provider administration site. We examined the proportional hazards assumption for each model by visual inspection of survival curves on the log negative log scale. Where proportional hazards were violated, we estimated time-dependent hazards and used cut points where curves crossed or coincided. We used t tests and Pearson χ2 tests to determine significant differences; P < .05 was considered significant.
CDC deemed this analysis to be a nonresearch public health surveillance activity (45 CFR 46.102[l][2]). It was conducted consistent with applicable federal law and CDC policy: 45 CFR part 46.102(l)(2), 21 CFR part 56; 42 USC §241(d); 5 USC §552a; 44 USC §3501 et seq.
Results
The pre–COVID-19 cohort comprised 451 668 children and adolescents born during January 1, 2000–December 31, 2019, who received any vaccine doses during 2018-2019. Separately, 519 989 children and adolescents born during January 1, 2003–December 31, 2022, who received any vaccine doses during 2021-2022 made up the post–COVID-19 onset cohort (Figure 1). Some children and adolescents are represented in both cohorts.
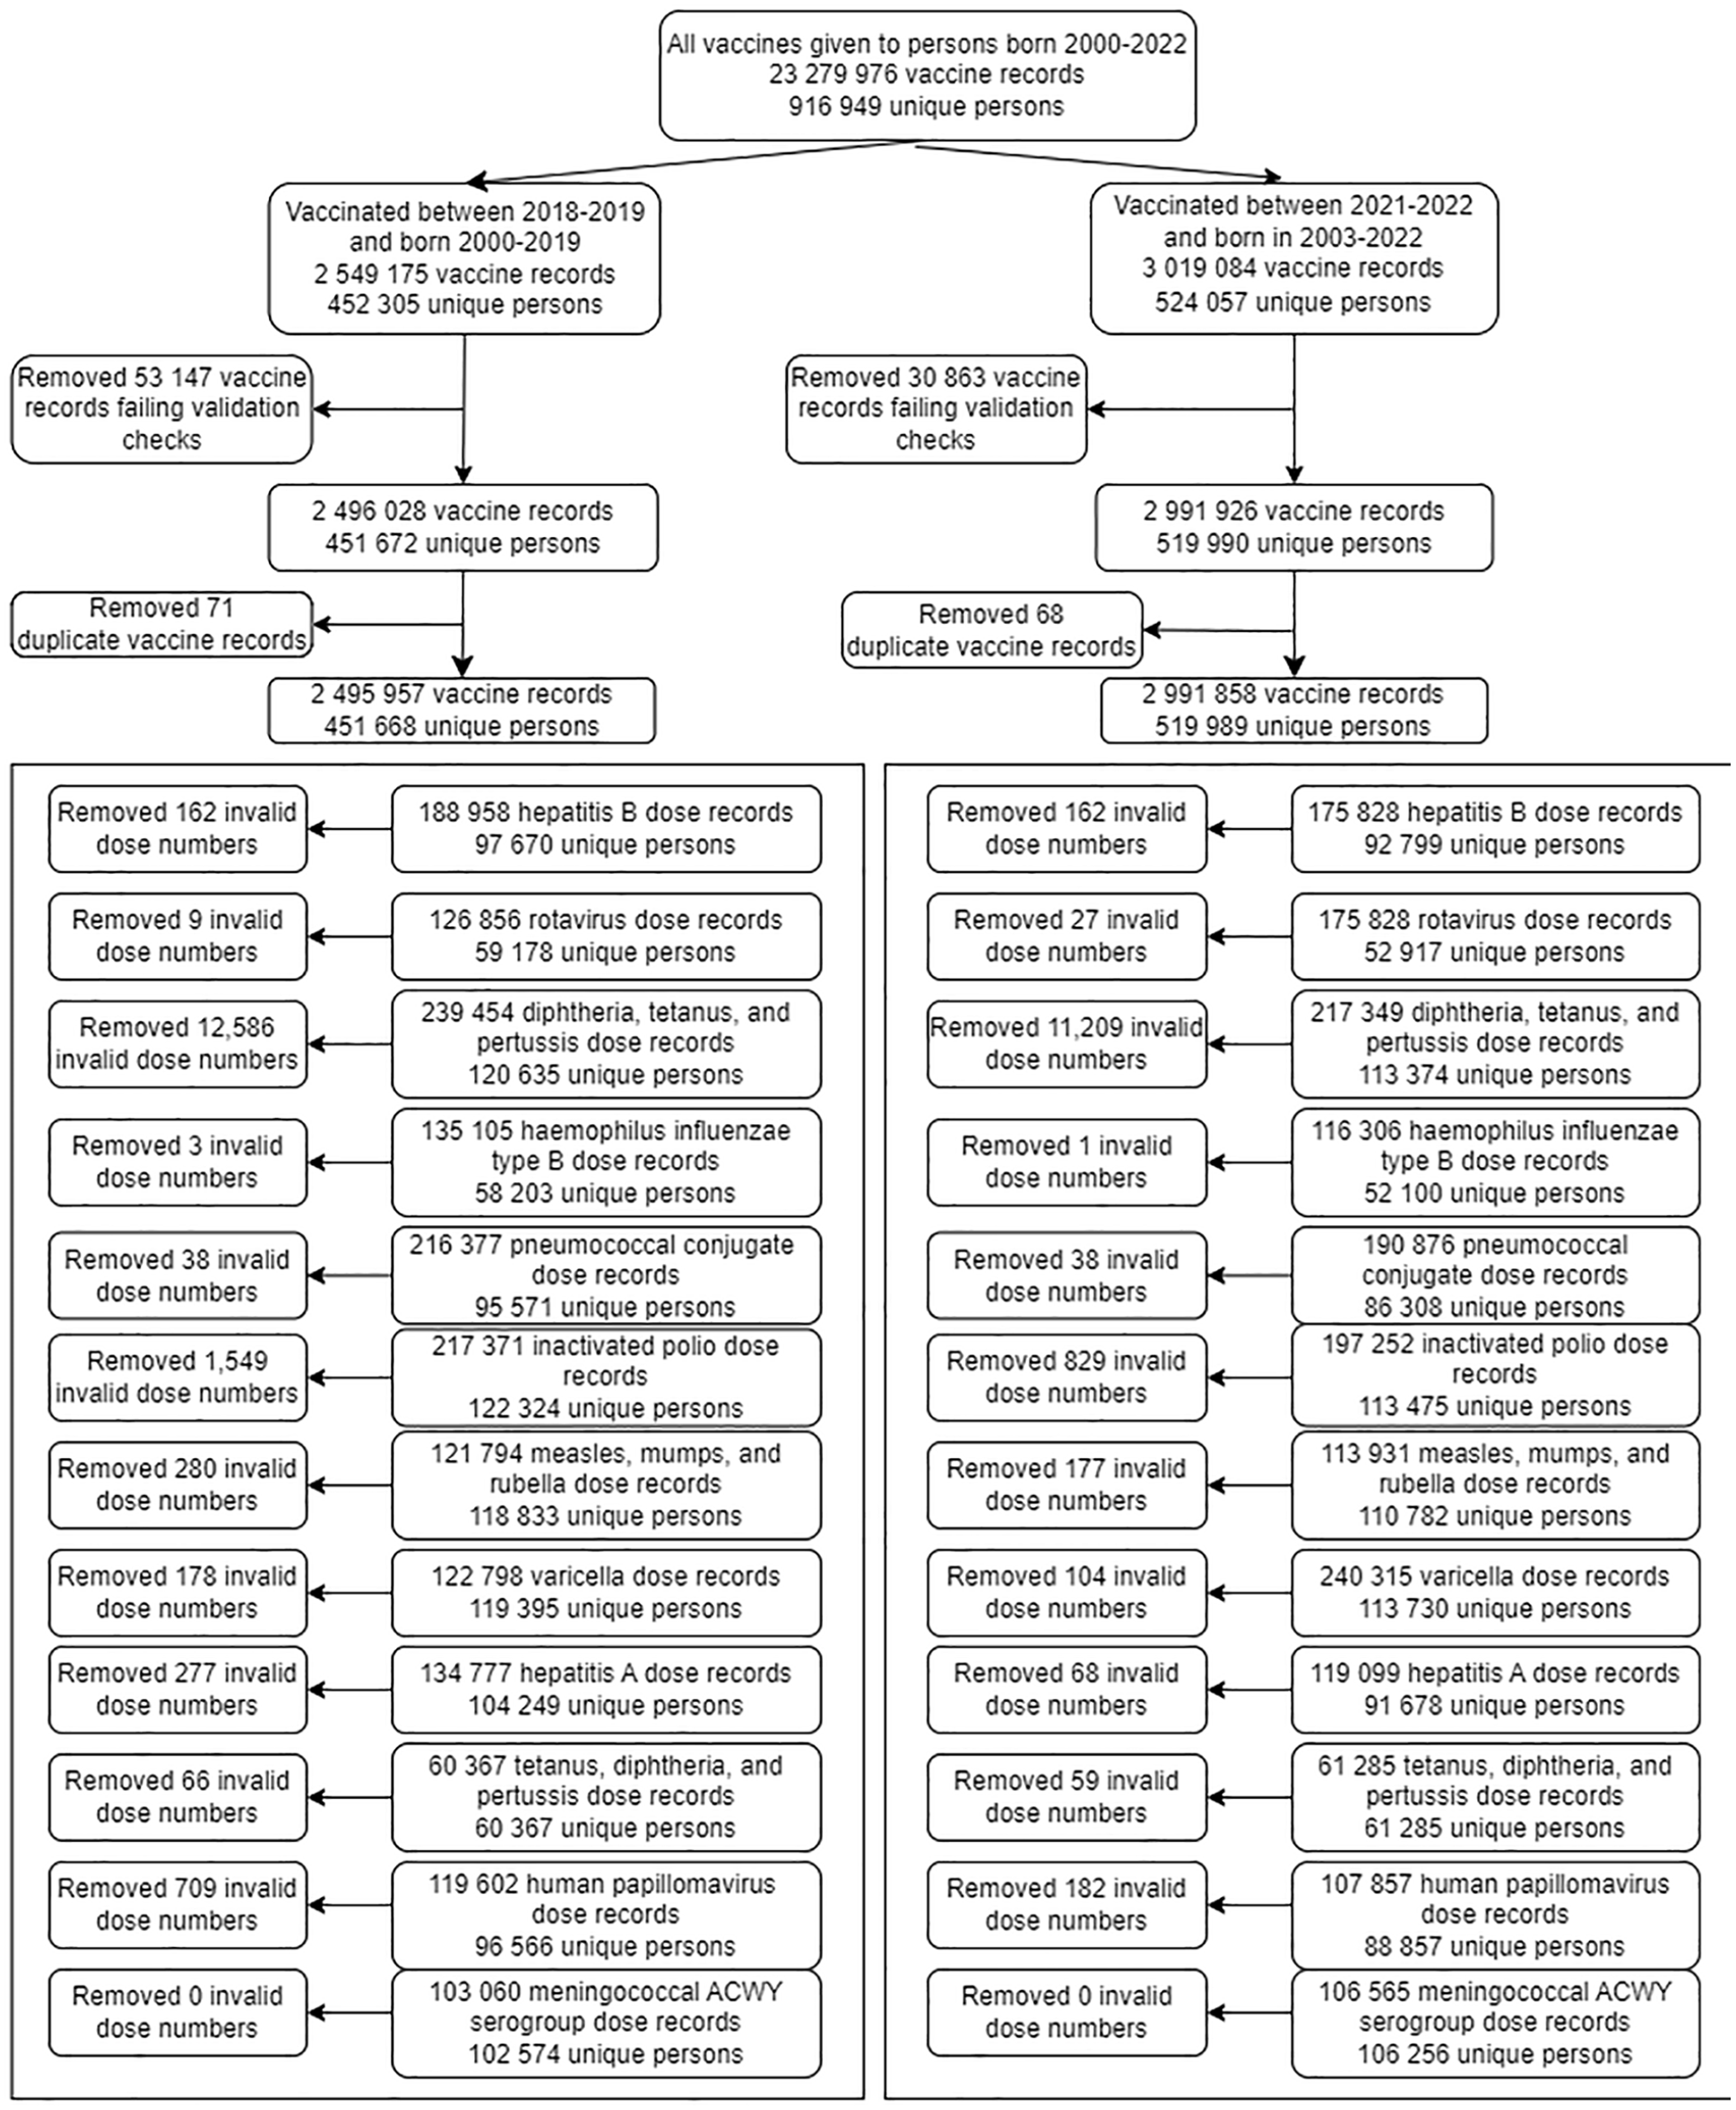
Study flowchart for eligibility and exclusion for pediatric patients who received routine vaccinations in Chicago in the pre–COVID-19 (2018-2019) and post–COVID-19 onset (2021-2022) cohorts. Invalid dose numbers for vaccines include those in excess of what would be recommended by vaccine type as follows. Early childhood vaccines: hepatitis B (>6); rotavirus (>3); diphtheria, tetanus, and acellular pertussis (>6); Haemophilus influenza type B (>7); pneumococcal conjugate (>6); inactivated poliovirus (>5); measles, mumps, and rubella (>3); varicella (>3); hepatitis A (>3). Childhood vaccines: diphtheria, tetanus, and acellular pertussis (>7); inactivated poliovirus (>5); measles, mumps, and rubella (>3); varicella (>3). Adolescent vaccines: human papillomavirus (>3); tetanus, diphtheria, and acellular pertussis (>3); meningococcal serogroup ACWY (>7). Abbreviation: Men ACWY, meningococcal serogroup A,C,W,Y. Data source: Illinois Comprehensive Automated Immunization Registry Exchange (I-CARE). 12
Demographic characteristics of the 2018-2019 cohort and the 2021-2022 cohort were overall balanced between groups (Table). However, the median (IQR) age at the end of the vaccination window (December 31, 2019, and December 31, 2022, respectively) was slightly higher among children and adolescents in the post–COVID-19 onset cohort (10.6 [4.8-15.4] y) than among those in the pre–COVID-19 cohort (8.9 [3.7-14.3] y; t test; P < .001). The proportion of children and adolescents who were of Hispanic or Latino ethnicity was higher in the post–COVID-19 onset cohort than in the pre–COVID-19 cohort (36.6% vs 32.2%; χ2; P < .001). Non-Hispanic White children and adolescents made up a slightly greater share of the pre–COVID-19 cohort than the post–COVID-19 onset cohort (21.7% vs 19.7%; χ2; P < .001).
Demographic characteristics of pediatric patients who received routine vaccinations in Chicago in the pre–COVID-19 (2018-2019) and post–COVID-19 onset (2021-2022) cohorts, United States a
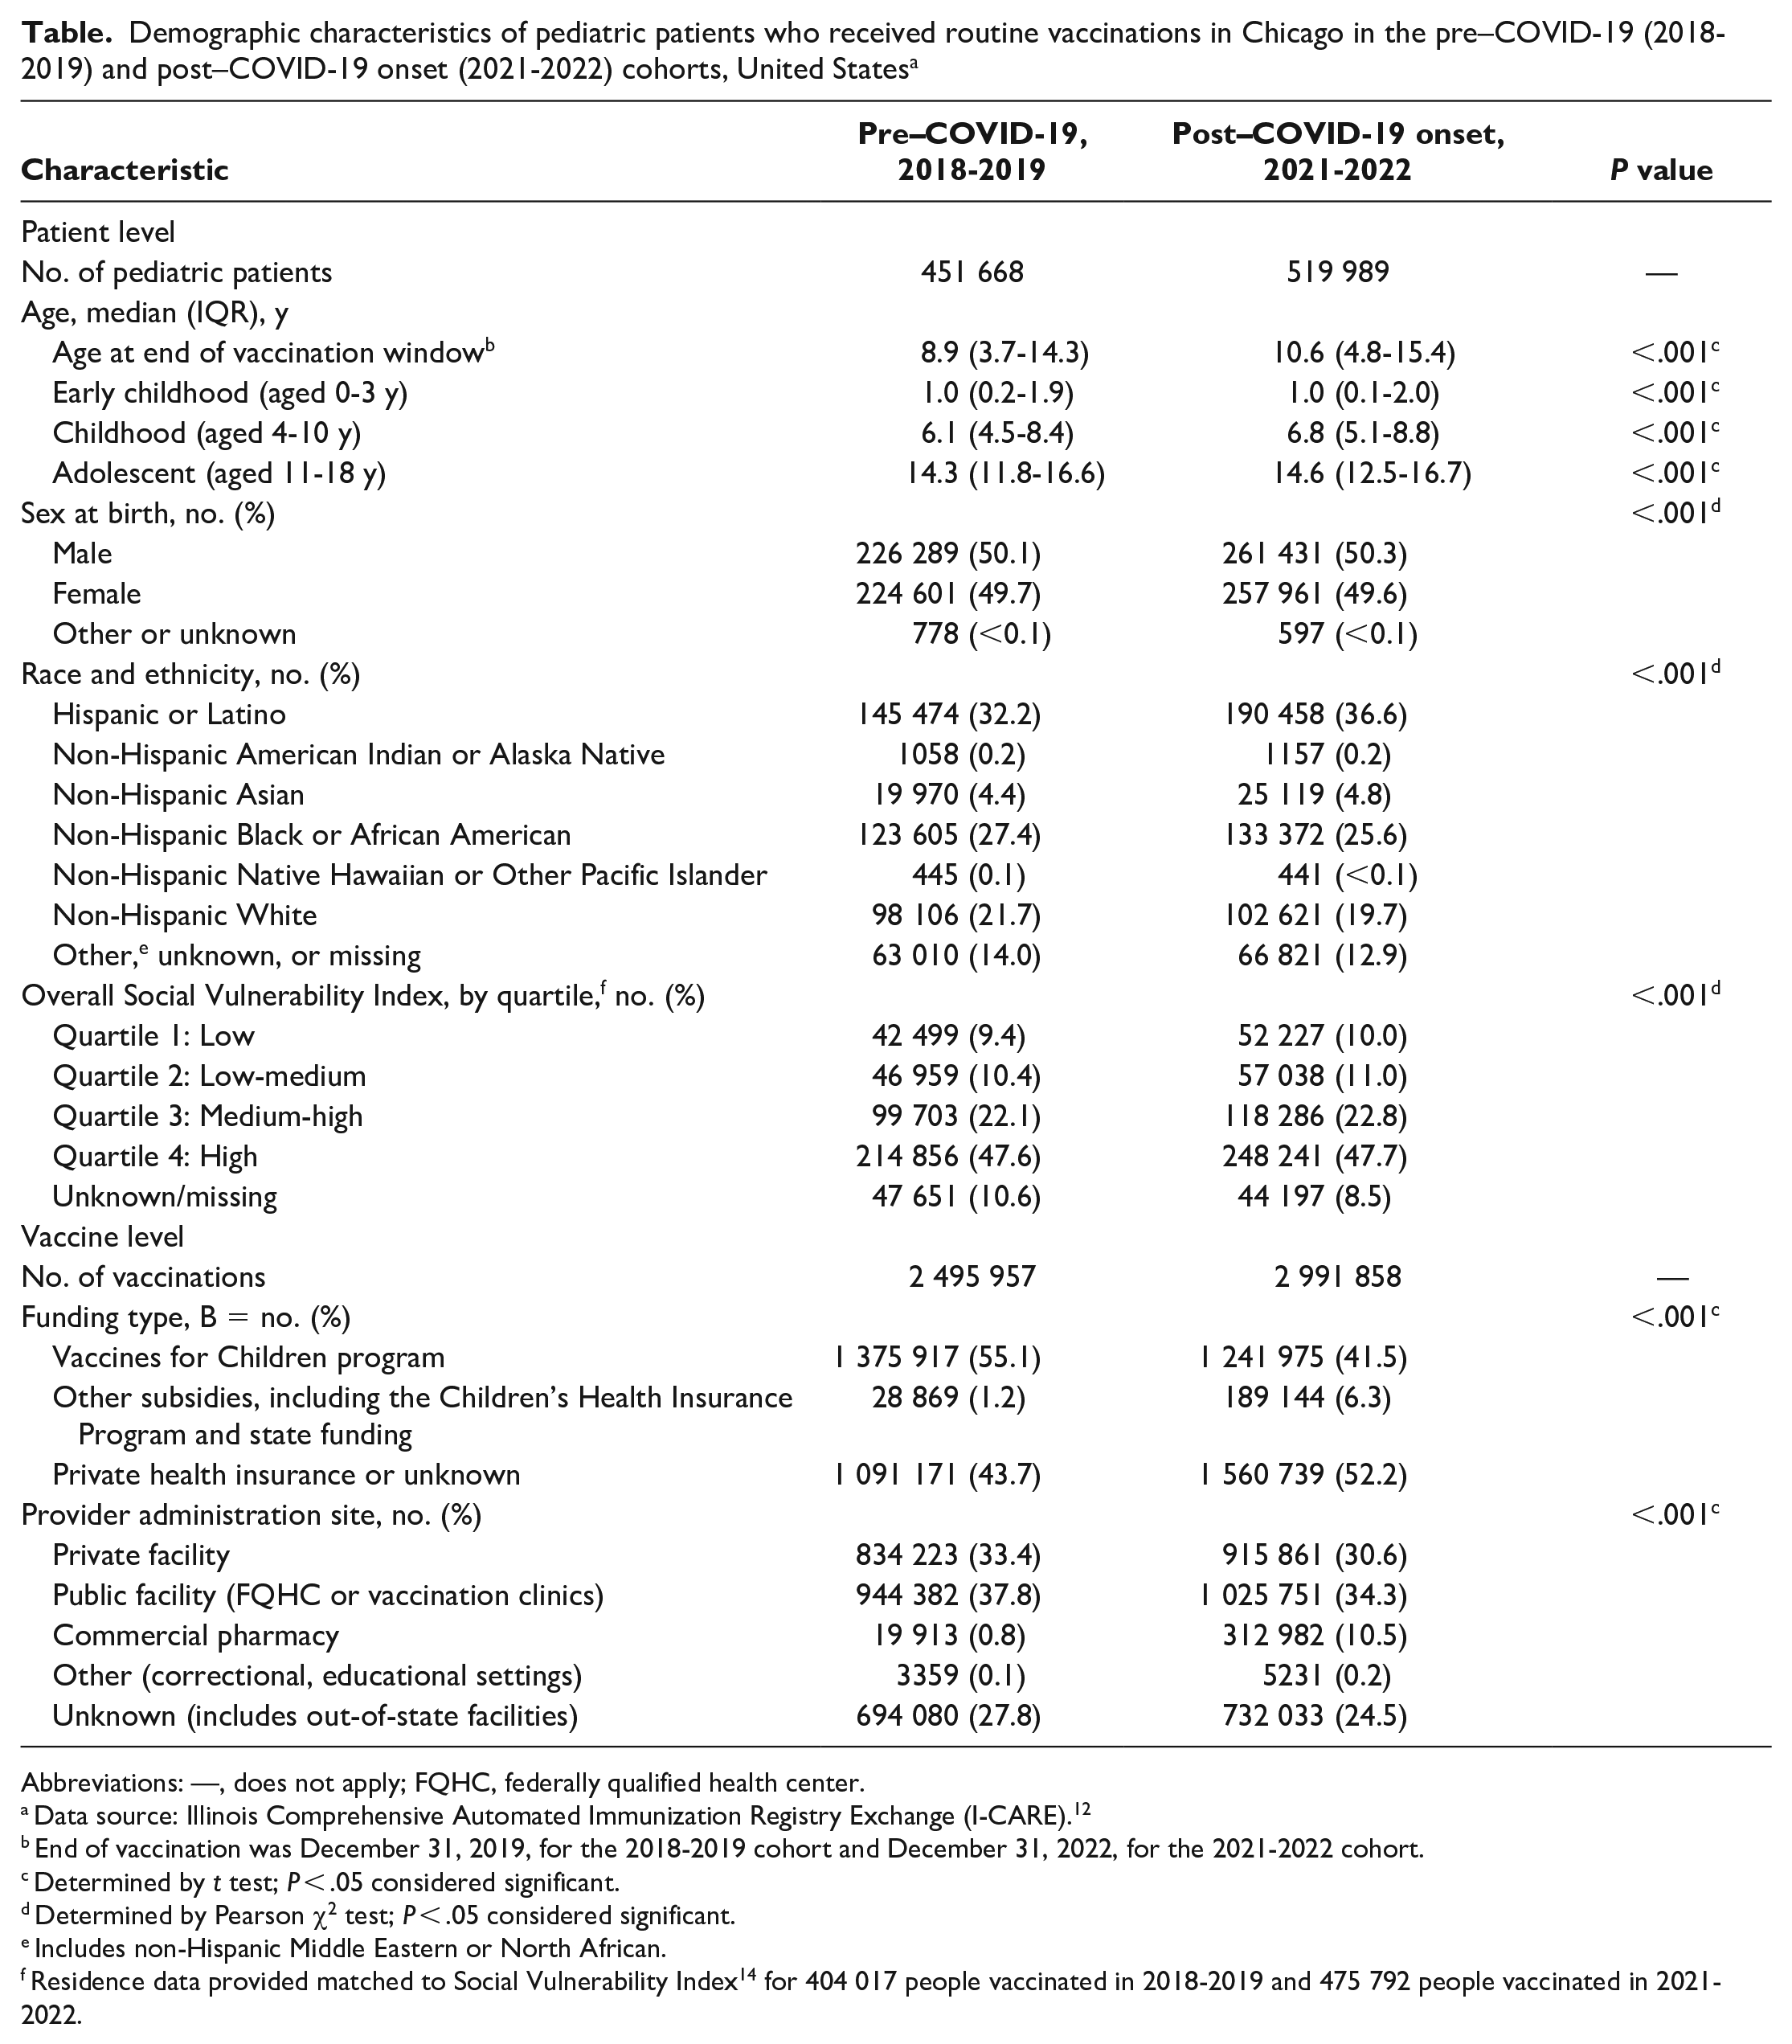
Abbreviations: —, does not apply; FQHC, federally qualified health center.
Data source: Illinois Comprehensive Automated Immunization Registry Exchange (I-CARE). 12
End of vaccination was December 31, 2019, for the 2018-2019 cohort and December 31, 2022, for the 2021-2022 cohort.
Determined by t test; P < .05 considered significant.
Determined by Pearson χ2 test; P < .05 considered significant.
Includes non-Hispanic Middle Eastern or North African.
Residence data provided matched to Social Vulnerability Index 14 for 404 017 people vaccinated in 2018-2019 and 475 792 people vaccinated in 2021-2022.
Overall, 5 487 815 vaccine doses were received during the study periods. Pre–COVID-19 cohort members received 2 495 957 doses, and post–COVID-19 onset cohort members received 2 991 858 doses. The proportion of vaccines subsidized by the Vaccines for Children Program was higher in the pre–COVID-19 cohort than in the post–COVID-19 onset cohort (55.1% vs 41.5%), whereas the proportion of vaccines subsidized by other programs, including the Children’s Health Insurance Program or state funding, was higher in the post–COVID-19 onset cohort than in the pre–COVID-19 cohort (6.3% vs 1.2%). A greater proportion of pre–COVID-19 cohort vaccines than post–COVID-19 onset cohort vaccines were received at private facilities (33.4% vs 30.6%). The proportion of vaccines received at commercial pharmacies was higher in the post–COVID-19 onset cohort than in the pre–COVID-19 cohort (10.5% vs 0.8%). The type of provider site where doses were received was unknown for a slightly greater proportion of vaccines received by the pre–COVID-19 cohort than the post–COVID-19 cohort (27.8% vs 24.5%).
Median Time to Vaccination by Cohort
We estimated the median time to vaccination by age group (early childhood, childhood, and adolescence) and by individual dose received (Figure 2, eTable 3 in the Supplement). Overall, the median (IQR) time to vaccination in days was slightly greater among the post–COVID-19 onset cohort, compared with the pre–COVID-19 cohort, among those receiving adolescent vaccines (249 [86-624] vs 219 [69-614] d) and slightly greater for early childhood vaccines (34 [7-182] vs 33 [7-145] d). The median (IQR) time to vaccination was also greater for the post–COVID-19 onset cohort, compared with the pre–COVID-19 cohort, for childhood vaccines (138 [30-384] vs 101 [22-335] d).
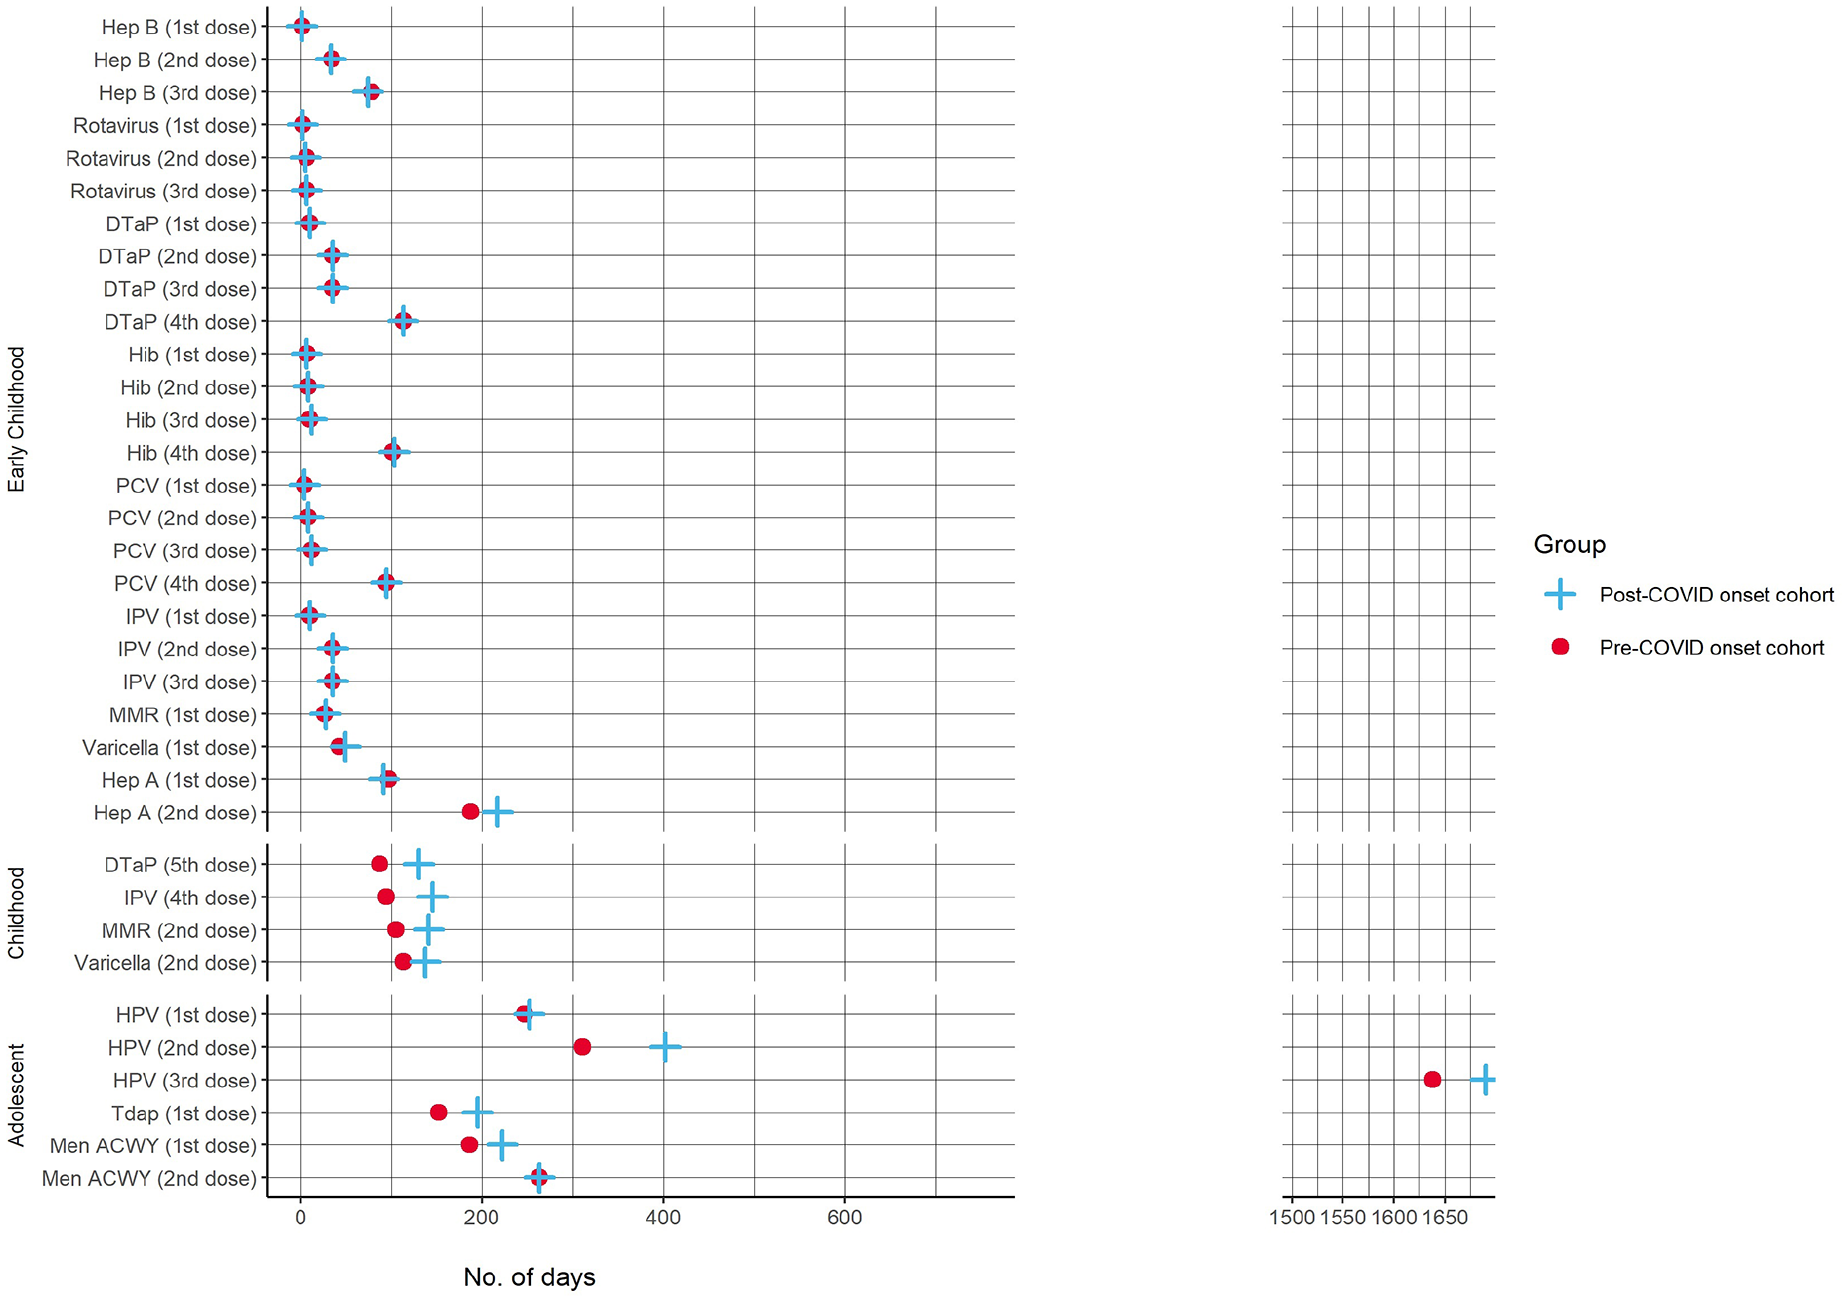
Comparison of the median time to vaccination for pediatric patients in Chicago by dose received between pre–COVID-19 (2018-2019) and post–COVID-19 onset (2021-2022) cohorts. Abbreviations: DTaP, diphtheria, tetanus, and acellular pertussis; Hep, hepatitis; Hib, Haemophilus influenzae type b; HPV, human papillomavirus; IPV, inactivated polio vaccine; MMR, measles, mumps, and rubella; PCV, pneumococcal conjugate vaccine; Tdap, tetanus, diphtheria, and acellular pertussis. Data source: Illinois Comprehensive Automated Immunization Registry Exchange (I-CARE). 12
Vaccine-specific delays were greater among the post–COVID-19 onset cohort compared with the pre–COVID-19 cohort, with the greatest difference in median delays in days for human papillomavirus (HPV) dose 2 (91 d); HPV dose 3 (52 d); inactivated poliovirus (IPV) dose 4 (51 d); diphtheria, tetanus, and acellular pertussis (DTaP) dose 5 (43 d); and tetanus, diphtheria, and acellular pertussis (Tdap) dose 1 (43 d). HPV dose 3 had the longest delays in median (IQR) days overall (post–COVID-19 onset cohort = 1690 [152-2215] d and pre–COVID-19 cohort = 1638 [131-2148] d). The vaccine doses with the next-longest median (IQR) delays were HPV dose 2 for the post–COVID-19 onset cohort (402 [191-997] d) and the pre–COVID-19 cohort (311 [144-960] d) and meningococcal serogroup A,C,W,Y dose 2 for both the post–COVID-19 onset cohort and the pre–COVID-19 cohort (263 median days for both groups [IQR, 94-503 d] for the post–COVID-19 onset cohort and [IQR, 93-490 d] for the pre–COVID-19 cohort).
Cox Proportional Hazard Models
In the hazard models (Figure 3), the greatest difference in hazards between cohorts was for hepatitis A dose 2 (HR = 0.77; 95% CI, 0.76-0.77), followed by Haemophilus influenzae type b (Hib) dose 3 (HR = 0.86; 95% CI, 0.84-0.87), DTaP dose 5 (HR = 0.87; 95% CI, 0.85-0.88), MMR dose 2 (HR = 0.91; 95% CI, 0.90-0.92), HPV dose 2 (HR = 0.93; 95% CI, 0.92-0.95), and Hib dose 4 (HR = 0.94; 95% CI, 0.91-97). The greatest differences in time-dependent models were for the following vaccines and periods: IPV dose 4 at ≤900 days after eligibility (HR = 0.86; 95% CI, 0.85-0.88), meningococcal serogroup A,C,W,Y dose 1 at ≤600 days after eligibility (HR = 0.89; 95% CI, 0.88-0.90), and varicella dose 2 ≤750 days after eligibility (HR = 0.94; 95% CI, 0.92-0.95). For most vaccines, children and adolescents in the post–COVID-19 onset cohort were more likely to have a longer time to vaccination than the pre–COVID-19 cohort for these vaccines, after adjustment.
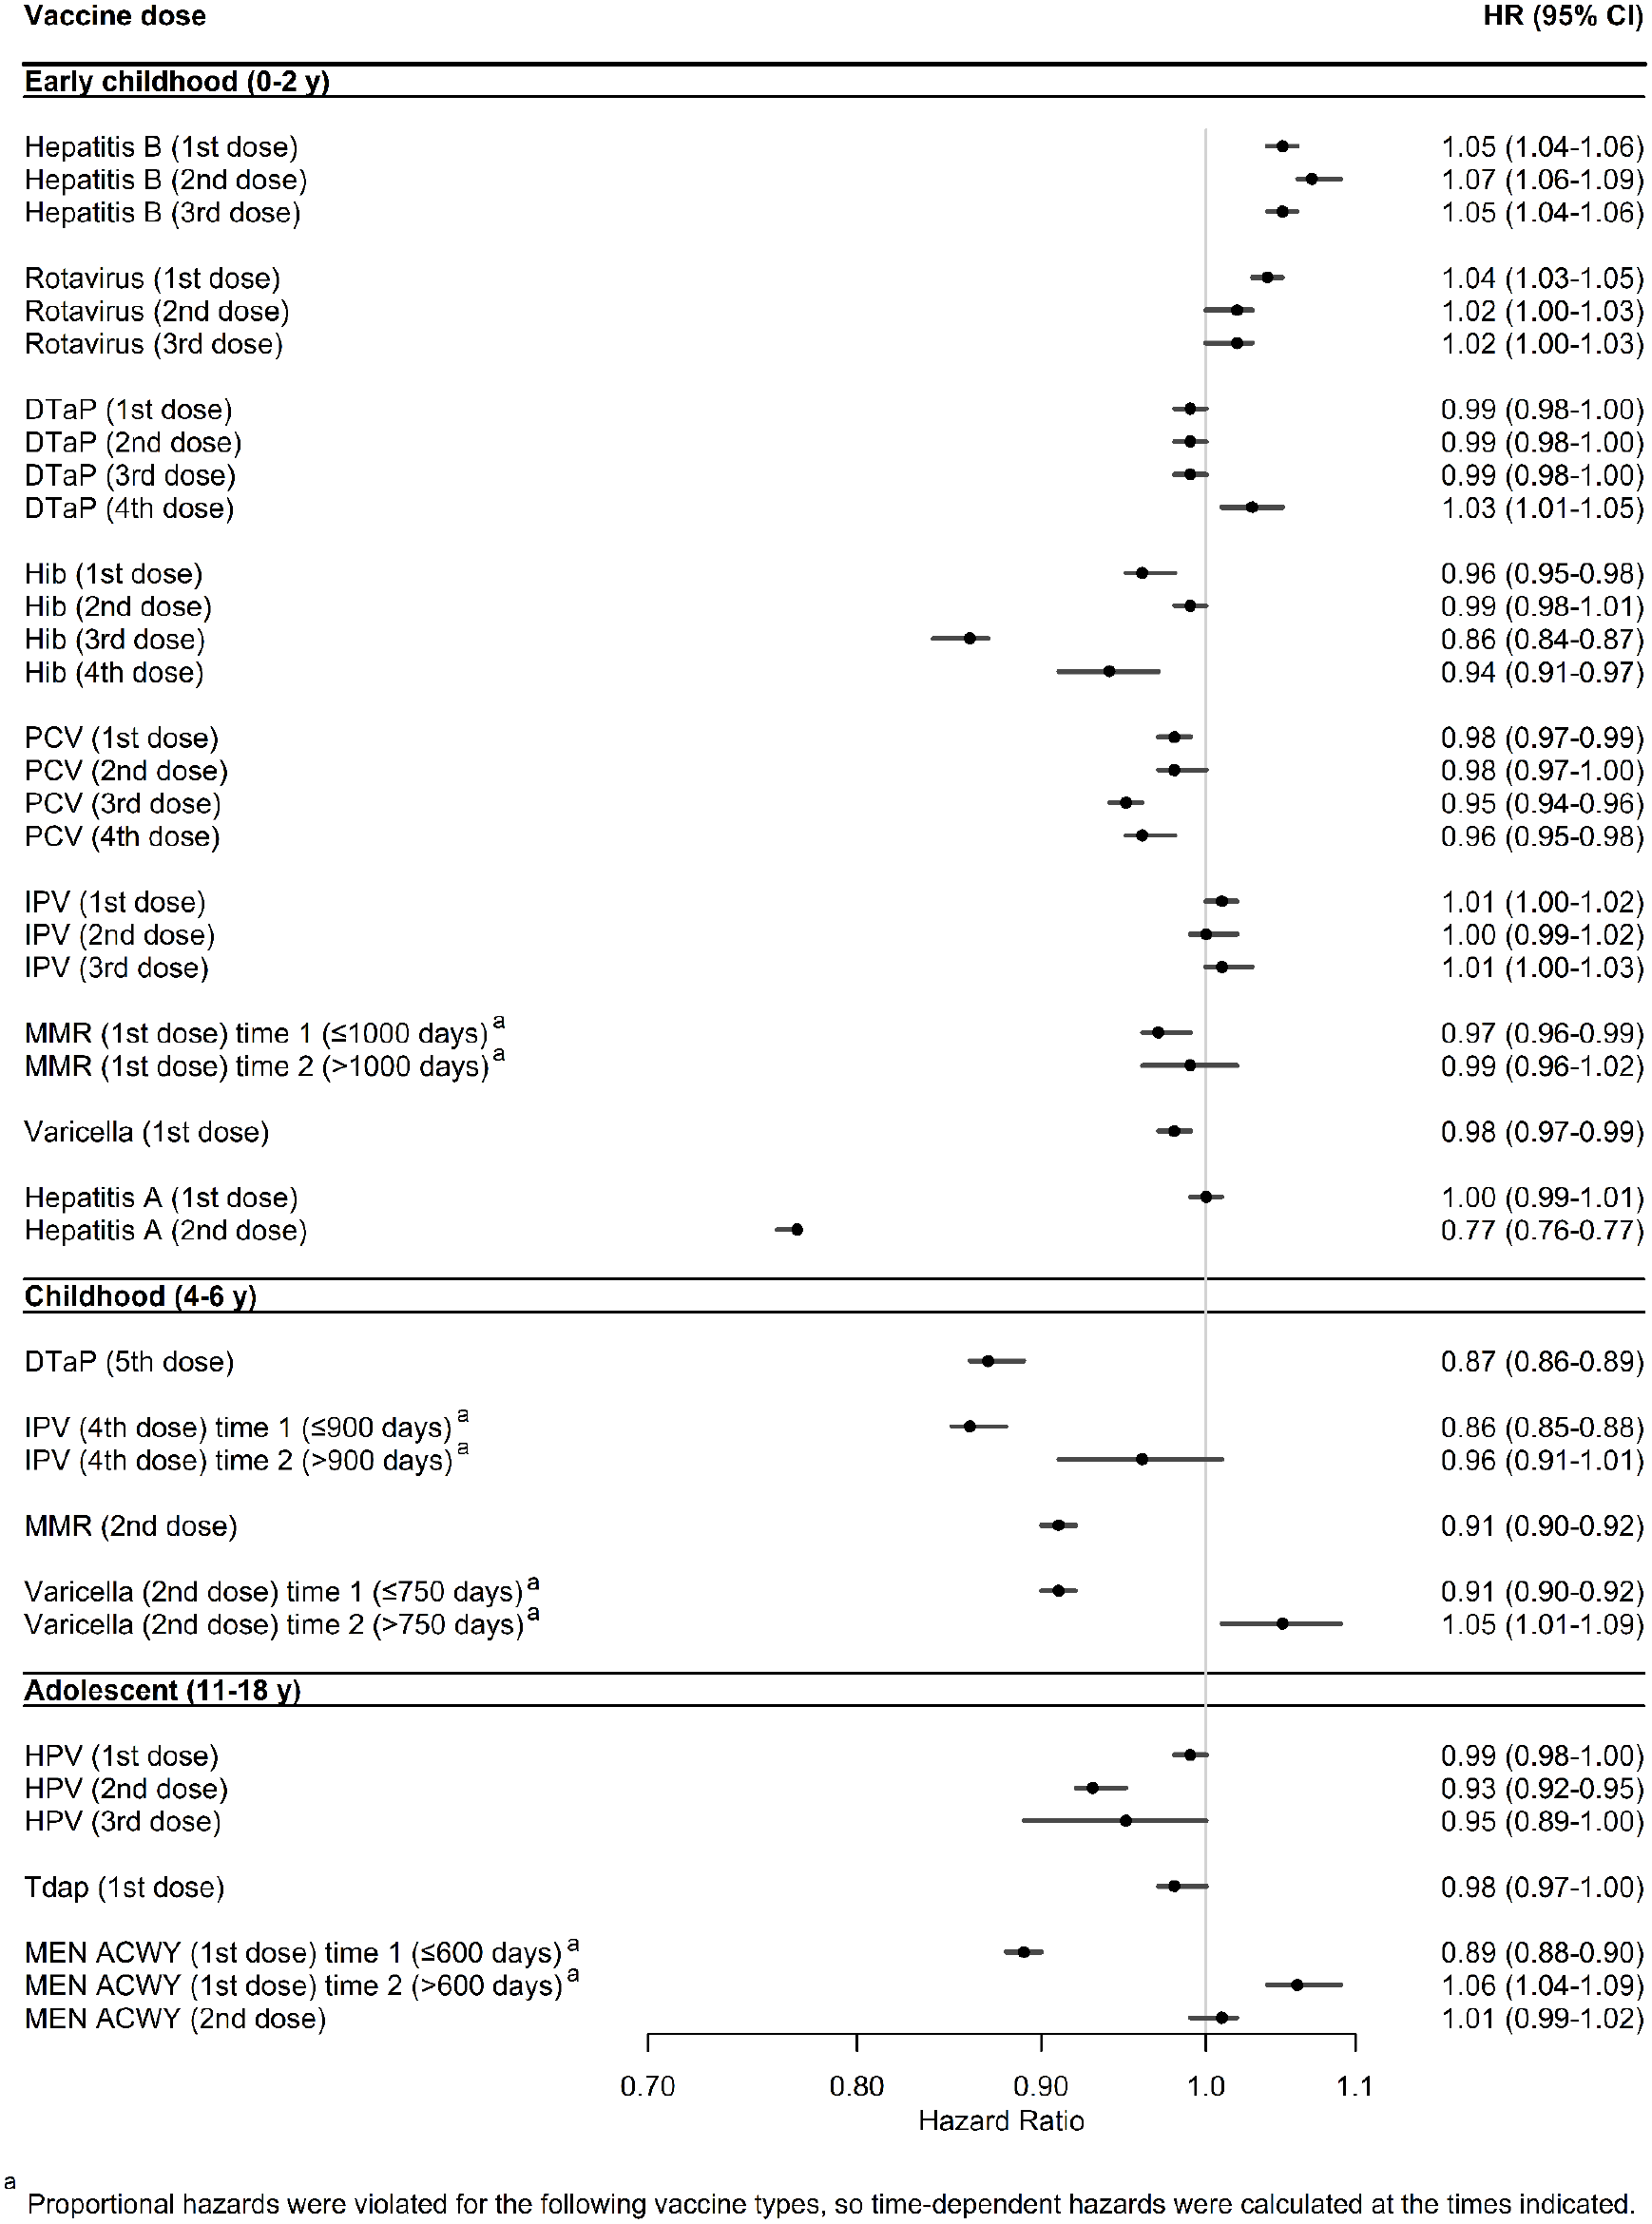
Adjusted Cox proportional hazard model results comparing the rate of routine pediatric vaccination in Chicago in the post–COVID-19 onset (2021-2022) cohort with the rate in the pre–COVID-19 (2018-2019) cohort. Hazard ratios (HRs) were adjusted for age at the end of cohort period, provider site type, vaccine funding type, Social Vulnerability Index quartile, and race and ethnicity, with 2018-2019 as the reference group. Abbreviations: DTaP, diphtheria, tetanus, and acellular pertussis; Hib, Haemophilus influenzae type b; HPV, human papillomavirus; IPV, inactivated polio vaccine; Men ACWY, meningococcal serogroup A,C,W,Y; MMR, measles, mumps, and rubella; PCV, pneumococcal conjugate vaccine; Tdap, tetanus, diphtheria, and acellular pertussis. Data source: Illinois Comprehensive Automated Immunization Registry Exchange (I-CARE). 12
Discussion
Using a large, comprehensive immunization registry for all children and adolescents in Chicago, we analyzed the timeliness of vaccination during the periods before and after onset of the COVID-19 pandemic. We found that children and adolescents vaccinated during 2021-2022 had longer vaccination delays than those vaccinated during 2018-2019, particularly for vaccines given to adolescents and children aged 4 to 6 years. HPV had the longest delay of all vaccines in both time frames. These associations held true after adjustment for confounders.
The COVID-19 pandemic has negatively affected routine pediatric vaccination both in the United States and globally9-11,15; however, overall coverage has improved with time. 16 One analysis of the prevalence of delays in children’s preventive health services during the COVID-19 pandemic based on household survey data from 2021 found that >25% of parents delayed preventive services for their children after onset of the COVID-19 pandemic. 17 Our study adds to this literature by highlighting vaccine doses that might have been most delayed among US children and adolescents and can guide recommendations for catch-up vaccination.
Although vaccine delays might be more consequential for first doses, compared with later doses, in terms of baseline immunity for pediatric illnesses, delays in other vaccines (eg, HPV) can result in a greater incidence of cancers, particularly in areas with a high prevalence of cervical cancer. 18 Greater delays in vaccines given in adolescence may be explained by the fact that telemedicine visits were more frequent among adolescents than among younger children during the COVID-19 pandemic. 8 Older children and adolescents may also face more competing scheduling priorities than younger children, 19 regardless of pandemic period, and have less frequent well-child visits where catch-up vaccinations could be given. 20
Recent studies have examined drivers of routine vaccination declines during the COVID-19 pandemic, including barriers to routine vaccination access during health care interruptions and increased vaccine hesitancy.21-23 Therefore, reduced access to routine vaccination due to health care interruptions alone might not explain delays or reduced vaccine coverage. Routine pediatric vaccine provision at pharmacies increased during the post–COVID-19 onset period. 24 While pharmacists in Illinois can administer vaccines to children beginning at age 7 years, an amendment of the Public Readiness and Emergency Preparedness (PREP) Act allowed pharmacists to vaccinate children beginning at age 3 years for routine childhood vaccinations from August 24, 2020, until the end of the public health emergency in May 2024. 25 Clinician engagement is key for vaccination uptake, because clinicians are the most-cited information source on vaccination among parents.3,26 Information on the vaccines that tend to lag the most can be useful to clinicians while discussing recommendations with parents. Untimely vaccination, including early vaccination, can have important immunologic and practical implications, such as missed school if students are noncompliant with mandatory vaccinations. Given that delays were longer for some vaccines not mandated for school entry than for mandated vaccines, a multifaceted approach, including reminder or recall interventions, engagement, and vaccination in clinical, school, and community settings, and vaccine coadministration strategies could improve catch-up vaccination. 27
Limitations
This study had multiple limitations. First, while I-CARE is the best source for population-level vaccination data and is the only source of its type in Illinois and Chicago, vaccine reporting is voluntary unless required through a publicly funded program, such as Vaccines for Children. Thus, our analysis had to be limited to timeliness of vaccination among children and adolescents. Cook County (where Chicago is located) has experienced an annual population decline since 2020. 28 Whether I-CARE vaccination records were fewer after 2020 because of loss to follow-up (e.g., relocation to another jurisdiction) or because of incomplete vaccination is not possible to determine. To address this question, we filtered the data to include only individuals active in the system or those with more than just the universal hepatitis B birth dose. Second, our findings are generalizable only to similar study populations. Characteristics of unvaccinated populations might be different from those of vaccinated populations. Third, some children and adolescents would have been represented in both cohorts, so we are not demonstrating differences in the characteristics between people in each cohort but, rather, the timeliness of vaccination behavior based on the time frame of vaccination. Timeliness could have been influenced by vaccine access or vaccine hesitancy, which could have changed for a given individual during the COVID-19 pandemic. Finally, the potential exists for measurement error in the I-CARE record (eg, number of vaccines received). I-CARE’s validity rules for doses occasionally result in false positives (valid doses marked as invalid) or false negatives (invalid doses marked as valid). To address this limitation, we recoded and reapplied validity rules based on the vaccination schedule to ensure invalid doses were properly removed while valid doses were kept. We also cannot differentiate between exceptions to the schedule, such as for travel-related vaccinations or immunocompromising conditions that affect vaccination. Any resulting measurement error is likely nondifferential by study period. We further mitigated error in the vaccine record by excluding records that did not meet data quality criteria (eg, an unusual number of vaccine doses) or internal I-CARE quality checks.
Conclusions
Our findings are consistent with other analyses of delays in routine vaccination after the onset of the COVID-19 pandemic. Most vaccines administered in childhood had greater delays during the post–COVID-19 onset period (2021-2022) than during the pre–COVID-19 period (2018-2019). Attention should be given to vaccines recommended during ages 4 to 6 years and in adolescence. Certain vaccines not required for school attendance (eg, hepatitis A, HPV) should be prioritized for catch-up vaccination. Clinician recommendations remain the strongest source of information for parents considering vaccination for their children.
Supplemental Material
sj-docx-1-phr-10.1177_00333549251319290 – Supplemental material for Pediatric Routine Immunization Delays in Chicago Before and After the Onset of the COVID-19 Pandemic
Supplemental material, sj-docx-1-phr-10.1177_00333549251319290 for Pediatric Routine Immunization Delays in Chicago Before and After the Onset of the COVID-19 Pandemic by Emily A.G. Faherty, Elizabeth Meininger, Spencer Gorelick, Hillary Spencer and Stephanie Gretsch in Public Health Reports
Footnotes
Declaration of Conflicting Interests
The authors declared no potential conflicts of interest with respect to the research, authorship, and/or publication of this article.
Funding
The authors received no financial support for the research, authorship, and/or publication of this article.
Disclaimer
The findings and conclusions in this article are those of the authors and do not necessarily represent the official position of the Centers for Disease Control and Prevention.
Supplemental Material
Supplemental material for this article is available online. The authors have provided these supplemental materials to give readers additional information about their work. These materials have not been edited or formatted by Public Health Reports’s scientific editors and, thus, may not conform to the guidelines of the AMA Manual of Style, 11th Edition.
References
Supplementary Material
Please find the following supplemental material available below.
For Open Access articles published under a Creative Commons License, all supplemental material carries the same license as the article it is associated with.
For non-Open Access articles published, all supplemental material carries a non-exclusive license, and permission requests for re-use of supplemental material or any part of supplemental material shall be sent directly to the copyright owner as specified in the copyright notice associated with the article.