
Abstract
Smartphones have made it nearly effortless to share images of branded experiences. This research classifies social media brand imagery and studies user response. Aside from packshots (standalone product images), two types of brand-related selfie images appear online: consumer selfies (featuring brands and consumers’ faces) and an emerging phenomenon the authors term “brand selfies” (invisible consumers holding a branded product). The authors use convolutional neural networks to identify these archetypes and train language models to infer social media response to more than a quarter-million brand-image posts (185 brands on Twitter and Instagram). They find that consumer-selfie images receive more sender engagement (i.e., likes and comments), whereas brand selfies result in more brand engagement, expressed by purchase intentions. These results cast doubt on whether conventional social media metrics are appropriate indicators of brand engagement. Results for display ads are consistent with this observation, with higher click-through rates for brand selfies than for consumer selfies. A controlled lab experiment suggests that self-reference is driving the differential response to selfie images. Collectively, these results demonstrate how (interpretable) machine learning helps extract marketing-relevant information from unstructured multimedia content and that selfie images are a matter of perspective in terms of actual brand engagement.
Keywords
Every day, more than 6.5 billion images are shared on social media platforms such as Facebook, Twitter, or Instagram. 1 Images that feature brands and consumption experiences—namely, brand images—are of particular interest to marketers. Drawing on a sample of images from social media, we estimate that approximately 1% of all social media images contain branded content. That is, about 65 million posts each day feature brand logos. The diversity of content in this social media brand imagery likely exceeds any traditional advertising channel and collectively reaches a considerable number of prospective and existing customers.
In terms of the types of user-generated images, one of the biggest trends introduced by smartphone cameras and social media are selfies. Selfies have quickly become so popular that Oxford Dictionaries named “selfie” the word of the year in 2013. According to estimates, individual millennial users will take more than 25,000 selfies in their lifetime (Glum 2015), and more than 450 million images with the hashtag #selfie exist on a single photo-sharing platform such as Instagram.
The emergence and explosive proliferation of selfies merit the question of how brands appear in selfie images and how social media observers respond to such images. From the brand perspective, contemporary marketing practice attempts to capitalize on the selfie phenomenon. For example, companies such as Lay's potato chips, Unilever (Axe deodorant), Budweiser, and Dunkin’ actively encourage consumers to post selfies of their product encounters (for examples, see Web Appendix A). Coca-Cola even constructed a “Selfie Bottle” to assist consumers in taking pictures of themselves while drinking (Pendlebury 2016). Lay's produced a special “Smiles” packaging that motivated consumers to post selfie images that reportedly resulted in over 30,000 tweets (Adams 2019) and nearly 20,000 Instagram posts with the hashtag #SmileWithLays (https://www.instagram.com/explore/tags/smilewithlays/).
In addition to these actively managed campaigns, brand images are also of interest to firms when passively listening in on unsolicited social media posts. Among other things, companies track brand-logo presence on social media to understand social media popularity, rank consumer-generated images on their social media brand page, or use such images as part of their own marketing campaigns. Merely counting logo appearances may result in erroneous conclusions because viewers may respond differently to different types of brand images. Accordingly, the objectives of this research are (1) to create a taxonomy of how brands appear in consumer-generated images and (2) to examine how different image perspectives relate to brand engagement.
Academic research provides ample evidence about consumer response to advertising images (e.g., Xiao and Ding 2014). However, social media posts differ from traditional advertising because observers are often socially connected with the sender featured on an image. Although recent studies have explored how taking and sharing photos on social media affects subsequent sender behavior (e.g., Barasch, Zauberman, and Diehl 2018; Grewal, Stephen, and Coleman 2019), little is known about observer response to brand-image posts. Frequently used indicators of social media engagement typically rely on sender-directed responses such as the number of likes and comments (e.g., Herhausen et al. 2019; Li and Xie 2020). However, engagement with the post or sender may not translate to engagement with the brand. In fact, consumer presence in selfie images may stimulate thoughts related to the sender and communication intent as opposed to brand-related thoughts and purchase intent.
We investigate how social media brand images relate to brand engagement by studying more than a quarter-million images with 185 visible beverages and food brands. Following recent calls for multimedia research (Colicev 2021; Grewal, Gupta, and Hamilton 2020), we leverage transfer learning and convolutional neural networks (CNNs) to classify the different types of brand images and identify three distinct archetypes that differ in terms of human and facial presence. Consumers post images of products in isolation or themselves holding the products (i.e., selfies). We find that these brand-related selfies exist in two forms, with either consumer faces visible or a first-person point of view of the product with the sender’s face not visible to observers. We term the former “consumer selfies” and the latter “brand selfies” to indicate that the focus in brand selfies is exclusively on the product and to differentiate it from consumer selfies, in which the sender's face is visible. This terminology results in the following typology of brand images (see Figure 1)
2
:
Brand selfies: Branded products held by an invisible consumer. Consumer selfies: Visible consumer faces together with a branded product. Packshots: Standalone images of branded products.

Illustrative examples of the three brand-image types.
Analyzing more than a quarter-million brand images from Instagram (N = 43,585) and Twitter (N = 214,536), we identify 27% as brand selfies, 64% as packshots, and only 9% as consumer selfies (classification accuracy > 90%). The low fraction of consumer-selfie images on social media platforms might reflect consumers’ reluctance to post photos of themselves with brands. Despite this relatively low share of unsolicited consumer selfies, encouraging consumers to take such images appears to be a popular marketing strategy by firms (see Web Appendix A), perhaps due to the popularity of faces in traditional advertising (To and Patrick 2021; Xiao and Ding 2014) and the prevalence of non-brand-related selfie images in social media. Whether brand-related consumer selfies generate positive brand engagement on social media is an open question that we address in this research.
In addition to automated image analysis, we apply text mining using transformer-based language models to the comments that observers made in response to image posts. These deep-learning architectures take context dependencies of individual text elements into account (e.g., apple as a fruit vs. Apple as a firm), which resulted in high accuracy levels in our application. Specifically, we identify comments that express purchase intentions (e.g., “Now I want a Pepsi, too!”). Across the two social media platforms, we find consistent evidence that whereas consumer selfies generate the highest level of sender engagement (i.e., likes and comments), visible consumer faces result in lower levels of brand engagement (i.e., purchase-intent comments) relative to brand selfies. We also investigate whether these effects generalize to display ads that are typically only at the perimeter of consumers’ attention. Analyzing the response to over 600 display ads of handheld consumer technology products, we find that brand-selfie ads are associated with higher click-through rates (CTRs) relative to consumer-selfie ads. However, the differences between image types are less pronounced than for social media content. We also replicate our results on selfie images under random assignment in two controlled lab experiments with purchase intent measured on traditional rating scales. Mediation analysis suggests that self-reference is driving the differential response to selfie images.
From a marketing perspective, these collective findings clarify that brand-related selfie images are not created equal. Whereas counts of likes are readily available, they measure sender-related communication and may not reflect brand interest. This observation is consistent with consumer selfies generating more likes but brand selfies generating higher levels of self-reference and actual brand engagement (see Table 1). The consistency of results across social media platforms and consumer- versus firm-generated content, together with the experimental evidence, suggests that images with high potential for self-reference result in systematically higher levels of brand engagement. Sender engagement, in contrast, is driven by visible familiar faces that trigger communication intent. Thus, social media managers should be mindful of different brand-image perspectives and which engagement metric they track and optimize. Merely counting likes and comments can result in erroneous conclusions. Instead, we find that leveraging recent advances in language modeling to construct more informative measures on the basis of what users have to say can be a more useful approach.
Summary of Empirical Evidence.

Indicates significant differences between BS and CS.
Notes: > indicates significant differences at p < .05, ∼ indicates n.s. BS = brand selfie, CS = consumer selfie, PS = packshot.
The remainder of this article is organized as follows: First, we discuss the literature related to user-generated brand content and consumer response to brand images. We then describe the analysis of the extensive Twitter and Instagram image data sets and the deep-learning algorithms we deploy to identify the archetypes of brand images and their impact on sender and brand engagement. The subsequent section analyzes CTRs of display ads, followed by controlled lab experiments, to understand the causal impact of image types on consumers’ reactions. We conclude with a discussion, suggestions for future research, and implications for social media marketing.
Brand Images in Social Media
The Role of User-Generated Brand Content in Social Media
Numerous studies demonstrate the importance of user-generated content (UGC) as a means for social listening—that is, understanding customer needs, opinions, and motivations (Chung et al. 2021; Moe, Netzer, and Schweidel 2017). The majority of this research has relied either on summaries of text content such as volume and valence (e.g., Chevalier and Mayzlin 2006; Godes and Mayzlin 2004; Liu 2006) or on automatic extraction of consumer perceptions in user-generated texts (e.g., Netzer et al. 2012; Timoshenko and Hauser 2019; Tirunillai and Tellis 2014). For example, the amount and valence of aggregate UGC have proven useful as predictors of demand (Chevalier and Mayzlin 2006; Liu 2006), customer-based brand equity (Schweidel and Moe 2014), and stock returns (Colicev et al. 2018).
Despite the rapid proliferation of images in social media, academic research on UGC has focused mainly on textual analysis. Recently, a few studies have made use of advances in deep learning to move beyond text content (e.g., Dzyabura and Peres 2021; Liu, Dzyabura, and Mizik 2020; Zhang et al. 2018). For example, Li and Xie (2020) show that social media posts with images garner more likes than text-only posts. From the sender perspective, Grewal, Stephen, and Coleman (2019) find that sharing photos serves a critical social objective in terms of identity signaling.
Regarding the effect of UGC on observers, social media research has mainly studied communication directed toward the sender by tracking the number of likes or comments a post receives (e.g., Herhausen et al. 2019; Li and Xie 2020). Likes have also become an important performance indicator in applied social media marketing (Colicev 2021). However, in terms of actual brand impact, focusing on likes alone makes the implicit assumption that sender-directed engagement translates into brand engagement. One of the objectives of this research is to investigate the relationship between the commonly used metrics such as the number of likes and comments and brand-engagement metrics in the context of social media brand imagery.
Consumer Response to Different Brand-Image Types
The emerging phenomenon of brand selfies raises the question of how observers process this type of brand imagery. Brand selfies differ from consumer selfies by the absence of a (familiar) face of a friend or a related social media user. They also differ in the ego versus third-person perspective. These differences suggest that, relative to consumer selfies, brand selfies are (1) associated with fewer other-related thoughts and (2) cue more self-thoughts related to the brand.
For traditional advertising, consumers have been found to process information by relating it to themselves and bringing personal experiences and mental images to mind (Burnkrant and Unnava 1995; Escalas 2007; Meyers-Levy and Peracchio 1996). This mental simulation of consumption experiences creates positive brand-related outcomes such as higher brand recall, more positive brand attitudes, and higher purchase intentions (Burnkrant and Unnava 1995; Elder and Krishna 2012, 2021; Escalas 2007; Meyers-Levy and Peracchio 1996; Zhao, Hoeffler, and Zauberman 2011). Accordingly, enhancing self-reference is a relevant objective for advertisers when managing brand engagement and brand recall.
Although the self-reference literature is rich and wide, to the best of our knowledge, self-reference has not been studied in the context of social media in general and selfie images in particular. In addition, tests of self-reference effects in the field are scant. Theoretically, the facial presence in consumer selfies is likely to shift consumers toward other- as opposed to self-related thoughts. Indeed, the visibility of other “typical consumers” in advertising has been observed to inhibit self-referent thinking, with viewers considering how they might relate to the person in the image (Debevec and Romeo 1992; To and Patrick 2021). On social media, viewers typically know the sender to some degree and may even share similar experiences, likely making the effect more pronounced than a stranger visible on an ad would. Conversely, brand selfies, taken from the observer's point of view, may enhance brand-specific self-related thought. According to self-reference theory, consumers’ ability to relate the brand more easily to their own personal experiences in brand selfies can generate higher levels of cognitive elaboration and mental simulation of brand consumption (Bower and Gilligan 1979; Escalas 2007), which has been linked to higher levels of brand engagement (Elder and Krishna 2012; Symons and Johnson 1997).
Compared with both types of selfie images, we expect packshots to have an intermediate position with regard to brand engagement. Packshots feature a brand without facial distractions. They should therefore induce higher levels of self-reference than consumer selfies that shift viewer focus from self-related to other-related thoughts. Unlike brand selfies, packshots do not contain an explicit ego perspective—that is, no visible hand as an “execution device” to drive mental simulation and self-reference (Elder and Krishna 2012). Thus, we can think of the three brand-image types sitting on a self-reference continuum, with brand selfies leading to the strongest self-reference effect, consumer selfies to the lowest, and packshots in between. Accordingly, we expect the differences in brand engagement between consumer selfies and brand selfies to be more pronounced than the difference between the two selfie images and packshots.
Although self-reference effects have been observed in the lab, generalization to the field remains an open empirical question. Besides the familiarity with senders, the ability to generate self-reference requires reasonable levels of attention and interest in the image at hand (Burnkrant and Unnava 1995; Meyers-Levy and Peracchio 1996). Such levels of interest are likely to exist on social media, because user-generated images are a primary reason users visit social media platforms such as Instagram. However, self-reference theory makes no predictions about sender engagement such as likes and comments. Mechanisms other than self-reference are likely to play a role when observers choose to interact with a sender. Specifically, recent research suggests that the type of direct gaze inherent in consumer selfies drives desire for social interactions and interpersonal communication (To and Patrick 2021). Accordingly, consumer selfies may well result in more likes and comments than brand-selfie images that lack a facial presence. This possibility would make likes and comments a poor indicator of actual brand engagement (John et al. 2017).
Similar to traditional advertisements, self-reference effects related to online ads are likely weaker than for UGC, due to banner blindness (Guido, Pichierri, and Pino 2018) and the overall lower level of ad attention and interest (McFerran et al. 2010; Meyers-Levy and Peracchio 1996). Because advertisements often feature strangers with whom consumers cannot interact, the visibility of faces in the ads is likely to trigger lower communication desire and fewer other-related thoughts that may interfere with mental simulation. Consequently, we expect more extreme differences in self-reference and brand engagement for the different types of social media images than for advertising images.
Next, we use field data to investigate the relationship between image type, social media communication, and brand engagement using actual social media posts on Twitter and Instagram.
Empirical Application: Branded Social Media Images on Twitter and Instagram
To investigate the role of brand imagery, we analyze two extensive social media data sets of brand images shared via Twitter and Instagram. We chose Twitter and Instagram due to their popularity and the prevalence of photos on these platforms. In 2021, Twitter had 350 million monthly active users (Statista 2021) and has, in recent years, continuously transitioned its focus from texts to images (Kane and Pear 2016), with approximately 20% of all posts including visual content (Vicinitas 2018). Instagram is considered the most popular image-sharing platform, with more than 1.2 billion monthly active users (Statista 2021). From its inception it was more focused on image creation and distribution than most other popular social media platforms.
Data on Branded Handheld Consumer Products
As a first step, we set out to collect a comprehensive data set of user-generated images that include brand logos from both social media platforms.
We collaborated with a U.S.-based vendor with a Twitter data access to a random sample of 10% of all tweets on Twitter. This access allowed for automatic tracking of logo appearances for 185 brands across ten categories (i.e., candy, cereals, ice cream, snacks, beer, energy drinks, juice, liquor, soft drinks, and sports drinks) over three years (January 2014 to December 2016). All brands in our sample are handheld consumer products that tend to be consumed in public and are commonly shared via social media images (for an overview of the categories and all 185 brands covered in our analysis, see Web Appendices B and C). The vendor identified images that contain brand logos using a proprietary machine-learning solution. We exclude all posts from corporate accounts and further train an algorithm to omit advertising content. The resulting data comprise 214,563 single-logo brand images together with their corresponding tweets. In our econometric models, we further control for user posts classified as containing sponsored content (ad tag). We obtain information on logo position and size using a commercial specialized machine-learning algorithm (LogoGrab; for performance assessments, see Web Appendix D).
In addition to the Twitter image data, we obtain the number of likes and comments each Twitter post had received, the caption of the post (i.e., the text accompanying the image post), and all observer comments’ text content, hashtags, and handletags of the post. We also collect all available information on the senders (their posting frequency, number of friends, and number of followers). We received this information three months after the last image was posted. Because most comments and likes on Twitter happen within the first 24 hours, we are confident that our data set contains the vast majority of the relevant responses to the posts. In addition, we control for post age in our econometric models. Table 2 provides variable descriptions. The left panel in Table 3 presents the summary statistics of all variables in the Twitter sample.
Variable Overview for Field Data.

Summary Statistics of Field Data.
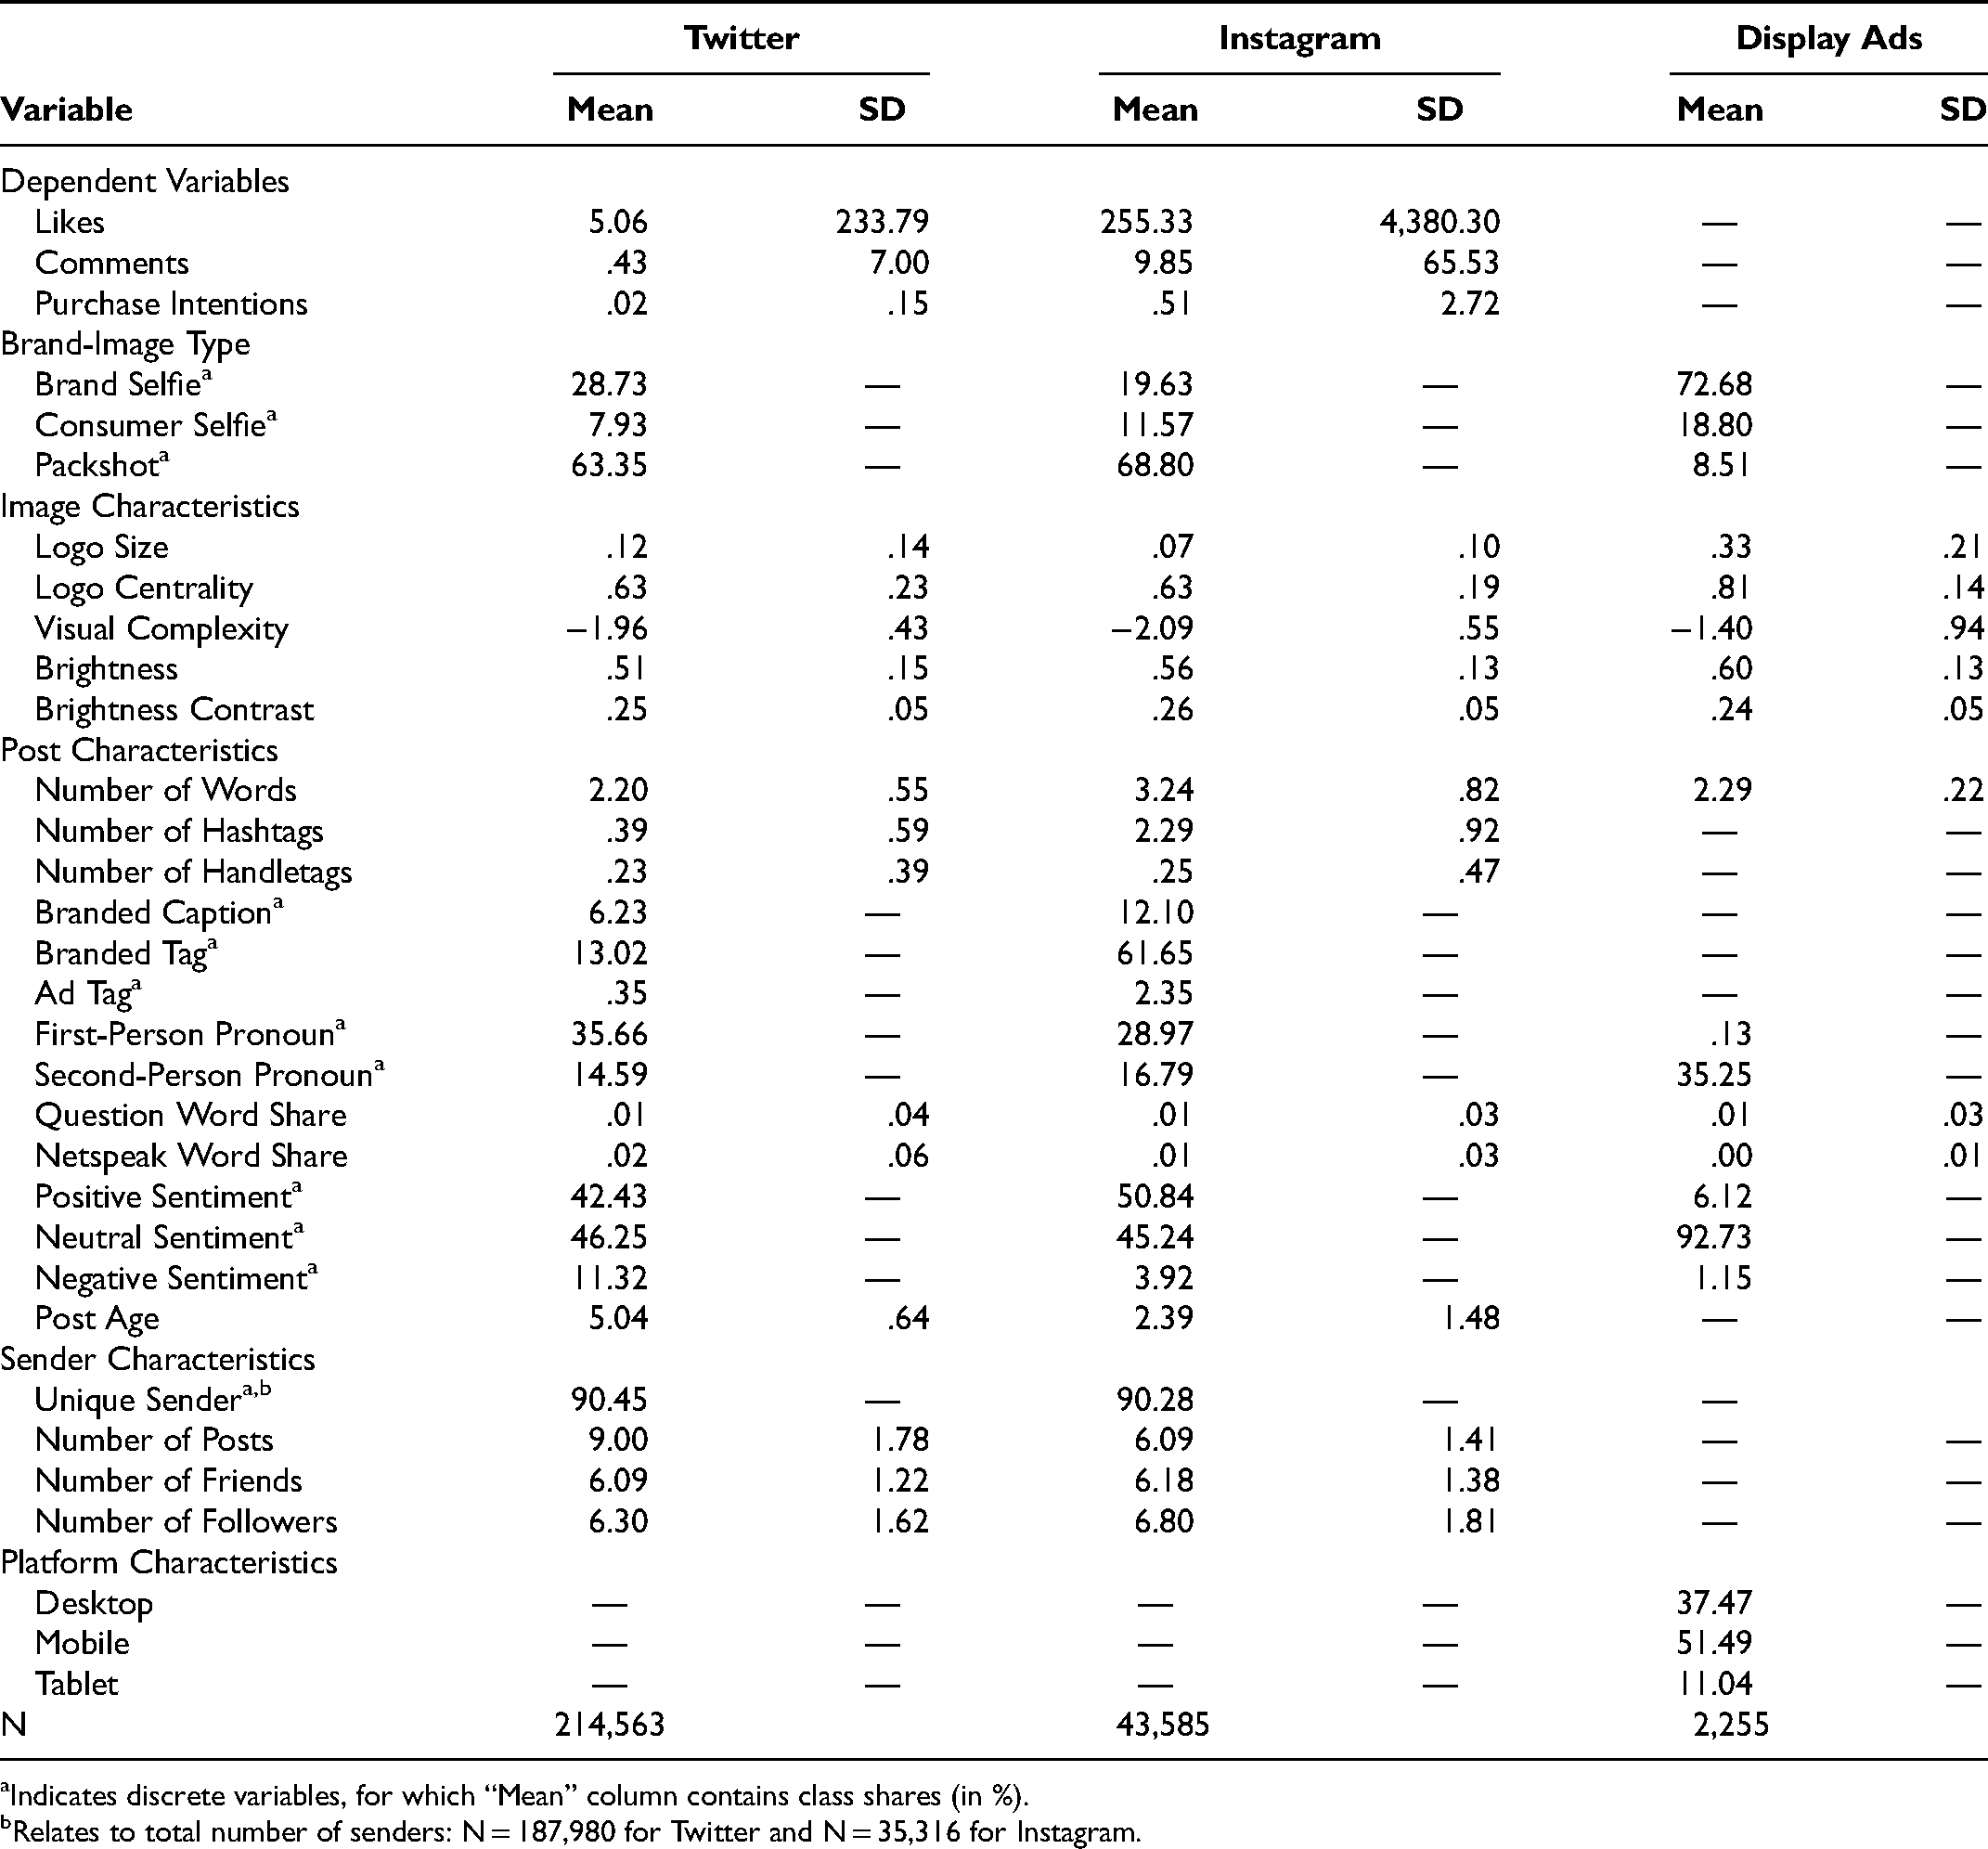
Indicates discrete variables, for which “Mean” column contains class shares (in %).
Relates to total number of senders: N = 187,980 for Twitter and N = 35,316 for Instagram.
We partnered with another third-party vendor with Instagram access to collect an additional data set of 43,585 social media images with brand logos from Instagram for the same set of 185 brands used in the Twitter data. The time range covered by these data spans from June 2011 to October 2019. 3 We obtain and create the same set of variables used in the Twitter analysis. The right panel of Table 3 reports the summary statistics of all variables collected for the Instagram data set. Note that engagement rates for Instagram are higher than for Twitter, which is consistent with industry reports (Feehan 2021).
Mining Unstructured User-Generated Social Media Images and Texts
To assess the brand engagement of different brand-image types, we develop a unified deep-learning pipeline that fuses both advanced image-mining and text-mining techniques. Although images and text each pose unique challenges, both sources of unstructured data can be converted to more structured forms with conceptually similar approaches. At a high level, our approach consists of five steps. Figure 2 summarizes the core elements of our approach.

Deep-learning pipeline to mine unstructured multimedia data.
In the following two subsections, we briefly summarize our approach to mining image and text data (for further details, see Web Appendices D–G).
Automated Image Classification
Model training
Recent advances in computer vision have produced remarkable accuracy levels with superhuman performance in certain domains (e.g., Chung et al. 2017). We build on these deep-learning architectures to automatically classify the types of branded user-generated images we have identified. Specifically, we employ transfer learning to fine-tune an existing deep neural network pretrained on 1.2 million images on ImageNet (Deng et al. 2009). This approach allows us to leverage the typical image features extracted by the ImageNet CNN and transfer them to our application. We modify and add layers to the CNN to enable reliable classification of the three image types. For example, if the features of a hand or a face are captured by the pretrained ImageNet CNN, these features would play an important role in the added layer of predicting whether the image is a brand selfie or a consumer selfie. Transfer learning helps reduce the need for study-specific human-annotated training data and lowers the risk of overfitting to the data at hand (e.g., Yosinski et al. 2014; Zhang and Luo 2021).
We chose VGG-16 as the underlying architecture because of its high performance on related tasks (Simonyan and Zisserman 2014). To appreciate the differences in image characteristics between the two social media platforms, we pursue a two-step training approach. In the first step, we train a base model using the Twitter data. This approach allows us to adapt the CNN pretrained on the ImageNet data set to the particularities of user-generated social media images. In the second step, we take this model, and fine-tune it even further with additional Instagram data to obtain a CNN that generalizes well across both social media platforms. This process allows us to obtain a generalizable CNN that can classify brand-image types reliably across Twitter and Instagram.
To train the algorithm, we manually classified 16,949 images from the Twitter data and 3,000 images from the Instagram data into the three image-type categories. We further expand the training data using data augmentation. This augmentation includes mirroring images horizontally to take into account the higher share of right-handedness in the population, creating a more balanced data set (for further details, see Web Appendix E). The final CNN generalizes well across both platforms as evidenced by greater than 90% accuracy in classifying image types on balanced holdout test sets of 600 brand images; that is, 200 for each image type, for each platform (91.17% and 90.67% for Twitter and Instagram, respectively, vs. 33.3% random chance for the holdout data; for details, see Web Appendix E).
Model interpretation
Although CNNs are commonly considered “black boxes” (i.e., too complex to understand how the algorithm makes classification decisions; Rai 2020), we can leverage gradient-weighted class activation mapping (Grad-CAM; Selvaraju et al. 2017) to provide post-hoc interpretation for the aspects of the image that play a pivotal role in the classification task. Figure 3 presents two Grad-CAM examples for each of the three brand-image types. As we expected, the Grad-CAM heatmaps highlight that the main features for the CNN to distinguish between brand selfies and consumer selfies are the presence of a hand and a face, respectively. Both are highlighted in warmer colors (yellow and red) on their superimposed heatmaps, showing that, contingent on these two classes, the network is highly activated by these regions.

Grad-CAMs for the three brand-image types.
We find that most user-generated images on Twitter and Instagram are packshots (excluding corporate advertising content), contributing a share of 63.35% and 68.80%, respectively (see Table 3). In addition, 28.73% (19.63%) are brand selfies and 7.93% (11.57%) are consumer selfies on Twitter (Instagram). Thus, compared with Twitter, we observe a higher share of consumer selfies but a lower share of brand selfies on Instagram, which is in line with reports of Instagram users’ increased interest in self-presentation (Sheldon and Bryant 2016). However, consumer selfies are the least prevalent category across both platforms.
Automated Text Classification
Model training
Text accompanies each image on social media in at least two ways: (1) the captions that senders add to images and (2) the comments from observers on the social media post. We use text analysis to extract information from both sources of textual data.
We measure purchase intentions from observers’ comments on the post as an indicator of brand engagement. Relative to counts of likes and comments, expressed purchase intentions such as “I want that Coke so badly!” or “Where can I buy this?” occur relatively rarely (in about 5% of the posts). Yet, they arguably represent the strongest and most favorable reaction an observer can express toward a branded product on social media.
Reliably detecting these expressed purchase intentions in the rich, yet unstructured, observer comments poses a nontrivial challenge because the classifier must grasp subtle semantic signals (Manning et al. 2020). This goal can be accomplished with large-scale natural language processing models by considering the context-dependent meaning of individual words. We employ RoBERTa (Liu et al. 2019), a state-of-the-art transformer-based language model, to text mine each post's comments (public responses by observers) and understand whether observers express interest in the brand (for details of the language-modeling approach, see Web Appendix F). The multistep purchase-intentions-classifier pipeline we built achieves a holdout classification accuracy of predicting purchase intentions of 95% (vs. a 50% random-chance baseline for the balanced holdout data), suggesting that we are able to reliably extract this fairly complex textual feature from post responses.
In addition to the observer comments to a post, we are interested in the sender captions as important controls. Specifically, we use Linguistic Inquiry and Word Count (LIWC; Pennebaker et al. 2015) to obtain the share of first-person (senders referencing themselves) and second-person (senders referencing observers) words, the share of words indicating a question, and the share of netspeak (e.g., “thx”, “lol”) out of all words in the caption to control for differences in accompanying caption text between the image types. Explicit mentions of the brand in the caption and brand tags can also drive brand engagement. We therefore also control for the number of brand tags (both hashtags and handletags) as well as occurrences of the full brand name in the caption based on a custom brand dictionary for the 185 brands in our analysis. 4 In addition, we classify the sentiment of the caption as positive, neutral, or negative by fine-tuning the RoBERTa language model on 5,304 manually annotated posts (86.1% accuracy for the three classes on 1,327 holdout observations; for details, see Web Appendix F). 5
Model interpretation
To further understand the inner workings of the language-model classifier, we employ local interpretable model-agnostic explanations (LIME; Ribeiro, Singh, and Guestrin 2016), an approach similar in spirit to the previous Grad-CAM visualizations for images. Specifically, using LIME, we can create heatmaps on texts to uncover which text features are predictive of purchase intentions. Because people use different expressions in different contexts, we demonstrate LIME based on the open responses from the controlled lab experiment reported next. In contrast to the unsolicited social media data, the lab study provides a better understanding of the actual observer objectives. The LIME results for the comment “That burger looks good. I wonder where she got it? Maybe I should ask her,” for example, show that the words “got,” “where,” and “it” are the three most predictive features of purchase intent in this comment. Individually removing these words from this sample sentence would lower the prediction probability of purchase intent from 98.5% by 49, 28, and 24 percentage points, respectively. This example illustrates how the language-model-based classifier is able to correctly classify expressed purchase intentions even if intention is not explicitly mentioned. This classification accuracy is unlikely to be attainable with a simple lexicon-based approach (Hartmann et al. 2019). Web Appendix G contains exemplary heatmaps and a detailed explanation of the LIME approach.
Relationship Between Image Type and Sender and Brand Engagement
Once we extract the image types in the post, the text-based purchase-intent measures from observers’ comments, and a host of control variables, we can relate image types to sender and brand engagement to understand the relationships among them. The three observer reactions (likes, comments, and expressed purchase intentions) serve as dependent variables and the brand-image type (brand selfie, consumer selfie, and packshot) serves as the primary independent variable. The three dependent variables are collected as count data, and their distributions indicate overdispersion. We therefore estimate negative binomial regressions (e.g., Akpinar and Berger 2017; Hughes, Swaminathan, and Brooks 2019; Ordenes et al. 2019), which result in better model fits than Poisson regressions.
Note that image types might differ in terms of the accompanying text, position and size of logos, or image quality. The large number of posts available to us enables us to control for a broad set of potentially confounding variables. These variables include image characteristics, post characteristics, sender characteristics, and brand-level fixed effects to address any brand-level heterogeneity (see Table 2). Because more than 90% of the senders had posted only a single image in our Twitter and Instagram sample (see Table 3), we are unable to statistically control for unobserved sender heterogeneity. However, we account for several sender-related variables that are directly observable. These variables include whether the sender posted multiple images to capture potential learning effects by senders, and the number of friends and followers of senders to account for the fact that more popular senders may also attract more sender engagement. Variance inflation factors among the independent variables are well below 3, suggesting that multicollinearity does not play a major role in our models.
The left side of Table 4 summarizes the results of the three regressions (with likes, comments, and purchase intentions as dependent variables, and consumer selfies as reference category) for the Twitter data set. As we expected, and consistent with other social media research (e.g., Bakhshi, Shamma, and Gilbert 2014; Li and Xie 2020), visible human faces drive sender engagement. Specifically, we observe the highest number of likes for consumer selfies compared with brand selfies (−.40, p < .01) and packshots (−.48, p < .01), with brand selfies generating more likes than packshots (p < .01; see Table 4). In terms of comments, consumer selfies outperform packshots (−.08, p < .01). Packshots also result in fewer comments than brand selfies (−.08 vs. −.01, p < .01). For consumer selfies and brand selfies, the difference in the number of comments is directionally consistent, though not statistically significant (−.01, p = .50).
Regression Results for Twitter and Instagram: Likes, Comments, Purchase Intentions.

*p < .10.
**p < .05.
***p < .01.
Indicates significant differences between brand selfie and packshot at p < .01.
Notes: Standard errors are in parentheses. Intercept is omitted from the table. (d) = dichotomous variables. Visual complexity is mean-centered. AIC = Akaike information criterion.
More importantly, we find that this pattern of likes and comments does not translate into brand engagement. Both brand selfies and packshots receive more purchase intentions relative to consumer selfies (.57 for brand selfies and .42 for packshots, both ps < .01). In addition, brand selfies generate significantly more purchase-intent comments than packshots (.15, p < .01). Although visual differences between brand selfies and packshots can be subtle, brand selfies, containing a first-person participant perspective, appear to enjoy an edge over packshots.
Our brand-engagement metric follows a pattern consistent with self-reference theory, which suggests the highest self-reference for brand selfies, due to the first-person perspective, the lowest for consumer selfies, due to facial presence, and in between for packshots. Accordingly, brand selfies have the highest levels of purchase intent and consumer selfies the lowest. These opposing results for sender engagement and brand engagement highlight a potential conflict between the objectives of UGC creators and marketers. Specifically, social media marketing practices of promoting consumer-selfie campaigns may not maximize attainable brand-engagement potential of observers (see Web Appendix A).
The impact of the control variables with clear theoretical expectations are all in the expected direction. Specifically, having more followers results in more likes and comments (.74 and .54, both ps < .01). If the sender posts more content, each individual post is less effective, receiving fewer likes and comments (−.23 and −.02, respectively, both ps < .01). More central logo positions are positively associated with purchase intentions (.50, p < .01). Interestingly, these effects reverse for likes, suggesting that salient brand logos are negatively associated with sender engagement (logo size: −.45, logo centrality: −.12, both ps < .01). Similarly, brand images with larger logos are associated with fewer comments (−.20, p < .01). These results again highlight the possible opposing effects related to sender engagement vs. brand engagement, where the sender's objective to garner popularity and virality may be misaligned with a firm's objective to achieve brand engagement.
In line with these observations related to image characteristics, textual brand salience also appears to undermine sender engagement, because brand tags are undesirable in terms of likes and comments (−.18, p < .01 and −.15, p < .01, respectively). Intuitively, including questions in the post's caption as a means for a sender to solicit a response results in more likes and comments (1.61, p < .01 and 1.21, p < .01, respectively). Interestingly, negative sentiment generates more likes and comments than posts with positive sentiment.
Because social media platforms differ in their focus on images (Schweidel and Moe 2014) and offer different proprietary image-editing technologies, it is not clear whether results generalize to other social media platforms. We therefore study data from Instagram next.
We run the same models for all three dependent variables on the Instagram data set as in the previous analysis. The right side of Table 4 presents the results. The findings largely replicate those of the Twitter analysis. Specifically, consumer selfies receive more likes than both brand selfies and packshots (.25, p < .01 and .26, p < .01, respectively). For the number of comments, we also find directionally similar results across both platforms, with consumer selfies outperforming both brand selfies and packshots (−.17, p < .01 and −.22, p < .01, respectively). Whereas on Twitter the difference between consumer selfies and brand selfies is not statistically significant, it is significant on Instagram.
Consistent with the Twitter analysis, brand selfies receive more purchase intentions than consumer selfies with visible faces (.53, p < .01). This difference also manifests between brand selfies and packshots (.12, p < .01), again replicating our Twitter findings.
Although Twitter and Instagram are very different social media environments, we find consistent results for both platforms. Whereas brand selfies outperform consumer selfies in terms of brand engagement (expressed purchase intentions) in theoretically meaningful and practically relevant ways, commonly used and readily available count metrics such as likes and comments indicate lower levels of sender engagement.
Robustness Analyses
In addition to the models reported so far, we estimate various alternative models. First, we add correlated random effects between the three regressions to account for possible unobserved relationships between dependent variables. Second, we modify our previous count measures of purchase intent and compute the share of comments that express a purchase intention (for all posts with one or more comments). Both alternative models result in similar qualitative and statistical conclusions (for details of these robustness analyses, see Web Appendices H and I).
Furthermore, to investigate the robustness of the results across product categories, we split the brands into two main categories, beverage and food brands, and estimate separate models for each category. Results are consistent across both categories and each is consistent with the aggregate analysis, suggesting that our findings are not driven by category peculiarities (see Web Appendix J).
Negative-sentiment captions might reflect systematically different types of posts (e.g., firestorms) that may be accompanied by systematically different images and might also generate different reactions. Although our main analysis controls for the caption sentiment (positive, negative, or neutral), we investigate the robustness of our results by estimating all models excluding posts with negative captions (11.32% and 3.92% of the posts for Twitter and Instagram data sets, respectively). We find that the results are robust to removing these negative posts (for details, see Web Appendix K).
The Role of Self- Versus Other-Thoughts
Recall that self-reference, as a driver of brand engagement, builds on (1) the visibility of the brand and (2) mentally simulated observer actions related to what is visible in the image. Because consumer selfies feature the face of a (familiar) social media user, they are likely to inhibit self-thoughts and promote more other-thoughts than brand selfies and packshots. To empirically investigate this process, we analyze whether observers write more about themselves (vs. others) in the comments corresponding to consumer selfies than in comments corresponding to brand selfies and packshots.
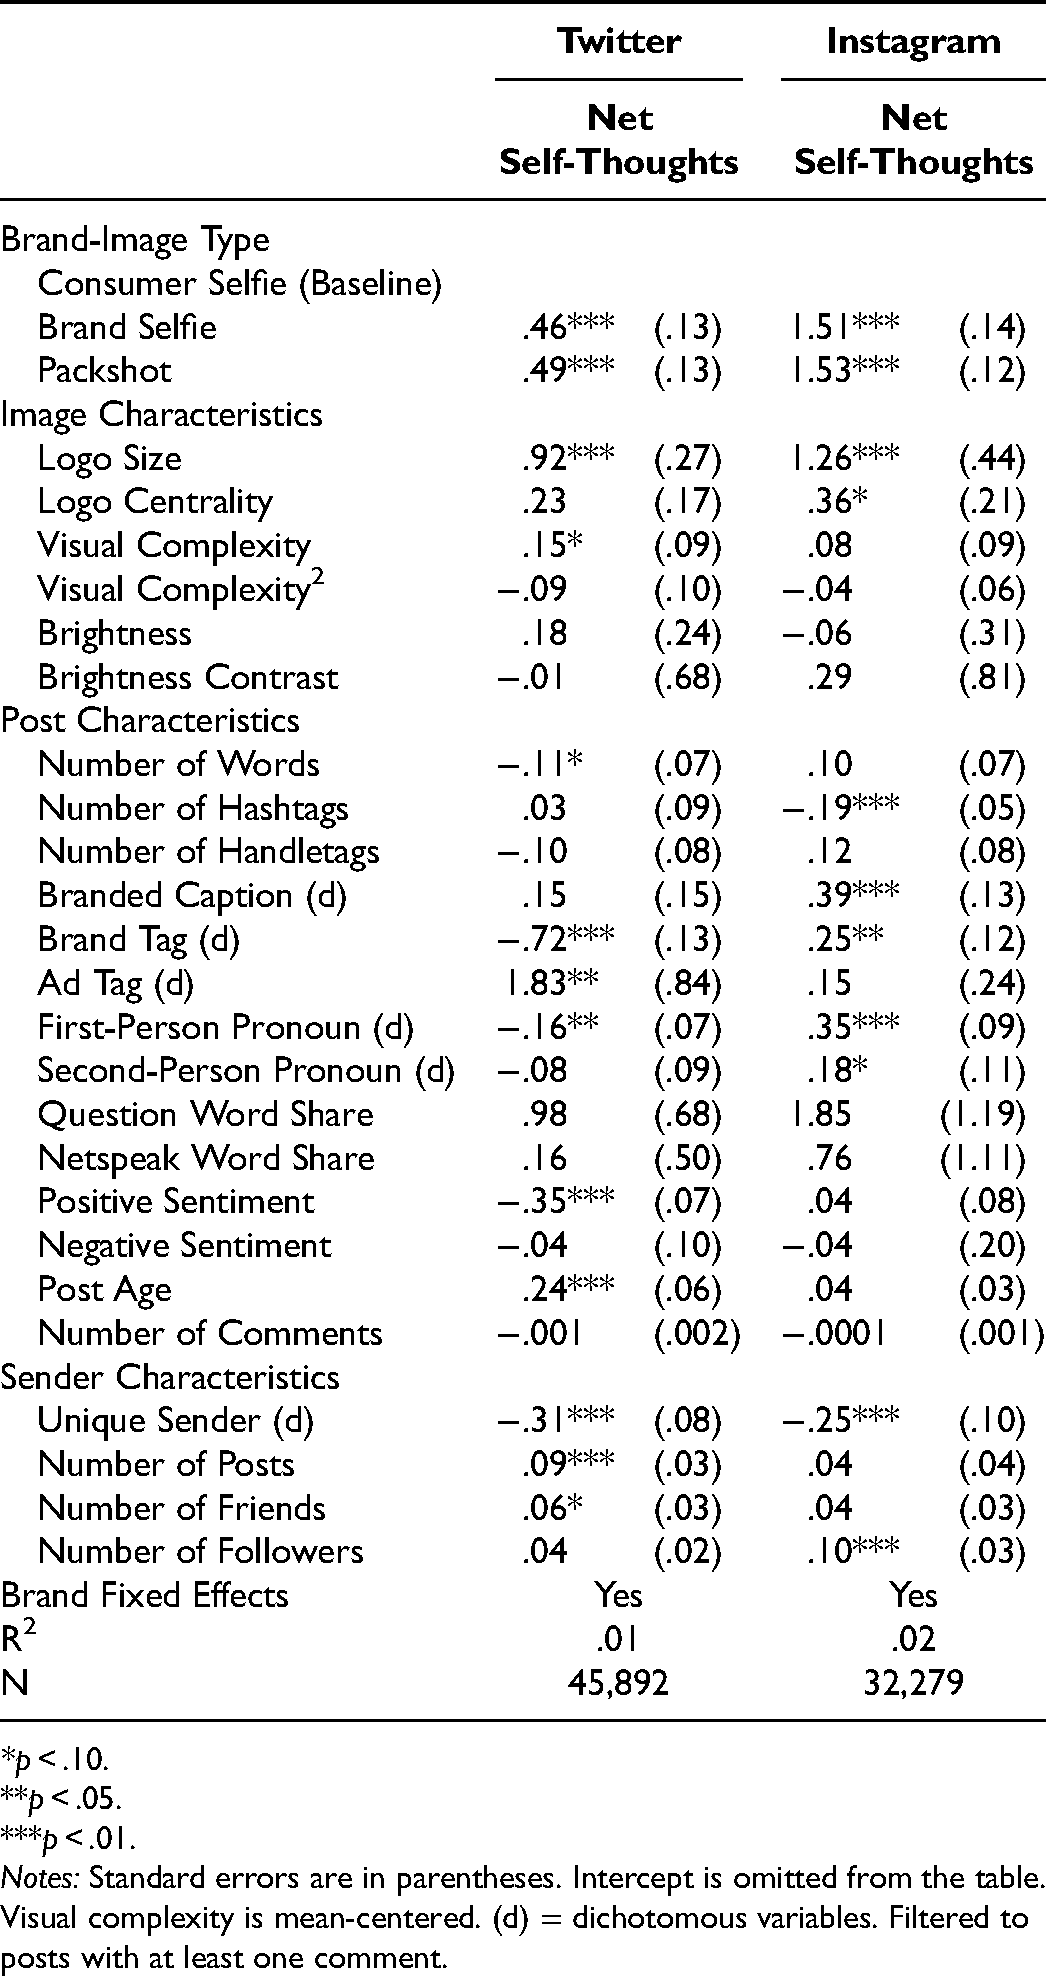
In line with the analysis of the posts’ captions, we compute the share of self-related words in a comment (I-words from the LIWC dictionary; Pennebaker et al. 2015) and the share of other-related words in a comment (you and she/he words from the LIWC dictionary). We use the difference between these two shares as an indicator of relative self-thoughts. Note this measure does not reflect whether the brand on the image is explicitly mentioned (which would overlap with our primary dependent variable of purchase intentions). Consistent with the purchase-intention analyses, the unit of observation is a sender post. That is, we average over all observer comments that relate to a sender post. Because the net self-thoughts metric is continuous, we estimate a linear regression with net self-thoughts as the dependent variable and the three brand-image types as independent variables (brand selfie and packshot, with consumer selfie as a reference category) while including the same set of control variables as in our previous analyses (see Table 5).
Regression Results for Twitter and Instagram: Net Self-Thoughts.
*p < .10.
**p < .05.
***p < .01.
Notes: Standard errors are in parentheses. Intercept is omitted from the table. Visual complexity is mean-centered. (d) = dichotomous variables. Filtered to posts with at least one comment.
Across both platforms, as we expected, brand selfies receive more self-related observer comments than consumer selfies (Instagram: 1.51, p < .01; Twitter: .46, p < .01). Interestingly, packshots also receive more self-oriented comments than consumer selfies, suggesting the sender's face is indeed what shifts self- versus other-thinking (Instagram: 1.53, p < .01; Twitter: .49, p < .01). Packshots and brand selfies, which do not contain a visible face, have similar values of net self-thoughts. Although one may expect higher self-thoughts for brand selfies than for packshots, due the first-person point of view, recall that our text-based measure of self-thoughts is not related to any brand-specific thoughts. Consequently, it does not indicate whether brand selfies generate higher levels of self-reference with respect to the brand. We investigate this issue more directly by employing established self-reference scales in the lab experiment.
Before studying the causal impact of selfie images using controlled lab experiments, we use data on CTRs for display ads to investigate whether our results generalize outside the social media context.
Display Advertising CTRs
Social media data are often limited with respect to individual-level lower-funnel actions (Moe and Schweidel 2017). Although our measure of purchase intent is useful and has provided interesting insights, it is not based on actual brand-directed actions of observers. Thus, in this section we investigate whether the brand-engagement patterns for selfie images generalize to actual CTRs for display advertising. Specifically, we study display ads in a more utilitarian domain (electronic handheld products) than the product categories used in the social media analyses.
We test the relationship between image type and display ad CTRs (i.e., the ratio of all consumers clicking on an ad divided by the total number of ad impressions) by partnering with a leading content discovery platform that distributes ads on various publisher sites and tracks audience behavior. We use CTR as the primary dependent variable because it is one of the most commonly used and important metrics to track the performance of online advertising (Aribarg and Schwartz 2020; Johnson, Lewis, and Nubbemeyer 2017; Melumad and Meyer 2020).
The data we obtained include the display ad itself, platform type (desktop, tablet, or smartphone), an advertiser and country identifier, and the accompanying ad caption. Table 2 contains an overview of all variables and their descriptions, and Table 3 summarizes the actual data. Our observations are based on 622 ads (unique image–text combinations) of handheld consumer electronics products (e.g., USB sticks, wireless headphones) from 141 advertisers published across 58 countries, resulting in 2,255 ad-platform-country combinations (campaigns).
All ads were manually annotated by a research assistant who coded both (1) the image type (i.e., brand selfie, consumer selfie, or packshot) and (2) the location (i.e., the bounding box) of the product in the image. The display-ad data set includes a high share of brand selfies (72.68%) with 18.80% consumer selfies and 8.51% packshots. Note that in consumer electronics advertisements with short-term transaction objectives, the product itself is often the center of attention, but the brand is obviously also prominently mentioned in all ads (for representative sample ads across the three brand-image types, see Web Appendix L).
We test the impact of the image archetypes on ad response by estimating a linear regression with logit-transformed CTR as the primary dependent variable to account for CTR being bound between 0 and 1. To control for advertiser heterogeneity and country-specific effects, we include crossed random effects for advertiser and country. In addition, we control for the platform fixed effects (mobile, tablet, or desktop), the number of impressions per campaign, and a similar set of controls as in the Twitter and Instagram analyses (see Table 3).
Table 6 reports the regression results. Consistent with the expressed-purchase-intention results from the UGC data sets, brand selfies outperform consumer selfies in terms of CTR (.12, p < .05). A postestimation analysis reveals that this finding translates into a sizable CTR uplift of approximately 13% for brand selfies relative to consumer selfies. Although brand selfies have higher CTRs than packshots, the difference is not statistically significant, nor is the difference between consumer selfies and packshots (ps >.05).
Regression Results for Display Ads: CTR.

*p < .10.
**p < .05.
***p < .01.
Notes: Standard errors are in parentheses. Intercept is omitted from the table. (d) = dichotomous variables. Visual complexity is mean-centered. Crossed random effects for advertisers and countries. AIC = Akaike information criterion.
The insignificant difference between packshots and the two selfie images is consistent with the intermediate position of packshots in terms of self- and brand-related thoughts as well as ads featuring unknown faces with lower levels of self-reference inhibition. More importantly, the statistically significant difference between the two selfie images suggests that effect sizes can vary, but self-reference remains a useful theoretical model beyond social media posts and (hedonic) fast-moving consumer goods. In line with the social media data, brand selfies are superior to consumer selfies. The pattern of results is not limited to verbal expressions of purchase intentions but extends to actual behavioral outcomes (i.e., ad clicks). The field data and analyses presented thus far are useful because of their external validity, the number of observations, and the diversity in images, product categories, brands, and platforms.
However, we cannot rule out that potential selection effects may play a role. For the social media data, the audience of more popular senders may be more interested in the sender than in any visible brand. If popular senders are aware of this possibility, they may choose to post more consumer-selfie images, which in turn might be correlated with lower brand engagement because the popular sender face might distract even more than any other face. Similarly, display ads are selected and optimized on the basis of expected CTRs. We attempt to control for possible selection effects in our models by including measures of sender popularity (number of followers) and sender activity (e.g., number of posts, friends) and accounting for advertiser-level heterogeneity in the display-ad analysis. To control for selection biases and other possible confounds more comprehensively, we turn to an experimental setting with random assignment of image types and minimal differentiation between images beyond the image type itself.
Experimental Evidence on the Causal Effect of Image Type and the Underlying Mechanisms
In addition to the main objective of establishing causality, the experimental setting allows us to collect conventional survey measures of self-reference and purchase intent to study the self-reference mechanism in more detail. With regard to purchase intent, our language model–based approach achieved high levels of accuracy relative to human interpretation of the comments. However, it can still contain measurement error in terms of actual behavioral intentions. Furthermore, social media users may decide not to make brand-related comments for reasons other than a lack of brand interest (e.g., not commenting at all or responding to other non-brand-related topics). To investigate whether a more direct measure of purchase intent leads to different conclusions, we test the impact of image types on both the text mining of the comments and a traditional survey–based measure of purchase intent.
Method
Experimental design
We recruited N = 750 panelists from Amazon’s Mechanical Turk (46% female, 53% male, 1% prefer not to say; mean age: 39.6 years), who were randomly assigned to one of three between-subject experimental conditions that we constructed based on Elder and Krishna (2012). Specifically, we adapted the design of Elder and Krisha (2012) to distinguish between the two selfie types and adapted images to the social media setting. This resulted in three artificial stimuli of Instagram social media posts, showing a burger in a consumer selfie, a brand selfie, or a packshot view, holding constant image size as well as centrality and size of the burger in the image (see Figure 4). We selected the consumer selfie based on a pretest (N = 420) of 14 alternative consumer-selfie images to ensure high burger prominence and average sender attractiveness, to limit the possible effect of sender prominence or attractiveness.

Controlled stimuli for the lab experiment.
To measure brand prominence, we asked subjects to rate the subjective prominence of the burger (“The burger on the image is very prominent”; seven-point scale). Across conditions, the burger was perceived as comparable in prominence between the packshot and the brand-selfie images (Mbrand selfie = 6.15, Mpackshot = 5.98; p = .12) but significantly lower for the consumer selfie (Mconsumer selfie = 5.83; p < .05). In line with theory, the lower product prominence for the consumer selfie may suggest that a face being present diverts attention away from the brand even when the actual position and size of the product remains identical.
Procedure
Respondents first indicated their level of social media activity in general and their usage of different social media platforms. To mimic actual behavior on social media, we created an Instagram online environment and showed participants a short simulation of unrelated Instagram posts asking them to imagine how they use their social media accounts. Respondents who failed an attention check asking them about the platform they had just seen were not permitted to participate. To simulate a minimum level of connection with the (unknown) sender, we provided personal details about the persona of the post.
Subjects were then randomly assigned to one of the three between-subjects experimental conditions and were asked an open-ended question to write a comment they would make to this post (see Figure 4). Afterward, respondents were asked how likely they would be to like and respond to the post in an actual social media setting. We assessed purchase likelihood with three items on seven-point scales following Escales (2007) (Cronbach's alpha = .96; see Web Appendix M). Next, subjects rated self-reference on a five-item seven-point scale (Escalas 2007; Meyers-Levy and Peracchio 1996) with a Cronbach's alpha of .94. We compute the averages of both the purchase-intent and self-reference scales as our measures of these constructs. The study concluded with control measures on perceived prominence of and attention to the burger, typical fast-food consumption, and demographics including the dominant hand of the respondent. Web Appendix M contains a full overview of all questions, operationalizations, and mean values.
Results
Main effects
Presumably due to the artificial setting and the difficulty of mimicking social response to an unfamiliar sender in a lab setting (Eckles, Karrer, and Ugander 2017), both the likelihood of liking (ranging from Mpackshot = 4.61 to Mbrand selfie = 4.94; p = .16) and commenting (ranging from Mpackshot = 3.68 to Mbrand selfie = 4.03; p = .12) do not differ significantly between experimental conditions. Thus, we find that hypothetical sender engagement does not replicate what we observe in the field.
More importantly, consistent with the field data, we find that stated purchase intent is highest for the brand-selfie image and significantly different from both the consumer-selfie image (Mbrand selfie = 5.21, Mconsumer selfie = 4.81; p < .05) and the packshot image (Mpackshot = 4.65; p < .05), the latter replicating Elder and Krishna (2012). This finding is in line with the predictions based on self-reference theory and our previous findings on social media purchase intent. However, we do not find statistically significant differences in purchase intent between the packshot and consumer-selfie images (p = .35), possibly because the visible sender in the experiment was a stranger to experimental subjects.
To investigate the relationship between image type and stated purchase intent, we run a multiple regression with brand selfie and packshot as dummy variables (consumer selfie as reference category), controlling for the amount of fast-food consumption, overall social media activity, and the dominant hand of experimental subjects. Findings are consistent with the mean comparison (βbrand selfie = .35, p < .05; βpackshot = −.20, p = .21). The difference between brand selfies and packshots is also statistically significant (p < .01).
Validation of the purchase-intention classifier
To investigate the validity of the purchase-intention classifier used in the social media analyses, we apply the same language model to the comments of the experimental subjects and compare it with the corresponding stated purchase intention. Out of 163 purchase intentions predicted by the language model, only 9 (5.5%) did not have a purchase intent above the scale midpoint (precision of 94.5%). Similarly, the mean purchase likelihood is substantially and significantly higher for comments that were detected as having purchase intent versus comments that do not contain intent (presence of purchase intent: Myes = 6.17, Mno = 4.48; p < .01), suggesting that our previous measure of social media purchase intentions is consistent with conventional self-reported ratings.
Self-reference as an underlying mechanism
We perform a mediation analysis on both brand-image dummy variables with consumer selfies as the reference category to examine the psychological mechanism behind the influence of image types on purchase intent. Compared with the consumer-selfie image, the brand-selfie condition elicits significantly higher degrees of self-reference (βbrand selfie = .51, p < .01). Similarly, the brand-selfie condition elicits significantly higher self-reference than the packshot (p < .01). In line with the purchase-intent findings, the difference between packshots and consumer selfies is not statistically significant (p = .84). Again, the fact that subjects were not familiar with the sender’s face may have resulted in fewer other-related experiences coming to mind.
Higher self-reference, in turn, leads to a higher likelihood of buying (βself-reference = .95, p < .01). In addition, when controlling for self-reference, the direct effects of both image types on the likelihood of buying are reduced and are not statistically significant (βbrand selfie = −.09, p = .38; βpackshot = −.13, p = .21), suggesting that the impact of brand-image perspectives is mediated by self-reference (for full details of the mediation analysis, see Web Appendix N). The statistical test based on 1,000 bootstrapping iterations to obtain standard errors for the (nonnormal) indirect effect of brand selfies (Preacher and Hayes 2008) also indicates mediation (confidence interval: [.22, .75], p < .01). A Wald test on the path coefficients further confirms that the total effects of brand selfies are also statistically different from the effects of packshots (χ(1) = 13.8, p < .01). Adding self-reports of attention to the burger to the regression (βattention = .09, p < .05) does not change our results significantly, suggesting that self-reference drives purchase interest over and above mere attention.
Overall, compared with brand selfies, consumer selfies and packshots seem less effective in stimulating self-referent thoughts of consuming the product. These lower self–brand connections result in lower levels of brand engagement in terms of purchase intentions.
Discussion
The findings of the experiment add to the previous field evidence in two important ways. First, they suggest that the differences in observers’ reactions to brand selfies versus consumer selfies and packshots are not due to selection effects but remain robust under random assignment. When holding image composition as well as sender characteristics and captions constant, we still find that brand selfies result in higher levels of purchase likelihood than packshots and consumer selfies. Theoretically, communication intent is lower when the sender of the images is a stranger to respondents. This fact might have inhibited actual social motives with regard to likes and comments and may also have made the packshot and consumer selfie more comparable in terms of self-reference and purchase intent in the experimental setting relative to the field data.
Second, we find evidence of self-reference mediating the impact of selfie images on brand engagement. This indirect effect is directionally robust to alternative dependent variables (purchase-intent rating as well as purchase intent inferred from social media comments). The consistency between purchase-intent ratings and intentions extracted from comments provide further evidence that public social media comments are useful to study brand engagement.
To relate to the self-reference literature, the design of this experiment was based on prior studies of Elder and Krishna (2012) that were unrelated to branding, resulting in a presentation of a product without a dominant brand logo and a clean background, which may be less typical of social media images. We conducted another experiment that allowed us to investigate whether these limitations matter and to test another product category. More closely following the actual field data, this experiment involved a bottle with a big logo of an unknown aloe vera drink and a realistic background (see Web Appendix O). The rest of the experimental design is identical to the aforementioned experiment, with N = 450 experimental subjects being randomly assigned to the three experimental conditions. We again find that purchase intentions are higher for the brand-selfie condition relative to the consumer-selfie condition (Mbrand selfie = 3.99, Mconsumer selfie = 3.47, p < .05), with self-reference fully mediating the effect (βself-reference = .08, p < .01, confidence interval: [.07, .10]).
Conclusion
Social media activities have become an essential component of the marketing mix, with investments totaling 90 billion USD per year and likes being considered a “badge of honor” for social media marketing (Colicev 2021, p. 2). This article investigates and structures the wealth of user-generated brand imagery. Employing transfer-learning algorithms for visual UGC, we identify three types of brand images: consumer selfies, brand selfies, and packshots. In our discussions with practitioners, this mere taxonomy of splitting social media images into the two selfie types and packshots was considered valuable, with our identification of a new branding social media phenomenon—brand selfies—being particularly useful.
Across multiple analyses and data sources involving two different social media platforms, a display-advertising platform, and controlled lab experiments, we consistently find that images from consumers taking a selfie of the brand itself (brand selfies) are most effective at promoting brand engagement. We measured brand engagement via text mining of user-generated text comments, CTRs on display ads, and survey-based stated purchase intentions (for a summary, see Table 1). Using mediation analysis, we show that these findings are consistent with self-reference theory (i.e., image cues triggering mental simulation of brand encounters).
The number of likes that social media marketing often attends to as a measure of engagement paints a different picture. Consistent with previous findings that faces are especially engaging on social media (Li and Xie 2020), we find that consumer selfies generate the highest levels of sender engagement in terms of likes. However, because faces trigger interpersonal communication as opposed to mental simulations of brand consumption (To and Patrick 2021), these sender-directed communications do not translate into actual brand interest. Specifically, a postestimation analysis using the models reported in Table 4 reveals that consumer selfies obtain 49% (28%) more likes than brand selfies on Twitter (Instagram), but by contrast, brand selfies receive 78% (70%) more expressed purchase intentions. We encourage social media marketers to go beyond the easy-to-collect measures of counting likes and comments and employ text-analysis methods to study actual brand engagement.
Practical Implications
Several firms launched campaigns and encouraged consumers to take consumer selfies (e.g., Lay's packaging, Coke selfie bottle; see also Web Appendix A). In contrast, we could not find a single social media campaign explicitly encouraging brand selfies. Depending on the brand objectives, social media marketing may benefit from revised strategies that focus on first-person perspectives of products in use. Campaigns such as the marketing challenges by Starbucks’ #redcupcontest or Corona beer's #findyourbeach are not directly geared at brand selfies but did result in various consumer-generated images that center on the brand as opposed to consumer faces. For example, the #redcupcontest has resulted in more than 50% more brand-selfie posts on Instagram relative to the proportion of brand selfies in our sample of 185 brands. In spirit of the Lay's packaging that encourages consumer selfies, firms could even explore package designs to promote brand selfies and stimulate consumers to show the product in their hand (for examples of such designs, see Web Appendix P).
Descriptively, we found three times more brand-selfie than consumer-selfie images on Twitter and about twice as many on Instagram (see Table 3). Apparently, consumers are more inclined to post brand selfies than consumer selfies. This finding suggests that brand-selfie campaigns may achieve both more image posts and higher brand engagement by observers for each of these posts. However, we do caution that brand-selfie campaigns may not be in line with consumers’ own objectives to generate likes and comments on social media. According to our analysis, consumer selfies are a better choice for social media users interested in generating likes and comments. Thus, the firm's objective to garner brand engagement and the sender's objective to generate reach and sender engagement may not be aligned. Accordingly, social media marketers may have to adequately incentivize consumers to participate and act in line with the firm's objectives.
To single out the effect of image type on engagement, we controlled for differences in image composition (either with covariates or by means of experimental manipulation) and found an impact of brand selfies on brand engagement above and beyond a host of controls for alternative explanations such as logo size and centrality. Thus, the effect of subjective brand-image perspectives and objective logo salience are additive rather than substitutive. However, from a managerial perspective, consumer posts of brand selfies are likely to contain larger brand logos at more central positions simply due to physical constraints. Thus, brand-selfie images likely generate even higher total effects of brand engagement than evidenced by our controlled analysis.
Brands are often interested in social media brand tracking (“social listening”; Liu, Dzyabura, and Mizik 2020). Our work belongs to the very limited but rapidly growing interest in automated image analysis in marketing (Dzyabura and Peres 2021; Liu, Dzyabura, and Mizik 2020). Tracking visual brand appearances is a natural complement to text tracking. Unlike text tracking, image tracking does not suffer from issues such as misspellings, brand homonyms (e.g., Corona), or missing out on relevant brand-logo appearances. Available commercial services allow firms to detect logos on images as well as their position. However, we demonstrate that simply counting logo appearances may not adequately capture what is relevant to consumers. The context in which a brand appears (e.g., with a face or a hand) matters. Combinations of deep learning–based image classification, (interpretable) machine learning, and language model–based text mining can help reliably identify which brand appearances matter to consumers and which are most likely to result in valuable brand engagement.
Theoretical Implications
From a theoretical point of view, our multimethod approach provides field evidence based on large-scale social media data that self-reference effects have important implications outside of the lab context. The experimental evidence and net self-thought measure inferred from social media comments indicated that consumer selfies inhibit self-related thoughts. However, our insights into the underlying psychological mechanisms remain limited and can be studied in more detail. Such investigations would be useful especially with regard to consumer selfies because these have not received much attention in self-reference research so far. With the growing importance of social media, differences between selfie images appear to be a promising area for self-reference research to explore.
Of course, there are also limitations to this research. Most importantly, the observational data on social media and advertising could not fully control for potential selection effects. That is, senders with different types of audiences may post different combinations of image types. Two controlled lab experiments suggest that selection effects are not the main driver behind the brand-engagement differences. However, we caution that self-selection may still have played a role in the observational data. Future research on senders with a larger number of posts could study self-selection by examining the variation of image types within a sender, thus controlling for the sender's audience. Our data set included a limited number of posts per sender and did not permit such within-sender analyses.
Further research might also elaborate on the sender's perspective, the motivations of sharing product-related content, and its impact on subsequent sender behavior. For example, Grewal, Stephen, and Coleman (2019) suggest conditions under which posting identity-relevant content can inhibit subsequent purchase intentions. In addition, if brand images are taken during consumption, they might influence the sender's enjoyment of the experience itself (e.g., Barasch, Zauberman, and Diehl 2018). Because the downstream consequences can be noteworthy, an investigation into sender motivations and their choice of brand-image types appears promising.
In terms of multimedia content, our typology of brand images is conceptually applicable to video content and augmented reality contexts as well (e.g., Petit, Javornik, and Velasco 2021). Conceivably, the difference in perspectives (participant vs. observer) plays an even stronger role in moving images because brand-related mental simulation may be stimulated more effectively. In addition, videos and the types of image carousels that social media increasingly features allow for changing perspectives across (moving) images. Our (static) images had only a single perspective per post; thus, we could not study potential dynamics of changing perspectives. Videos or image carousels might attain the best of both worlds, that is, engage with visible faces while also triggering brand-related self-reference with subsequent ego perspectives.
Lastly, we focused on 185 brands across ten handheld beverage and food product categories. Selfie effects (brand selfie vs. consumer selfie) were consistent between beverages and food products and also replicated for display ads in a utilitarian domain (handheld consumer electronics), suggesting that self-reference is a useful theory with broad applications. An exploration of whether these findings generalize beyond these domains would be interesting (e.g., beauty products for which the model's face is essential to illustrate product benefits or digital services made tangible by a smartphone display).
In summary, this article provides a first step toward exploring the plethora of user-generated brand imagery posted on social media. We demonstrate the value of identifying relevant brand-image types and their respective impact on consumer behavior. Selfies are here to stay as a cultural phenomenon and a prevalent component of social media, but they are also a matter of perspective. We still have much to learn about how seeing brands through the eyes of others relates to information processing and how self-reference drives brand perception and brand engagement. We hope our work stimulates further research on the relationships between brand selfies and brand success.
Supplemental Material
sj-pdf-1-mrj-10.1177_00222437211037258 - Supplemental material for The Power of Brand Selfies
Supplemental material, sj-pdf-1-mrj-10.1177_00222437211037258 for The Power of Brand Selfies by Jochen Hartmann, Mark Heitmann, Christina Schamp and Oded Netzer in Journal of Marketing Research
Footnotes
Acknowledgments
The authors thank Gita Johar and Don Lehmann for helpful discussions; Rachel Zalta and Andres Salazar from Taboola for their data contribution; Thilo Hüllmann, Florian Brinkmann, Tim Werner, and Peter Goeke for sharing their industry expertise; Julia Lenk, Mirijam Görick, Ksenija Sinovitsch, and Linus Bemmer for their tireless research assistance; and Amos Schikowsky for his invaluable programming support. Lastly, the authors thank Constanze Knupfer, Katarina Ilic, and Christian Spadt for their hands-on assistance in the experimental studies. The project is part of the first author's doctoral dissertation, who is grateful to the members of his dissertation committee, Mark Heitmann, Henrik Sattler, Martin Spindler, and Oded Netzer.
Associate Editor
Randolph Bucklin
Declaration of Conflicting Interests
The author(s) declared no potential conflicts of interest with respect to the research, authorship, and/or publication of this article.
Funding
The author(s) disclosed receipt of the following financial support for the research, authorship, and/or publication of this article: This work was supported by the German Research Foundation (DFG) (grant number HE 6703/1-2).
Notes
References
Supplementary Material
Please find the following supplemental material available below.
For Open Access articles published under a Creative Commons License, all supplemental material carries the same license as the article it is associated with.
For non-Open Access articles published, all supplemental material carries a non-exclusive license, and permission requests for re-use of supplemental material or any part of supplemental material shall be sent directly to the copyright owner as specified in the copyright notice associated with the article.