
Abstract
We localized SERCA pumps to the inner region of alveolar sac membranes, facing the cell interior, by combining ultrastructural and biochemical methods. Immunogold labeling largely predominated in the inner alveolar sac region which displayed aggregates of intramembrane particles (IMPs). On image analysis, these represented oligomeric arrangements of ∼8-nm large IMP subunits, suggesting formation of SERCA aggregates (as known from sarcoplasmic reticulum). We found not only monomers of typical molecular size (∼106 kD) but also oligomeric forms on Western blots (using anti-SERCA antibodies, also against endogenous SERCA from alveolar sacs) and on electrophoresis gelautoradiographs of 32P-labeled phosphoenzyme intermediates. Selective enrichment of SERCA-pump molecules in the inner alveolar sac membrane region may eliminate Ca2+ after centripetal spread observed during exocytosis activation, while the plasmalemmal Ca2+ pump may maintain or reestablish [Ca2+] in the narrow subplasmalemmal space between the outer alveolar sac membrane region and the cell membrane. We show for the first time the microzonal arrangement of SERCA molecules in a Ca2+ store of a secretory system, an intensely discussed issue in stimulus-secretion coupling research.
This work examined the possibility of microdomain regulation of cortical Ca2+ concentrations [Ca2+], a frequently debated issue in current literature on stimulus-secretion coupling (see below). In many cells, the endoplasmic reticulum (ER) forms a vast Ca2+ store (Pozzan et al. 1994). A special form is the sarcoplasmic reticulum (SR) of muscle cells (Franzini-Armstrong and Jorgensen 1994), with well-known activation and Ca2+ release mechanisms (Franzini-Armstrong and Protasi 1997). Less well analyzed cortical Ca2+ stores are involved in exocytosis regulation in a variety of systems (Burgoyne 1991; Pozzan et al. 1994; Berridge 1997; Golovina and Blaustein 1997; Parekh and Penner 1997). Although different mechanisms of Ca2+ release have been established, the mechanism of crosstalk with the cell membrane for intensification by subsequent capacitative or store-operated Ca2+ influx is a matter of considerable debate (Berridge 1997; Parekh and Penner 1997; Barritt 1998). In principle, as with the SR, one has to propose a close association of such Ca2+ stores with the cell membrane, the presence of high capacity/low affinity Ca2+ binding proteins (CaBPs), of Ca2+ release channels, and of a Ca2+ pump of the SERCA type (SR/ER Ca2+-ATPase) (Pozzan et al. 1994). However, the functional and structural coupling of Ca2+ stores involved have hardly been characterized, and even the structural equivalent of such Ca2+ stores is difficult to identify in most cases, a most challenging gap in our understanding of Ca2+ homeostasis.
In the ciliated protozoan Paramecium tetraurelia, alveolar sacs underlie the somatic cell membrane (Figure 1), i.e., the nonciliary cell body, except for regions at which cilia emerge and dense-cored secretory organelles (trichocysts) are attached in a distinct pattern for rapid exocytosis (Allen 1988). Both the cilia and docked trichocysts, closely flanked by alveolar sacs, are targets of Ca2+ stimulation [see Hinrichsen et al. (1995) for a review of the functions of Ca2+ and calmodulin in Paramecium]. Isolation studies allowed unequivocal identification of alveolar sacs as Ca2+ stores (Stelly et al. 1991), as confirmed by high-resolution in situ element analysis (Knoll et al. 1993). Like SR, alveolar sacs contain a calsequestrin-type CaBP (Plattner et al. 1997b) and a SERCA-type Ca2+ pump (Stelly et al. 1991; Länge et al. 1995; Hauser et al. 1998; Kissmehl et al. 1998), but the release mechanism remains ill-defined (Länge et al. 1995; Zhou et al. 1995).
Alveolar sacs are periodically arranged as distinct structural entities. The area facing the outside, i.e., the cell membrane (outer membrane region of alveolar sacs; OM-AS) is connected to the cell membrane by protein links, maintaining a subplasmalemmal space of ∼15 nm (Plattner et al. 1991), thus resembling smooth (Somlyo and Franzini-Armstrong 1985) or striated muscle (Franzini-Armstrong and Jorgensen 1994; Franzini-Armstrong and Protasi 1997). On exocytosis stimulation, in Paramecium internal Ca2+ concentration ([Ca2+]i) increases in the cell cortex, first by alveolar sac store mobilization and then by storeoperated influx of external Ca2+ (Erxleben and Plattner 1994; Erxleben et al. 1997; Klauke and Plattner 1997). As would be expected, the plasmalemmal Ca2+-ATPase of Paramecium is stimulated by Ca2+/calmodulin (CaM) (Wright and Van Houten 1990; Smith and Hennessey 1993), whereas the SERCA pump of alveolar sacs is CaM-insensitive (Stelly et al. 1991; Kissmehl et al. 1998). This is in agreement with recent cloning of these two types of Ca2+ pumps from Paramecium (Elwess and Van Houten 1997; Hauser et al. 1998) and reflects the situation in higher eukaryotic systems (Raeymaekers and Wuytack 1996).
Interestingly, alveolar sacs closely resemble skeletal muscle SR in different ways (Länge et al. 1995). In the SR, Ca2+ release channels and Ca2+ pumps are differentially localized (Franzini-Armstrong and Jorgensen 1994; Pozzan et al. 1994; Franzini-Armstrong and Protasi 1997) and SERCA molecules may form aggregates (see Discussion), just as we show here for the alveolar sac system. In Paramecium, a [Ca2+]i transient generated by stimulation is rapidly attenuated as it sweeps centripetally (Klauke and Plattner 1997). The Ca2+ pump found in alveolar sacs has different kinetic properties from those of the plasmalemmal pump and also has differential localization. As we show below, the SERCA pump found on the inner alveolar sac membrane region (IM-AS) faces the inner region of the cell. The regular arrangement of subplasmalemmal Ca2+ stores in Paramecium, in close association with structurally well-defined targets, e.g., regularly spaced exocytosis sites, enabled us for the first time to address the question of microzonal arrangement. The arrangement we found may allow the cell to cope with specific requirements in specific microdomains.
Materials and Methods
Cell Cultures
Paramecium tetraurelia wild-type cells, strain 7S, were cultivated as described (Plattner et al. 1997a,b).
Biochemical and Immunochemical Analyses
AS fractions were prepared according to Stelly et al. (1991), and were used for SDS-PAGE (5−10% gels, 35 μg protein/lane), Western blots, and SERCA phosphoenzyme intermediate analysis precisely as specified elsewhere (Hauser et al. 1998). Briefly, samples were incubated for 15 min at 0C with 3 nM [γ−32P]-ATP (16 × 1010 Bq/mol) as described. Some of these analyses were preceded by protein crosslinking using alveolar sacs (2.4 mg protein/ml) in 30 mM imidazole-HCl buffer, pH 6.8, containing 100 mM KCl and protease inhibitors, i.e., 10 μM E64 (Biomol; Hamburg, Germany) and freshly dissolved 280 μM phenylmethylsulfonylfluoride (Sigma; Deisenhofen, Germany). To alveolar sac samples, a 10-fold larger volume of crosslinker (EGS; ethylene-glycol-bis-[succinimidylsuccinate], 100 μM; Pierce, Rockford, IL) in DMSO (1% final concentration) was added for 10 or 30 min at 4C. This allows 32P labeling of the phosphoenzyme intermediate of the SERCA pump under conditions specified above and in more detail by Kissmehl et al. (1998), while any effects of contaminating proteases are kept minimal. Crosslinking was stopped by reaction with 100 μM glycine in imidazole buffer (30 min, 4C). Samples were only briefly mixed with SDS and not boiled, but rapidly applied to SDS-PAGE gels, to facilitate visualization of oligomeric SERCA forms (see Discussion). Gel autoradiography was done as described previously (Kissmehl et al. 1998), using Amersham Hyperfilm-MP in Kodak X-Omatic cassettes with an intensifier screen for $1 day at −70C. More extensive radioactive labeling studies with Paramecium cell surface proteins, with or without EGS treatment, served as controls because they revealed crosslinking selectively of densely packed proteins, like surface variant antigens, whereas other membrane proteins were not affected (unpublished observations).
Immunolocalization by Confocal Laser Scanning Microscopy
Methods applied and antibodies (Abs) against the PtSERCA peptide used were precisely as specified by Hauser et al. (1998). Incubation with primary Abs was followed by FITC-coupled secondary Abs.
Ultrathin Section Immunogold Labeling
Two widely different preparation protocols, using either low temperature Unicryl embedding or cryosections (Griffiths et al. 1984), and two different Abs were used (see below).
Fixation and Preparation of Sections. Cells were fixed for 1 hr at 20C in 4% formaldehyde in 10 mM Tris-maleate, pH 7.0, with 10 mM MgCl2 and 1 mM CaCl2 added, washed in PBS with 50 mM glycine added, processed by progressive lowering of the temperature, embedded in Unicryl (British BioCell; London, UK), and UV polymerization at −20C according to the manufacturer's advice. Sections were washed with 0.2% BSA-c (BioTrend Chemikalien; Köln, Germany) in PBS before incubation with Abs (see below) and staining with 2% aqueous uranyl acetate. Alternatively, cells were suspended in 4% gelatin, fixed in 8% formaldehyde in 100 mM Pipes-HCl, pH 7.2, (48 hr, 4C), frozen, and used for ultrathin cryosectioning, Ab incubation (see below), and staining with 3% uranyl acetate + 2% type M-6385 methylcellulose from Sigma (mixture of 9:1 parts).
EM Immunocytochemistry on Sections. The following Abs were used. Established rabbit Abs (diluted 1:15 in PBS) against the C-terminal region (amino acid residues 987-999) of rat SERCA Type 3 (Wuytack et al. 1994) obtained from F. Wuytack (Louvain, Belgium) were used, because these Abs specifically recognize a ∼106 kD SERCA in AS fractions (Figure 2). For further specification we used chicken Abs against the PtSERCA sequence described for alveolar sacs in Paramecium (Hauser et al. 1998).
For visualization of Ab binding sites on sections we coupled protein A (Sigma) to 6-nm gold particles (pA-Au6, diluted 1:20 in PBS) or used rabbit anti-chicken Abs coupled to 10-nm gold particles (RaC-Au10, diluted 1:10 in PBS) from BioTrend.
Freeze-fracturing and Replica Labeling
Live cells were rapidly frozen by two different protocols. (a) Cells were either sandwiched between two thin copper sheets and vigorously injected into melting propane (∼123K) according to Gulik-Krzywicki and Costello (1978), or (b) cells were sprayed into melting propane according to Bachmann and Schmitt (1971) and Plattner et al. (1972) using the quenched-flow set-up and the follow-up methodology described by Knoll et al. (1991). Cells were then processed by freeze-fracturing and platinum/carbon replication in a Balzers BAF 300 unit.
Replicas obtained by Method (a) served for freeze-fracture replica labeling according to Fujimoto (1997). Briefly, cell remnants were digested by floating on 2.5% SDS before samples were washed with 5% BSA in PBS, exposed to an Ab (diluted 1:10) obtained in rabbits against P. tetraurelia cell surface components (anti-surface Abs), then to pA-Au10 (diluted 1:10, + 5% BSA), washed in PBS, and fixed in 0.5% w/v glutaraldehyde. For anti-surface Abs, see Momayezi et al. (1987), whereas the Abs used here [described in more detail by Flötenmeyer et al. (1999)] served solely for unequivocal identification of membranes in the densely packed cell surface arrangement. Routinely Pt/C shadowed replicas obtained by Method (b) were used for image analysis.
Electron Microscopy and Image Analysis
Ultrathin sections and freeze-fracture replicas were evaluated in a Zeiss EM10 or a Leo EM912 Omega instrument.
Electron micrographs suitable for analysis of the IM-AS were selected by optical diffractometry and digitized with a pixel size corresponding to 0.77 nm at the specimen level. Standard correlation averaging techniques (Saxton and Baumeister 1982) were performed using SEMPER 6 for multivariate statistical analysis and classification (Van Heel 1984). IMAGIC software was applied.
Results
Figure 1 illustrates the potential Ca2+ fluxes in Paramecium, as outlined in the Introduction, and it organizes the results that follow. The previously described SERCA form from Paramecium alveolar sacs, PtSERCA (Hauser et al. 1998), contains the C-terminal motif KKXX (as KKIQ), which appears to be a retention signal for transmembrane proteins of the ER in animal cells (Jackson et al. 1993), in agreement with alveolar sacs as a specialized form of ER (see Introduction).
Western blot analysis of subcellular fractions showed localization of PtSERCA to subplasmalemmal compartments, and we now show here that these correspond to alveolar sacs. Although occurrence of oligomeric SERCA forms has been inferred from biochemical studies with muscle, we report here similar results for PtSERCA and we characterize in situ for the first time an ultrastructural equivalent by image analysis.
Biochemical and Immunochemical Studies
Figure 2 shows proteins from alveolar sac fractions on a Western blot using established anti-SERCA Abs described in Materials and Methods. Note the band equivalent to single SERCA proteins at 106 kD and also a much larger band equivalent to oligomers of the SERCA proteins. The exact molecular weight is difficult to establish. However, the high molecular weight band of $300 kD appears to be due to oligomers, because there is a precedent for finding oligomers of SERCA proteins even on denaturing gels with SDS and even under reducing conditions (Murray and Ohlendieck 1998).
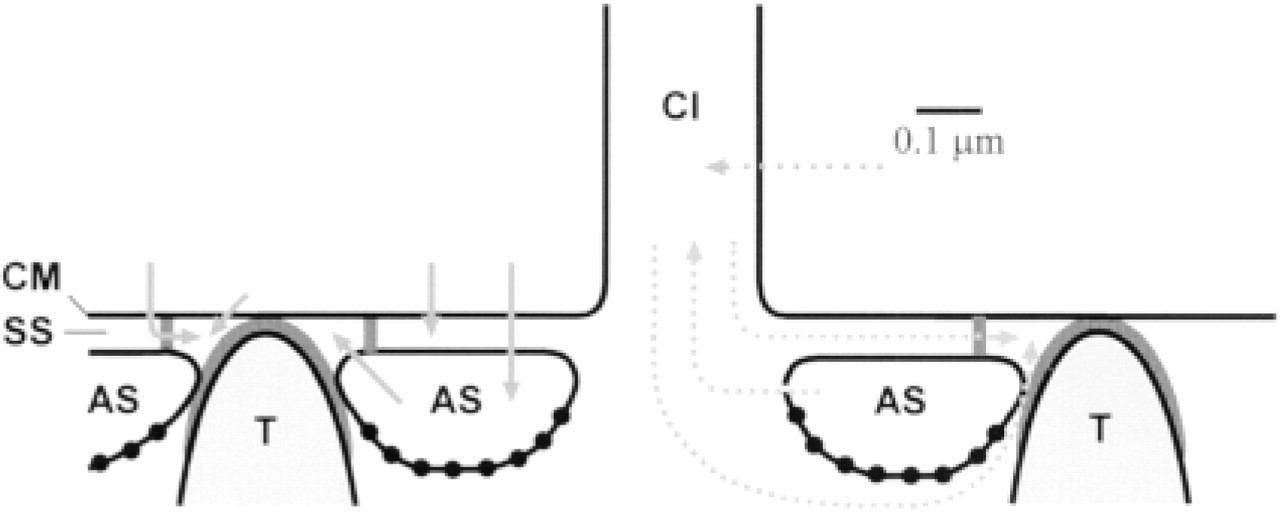
Anatomic scheme of the Paramecium cell cortex, indicating potential Ca2+ fluxes (arrows) and preferential location of the SERCA pump analyzed (dots), with aspects pertinent to exocytosis (left) and possibly to ciliary activity (right). For further explanation, see text. AS, alveolar sacs; CI, cilium; CM, cell membrane; SS, subplasmalemmal space; T, trichocyst. Inner and outer regions of membrane of alveolar sacs (IM-AS, OM-AS) are the regions facing the inside or the outside of the cell, respectively.
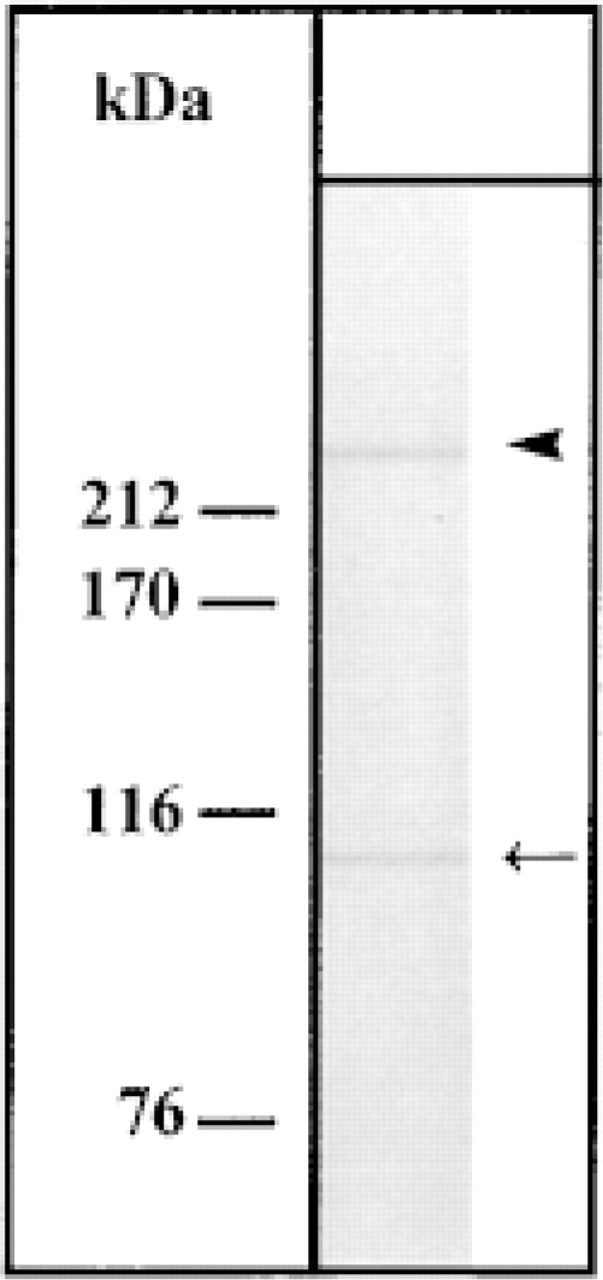
Recognition of a SERCA by Abs in alveolar sac fractions. Western blot from isolated alveolar sacs, no crosslinking, SDS-PAGE from a gradient gel (as specified in Materials and Methods), anti-SERCA 3 Abs (1:1000) detected by goat anti-rabbit Ab-alkaline phosphatase conjugate (1:10,000). Note occurrence of a 106-kD monomer (arrow) and of a high molecular weight oligomeric form (arrowhead).
Figure 3 shows 32P autoradiographs of phosphoenzyme intermediates. As with Western blots, there are bands at approximately 106 kD and, under conditions of Ca2+ and Mg2+, there is a higher molecular weight band as well.
Figure 4 also shows phosphoenzyme intermediates under crosslinking conditions. EGS was used as a crosslinker of similar size as used in most recent studies with SERCA molecules (Murray and Ohlendieck 1998) or with Ca2+ release channels (Sholshan-Barmatz et al. 1995), both in SR. After mild crosslinking, monomers and additional bands of ∼210, 290, and 390 kD are found (bands of $400 kD do not penetrate into the gel). Some additional bands are due to the fact that we analyzed alveolar sac fractions rather than purified enzyme.
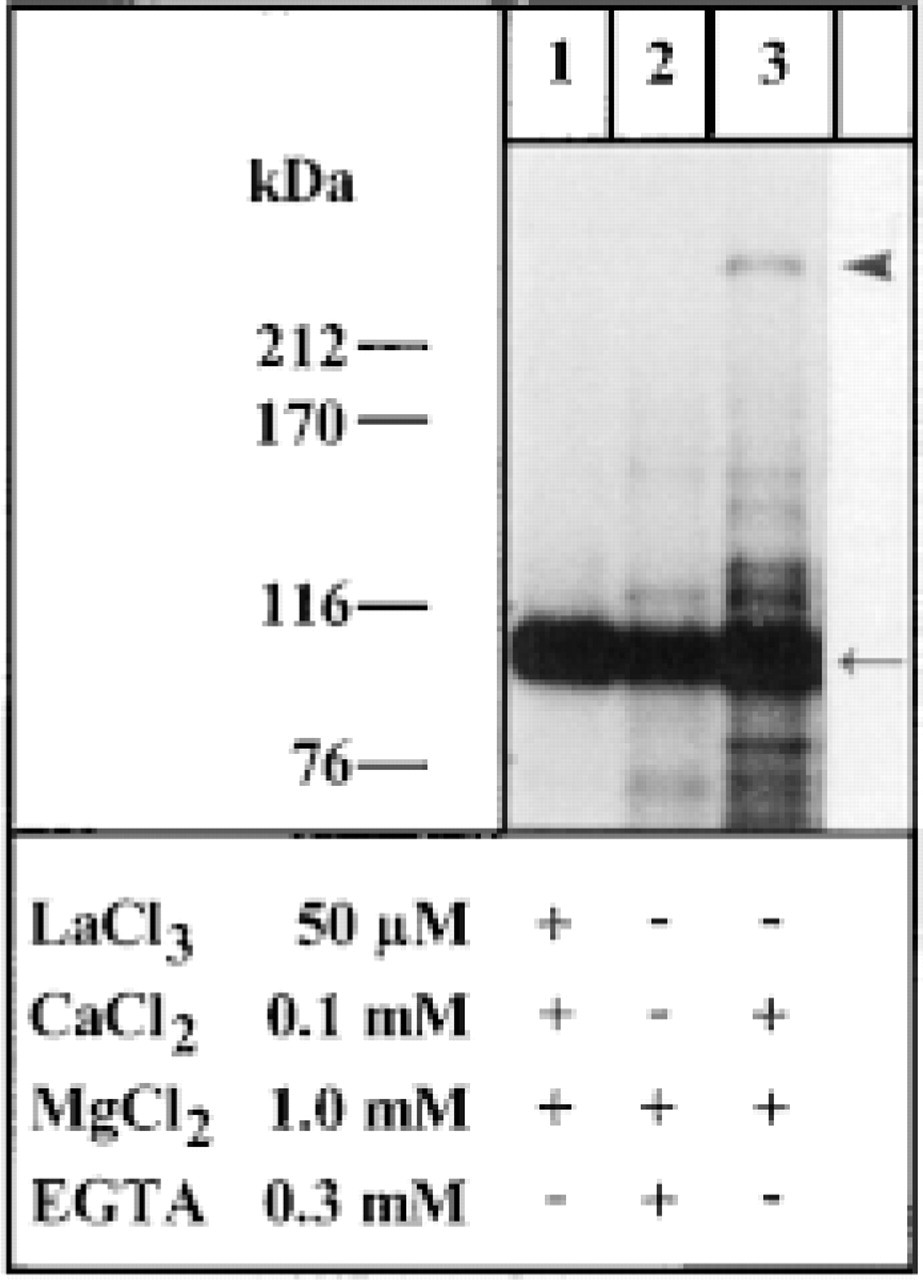
Auradiogram of 32P-labeled phosphoenzyme intermediates of monomeric and high molecular weight forms recognized on SDS-PAGE gradient gels from non-crosslinked alveolar sac fractions. Samples were subjected to phosphorylation conditions in vitro as specified in Materials and Methods. Note occurrence of a monomeric 106-kD form (arrow) and of a high molecular weight form (arrowhead; suppressed by La3+ or in absence of Ca2+).
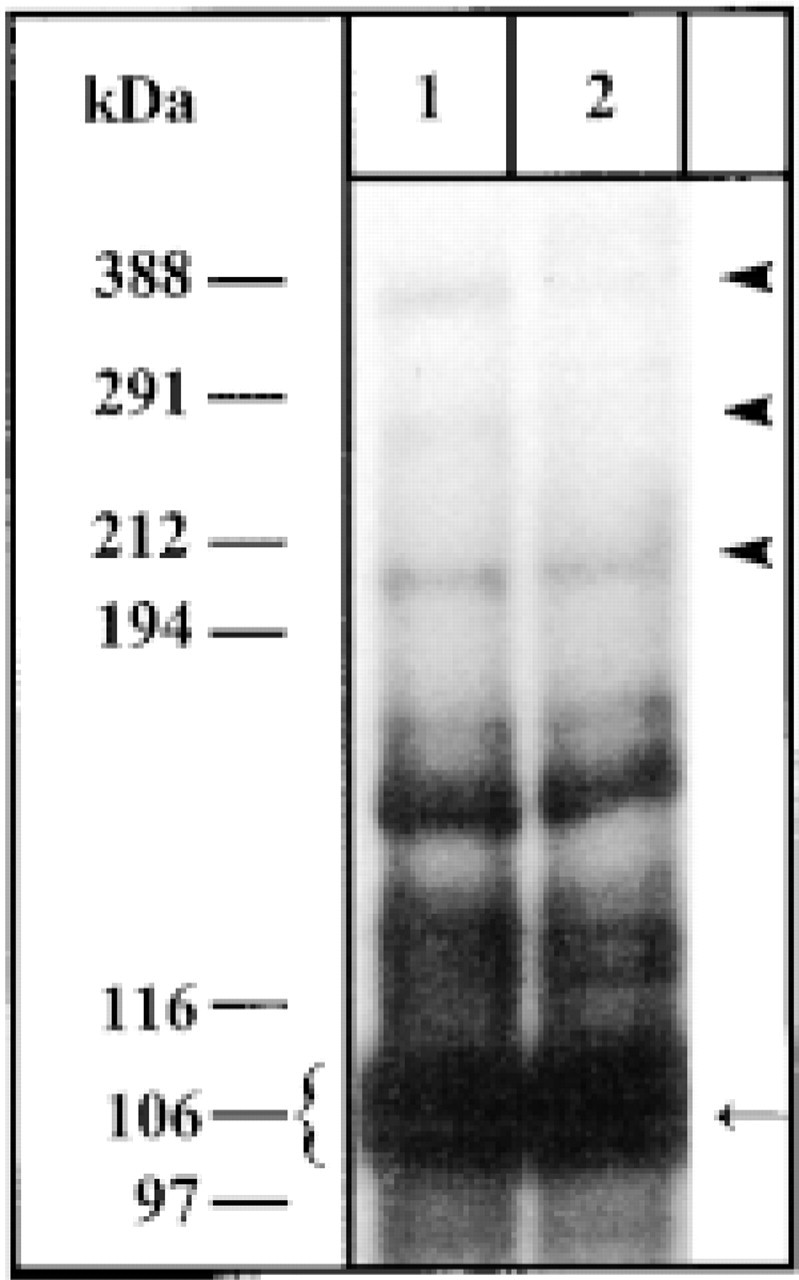
Autoradiograph of high molecular weight SERCA forms. Alveolar sac fractions were processed after 30 (Lane 1) or 10 min (Lane 2) EGS crosslinking and 32P intermediate formation by gradient gel SDS-PAGE analysis and autoradiography (see Materials and Methods). Note, in addition to the abundant monomeric form (∼106 kD, arrow), occurrence of oligomeric forms (arrowheads) of ∼210, ∼300, and $400 kD (not resolvable).
The specificity of Ab binding on Western blots and of phosphoenzyme intermediate 32P labeling has been established previously (Hauser et al. 1998; Kissmehl et al. 1998) and is supplemented by the following details. We note that monomers are of the expected size of ∼106 kD (Figures 2–4). In blots, the same bands are recognized by the established anti-SERCA 3 Abs and by the Abs against a peptide from PtSERCA (to be used in negative controls by Ab adsorption). This peptide has no equivalent in the plasmalemmal Ca2+ pump of Paramecium (Elwess and Van Houten 1997) and there is no crossreactivity (Kissmehl et al. 1998). At the EM level, labeling is restricted to alveolar sacs, notably their OM-ASs, whereas it is excluded from cell membranes (see below). Furthermore, omission of primary Abs yields negative results in immunostaining and on Western blots (not shown). Involvement of kinase activity in phosphoenzyme intermediate formation has been excluded previously on the basis of hydroxylamine sensitivity (Kissmehl et al. 1998). In Figure 3, overexposure of the gel autoradiograph was required to recognize more clearly the high molecular weight form of the phosphoenzyme intermediate (Figure 3, Lane 3). This caused unusually intense labeling of the monomeric form also in the absence of Ca2+ (Figure 3, Lane 2), probably due to emulsion saturation in this region of the autoradiograph. Reduced exposure [see Figure 5 in Kissmehl et al. (1998)] revealed the expected reduction (∼10-fold) of 32P labeling of the monomeric form (which in turn, however, does not allow the oligomers to be visualized). In fact, labeling of oligomeric forms was blocked in the absence of Ca2+, even under the conditions of our Figure 3. Kissmehl et al. (1998) also established the unorthodox effect of La3+ on phosphoenzyme formation with PtSERCA (Figure 3, Lane 1) which, in contrast to Ca2+ pumps from other systems (Carafoli 1991), including SERCAs (Fujimori and Jencks 1990), can even be stimulated under the conditions used.
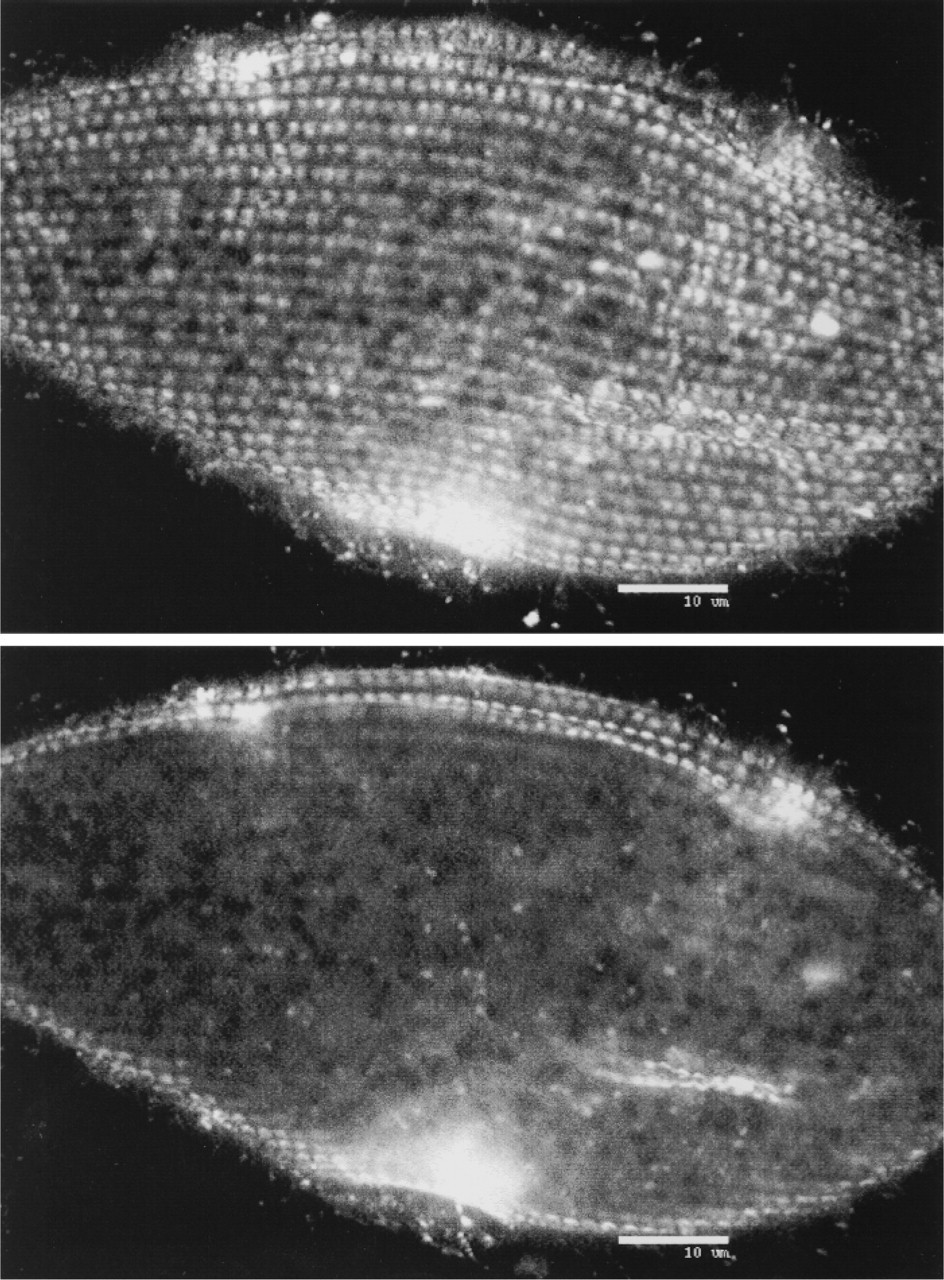
High-resolution confocal laser scanning microscopic localization of PtSERCA in a permeabilized cell by anti-peptide Abs and FITC-labeled second Abs, in a superficial (top) or median (bottom) focal plane. Label is heavily concentrated in scalelike structures which, in size and arrangement, correspond to alveolar sacs, whereas label is largely absent from interior structures.
Immunocytochemistry
High-resolution confocal laser scanning microscopic analysis of permeabilized cells labeled with Abs against PtSERCA peptide showed almost exclusive localization of scale-like cortical structures equivalent to alveolar sacs (Figure 5). Results after omission of permeabilization or first Ab incubation or peptide pretreatment of Abs were negative (not shown).
For immuno-EM localization (Figures 6 and 7), two widely different Abs and preparation protocols were used (see Materials and Methods). Both of these widely differing procedures revealed heavy labeling of alveolar sacs, selectively of their inner profiles (IM-AS). With anti-ratSerca 3 Abs, some label was found in the cytoplasm (Figure 6). This is compatible with their crossreactivity with a potential SERCA isoform in the ER, in agreement with the distribution of the original antigen in some other cell types (Wuytack et al. 1994). Anti-PtSerca(peptide) Abs clearly labeled alveolar sacs on their lateral side (upper part of Figure 7) and IM-AS regions where they emerge at the section surface (lower part of Figure 7), whereas they hardly recognize any internal structures beyond alveolar sacs. This is compatible with the confocal laser scanning microscopic images shown in Figure 5. None of the Abs used produced any significant labeling of the cell membrane/OM-AS complex (Figures 6 and 7).
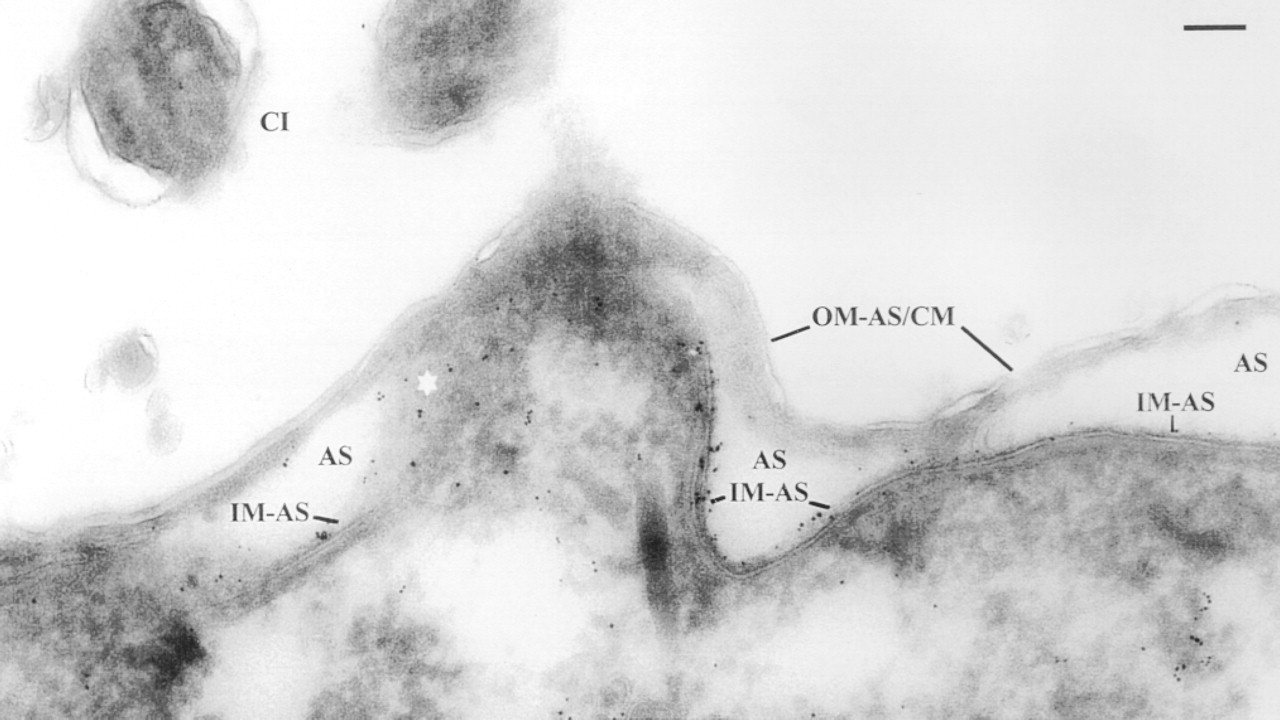
Immunogold labeling of alveolar sacs on ultrathin cryosections using anti-SERCA 3 Abs and pA-Au6. Note presence of label predominantly on the IM-AS region (particularly in a tangentially cut region at asterisk) and absence from extracellular regions, cilium (CI), alveolar sac lumen, and particularly from the OM-AS/cell membrane (CM) complex. Some label occurring in the cytoplasm is probably indicative of ER (see text). Bar = 0.1 μm.
Freeze-fracture and Correlation Averaging Image Analysis
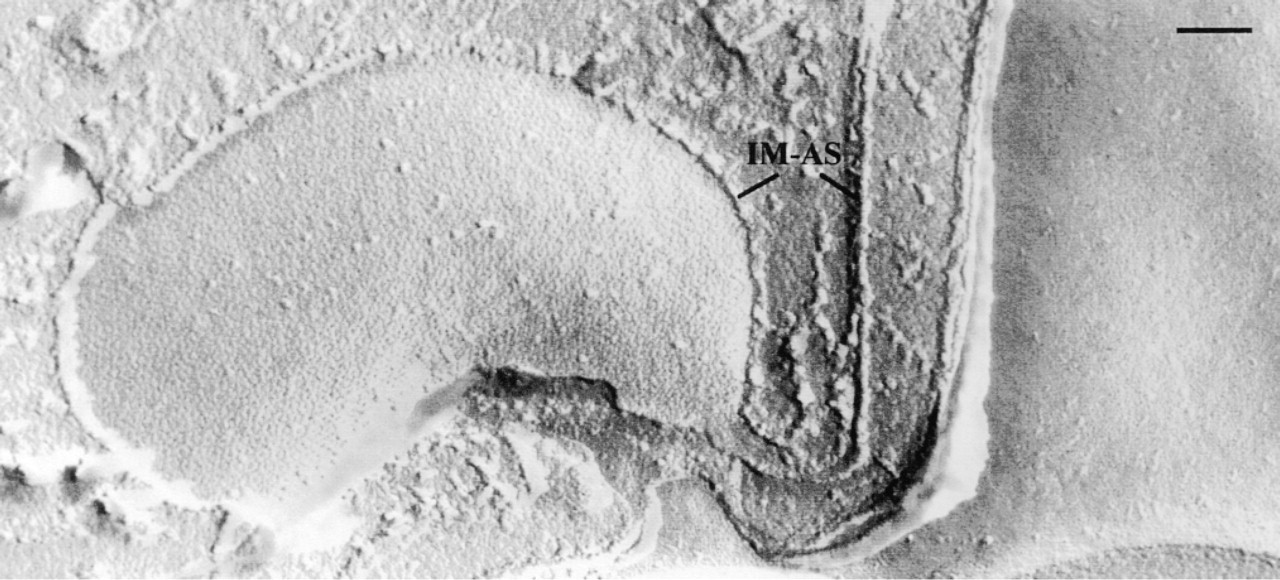
We analyzed ultrastructural details of the alveolar sac membranes by freeze-fracture replication after cryo-fixation without chemical pretreatment (Figures 8 and 9). To orient the confusingly dense packing of the three membrane layers, we identified the plasmalemma by the freeze-fracture replica gold-labeling approach using Abs against cell surface components (see Materials and Methods). The survey in Figure 8 reveals alveolar sacs as distinct structural entities. Four alveolar sacs surround a trichocyst docking site, each site being in line with a row of cilia (Plattner et al. 1973; Allen 1988). We could not recognize pore-like connections between adjacent alveolar sacs, even at higher magnification, although these have been described after chemical fixation (Allen 1988). Figure 9 reveals a “suture” between two alveolar sacs where their border runs along alternating trichocyst docking sites and ciliary bases in a longitudinal direction. Gold labeling of the cell surface membrane allowed identification of adjacent OM-AS (Figure 9). These membranes displayed IMPs in variable density with no conspicuous pattern.
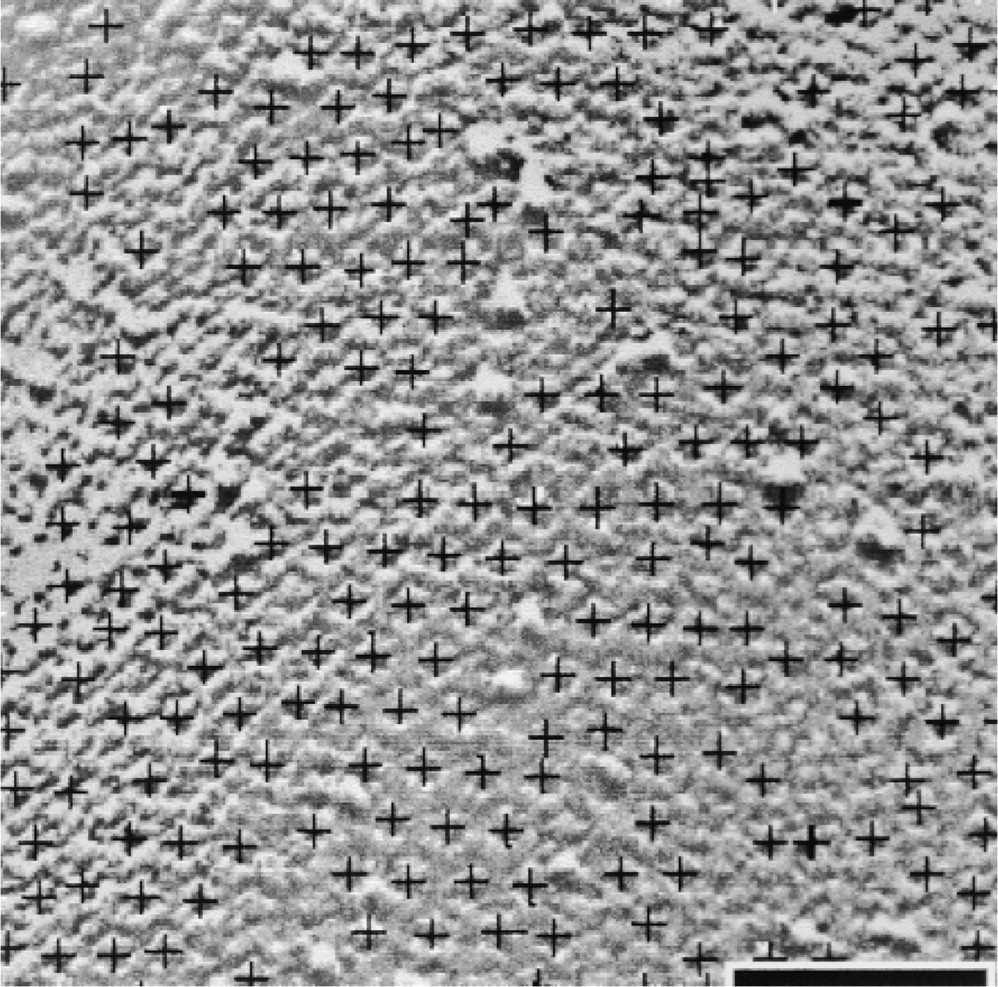
A characteristic cobblestone pattern was observed sometimes selectively on the plasma fracture face (PF face) of the IM-AS regions (Figure 10). In general, the metal distribution on the shadowed replicas gave the impression of more or less densely packed annular depressions on the fractured membrane. The optical diffractograms of the micrographs indicate a periodicity of ∼21 nm. For image analysis, a small fraction of the image (100 × 100 nm) was selected as reference and cross-correlated with the entire area of interest. Sites of maximal correlation of the motifs are interactively optimized, resulting in a peak list comprising ∼1800 entities/μm2, which is ∼90% of the total number (Figure 11). The average of these motifs looks very similar to the ones in Figure 12, their nearest neighbors, but are only vaguely indicated. When the distortions of the peak positions (which are mainly due to the curvature of the fractured membrane) were taken into account and the motifs were translationally and rotationally (± 5°) aligned, the hexagonal arrangement of the motifs became clearly visible (Figure 12). The shortest repeat distance of the motifs is 21 nm ± 5% according to the power spectra. The image obtained in Figure 12 suggests that the structure may be composed of subunits (∼8-nm diameter), an observation that is supported by the analysis of several replicas. To check the results obtained by correlation averaging, single particle analysis using multivariate statistical analysis (MSA) was applied to areas with densely packed motifs and to less densely packed areas. The class average of the motifs thus obtained agreed well with the findings by correlation averaging (not shown).
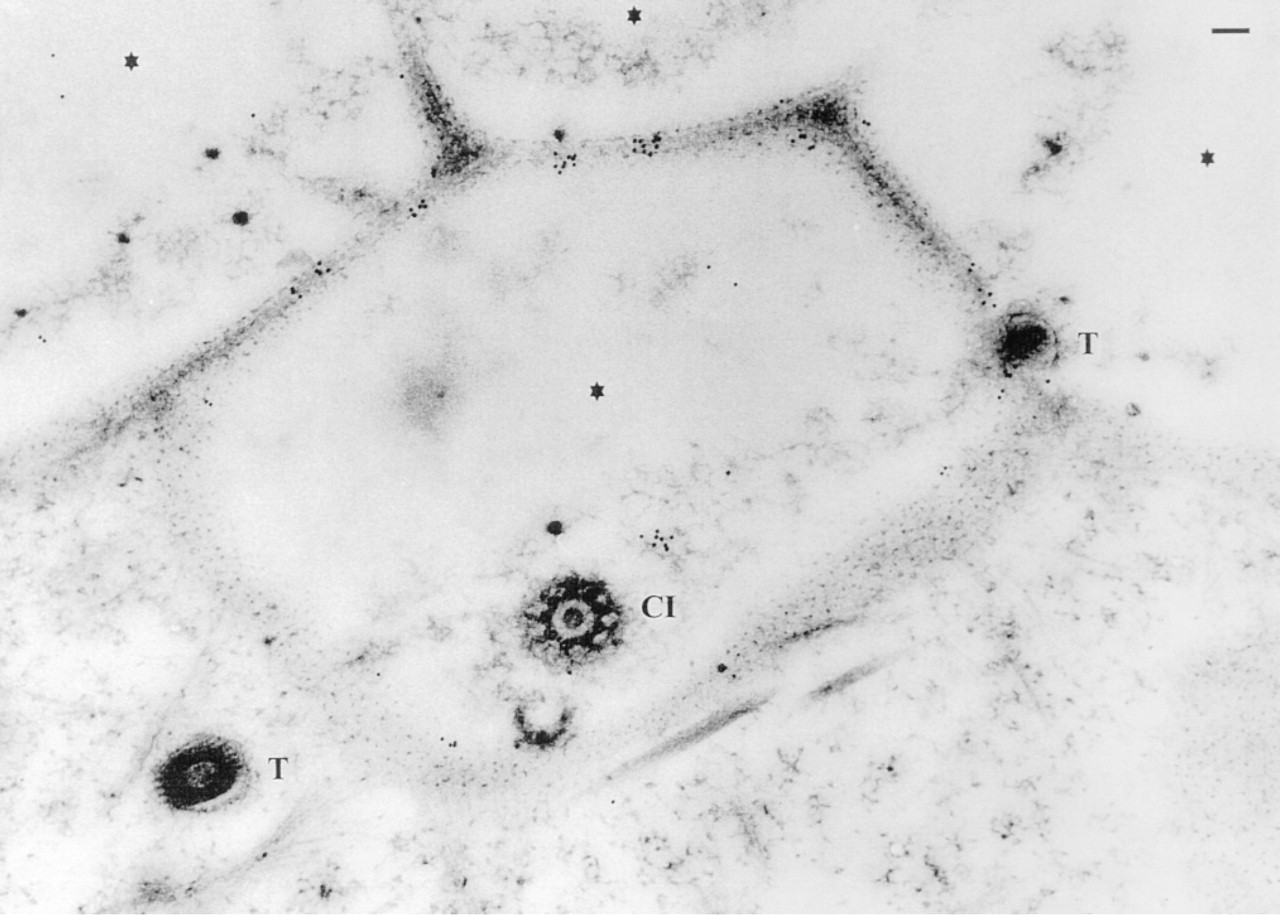
Immunogold labeling of Unicryl sections using Abs against a synthetic peptide of a P. tetraurelia SERCA and detection by RaC Abs-Au10. Label binds to lateral sides of alveolar sacs and to IM-AS regions, emerging here in a tangential section, thus exhibiting many antigenic sites. Almost no label occurs over extracellular regions (asterisks; formed by cell surface depressions), cross-cut cilia (CI), trichocysts (T), and deeper cytoplasmic layers. Bar = 0.1 μm.
When these images are analyzed, it must be recalled, first, that they represent fracture faces in which the original structure of IMPs will be more or less deformed, thus limiting the feasibility of interpretation. Second, the images represent the distribution of a fairly thick Pt/C deposit (as obtained by the routine freeze-fracture method applied) which reflects more than the relief of the shadowed surface. Rather, the thickness of the deposit and, even more important, self-shadowing and decoration effects limit resolution of relief details to a degree that structural elements smaller than 10 nm may be only vaguely indicated (Reimer and Schulte 1966; Bachmann et al. 1985). Third, image analysis reduces random noise in the individual motifs but does not reduce artifacts inherent to the methods of preparation, so that the actual size and form of IMPs or of IMP aggregates will not be precisely reflected by the images obtained. However our goal was not to analyze the fine structure of subunits but rather to determine their mutual arrangement. According to the method applied, the IM-AS region clearly contains densely packed structures, compatible with the interpretation as large ∼20-nm aggregates of ∼8-nm IMPs, arranged as adjacent oligomers, i.e., as putative tri- or hexamers.
Because no fixation or crosslinking was applied in these experiments before fast freezing, such oligomeric structures must occur in the IM-AS in the living cell. For the following reasons, we consider these IMP aggregates to be potential SERCA equivalents. (a) Such structures are realized exclusively in the IM-AS region, i.e., where immunogold labeling predominates after application of widely different methods. Direct identification by freeze-fracture replica labeling, although highly desirable, is not possible. (b) IMP size and arrangement are compatible with a SERCA-type molecule but not with any of the known Ca2+ release channels. (c) Aggregation of SERCA molecules notoriously occurs in the SR, by far the best known Ca2+ store. These arguments are discussed in more detail below.
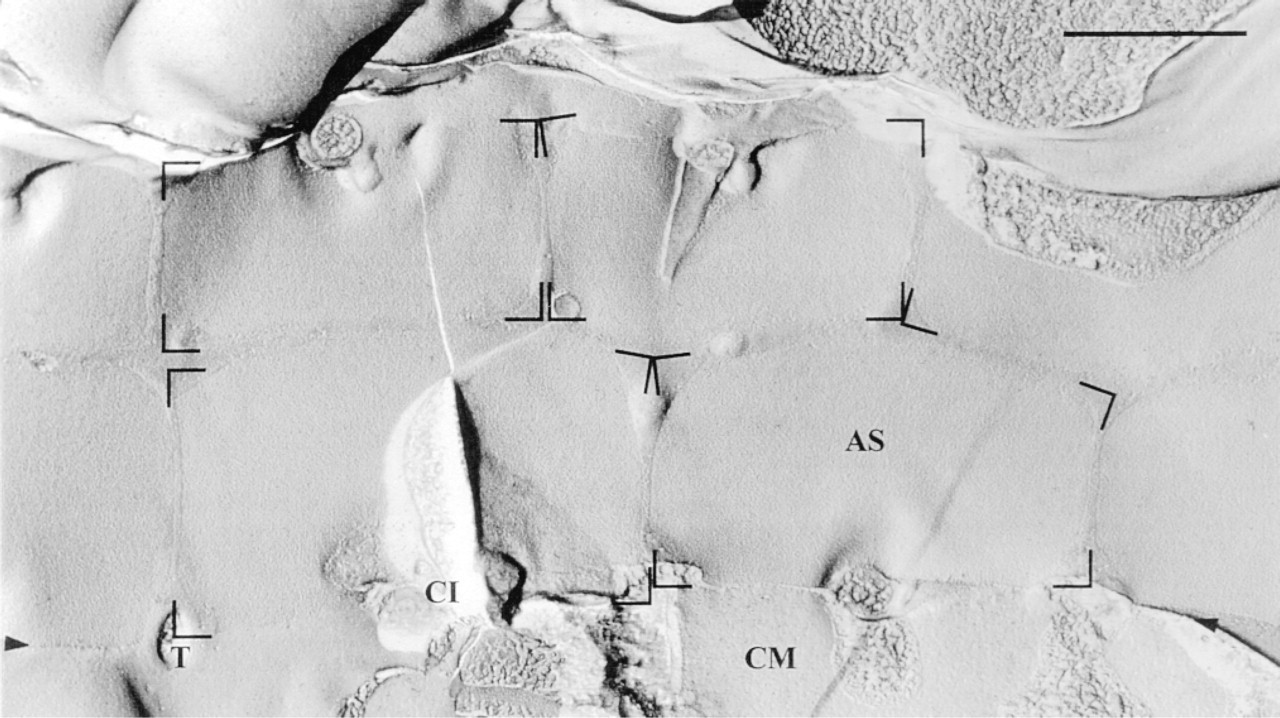
Survey freeze-fracture appearance of the cortical membrane complex. The outlines of some alveolar sacs (AS) are indicated. Note absence of any visible tubular connections between adjacent ASs (see text) and close apposition along suture-like AS-AS connections (arrowheads; shown in more detail in Figure 9). The region below the line between arrowheads represents the cell membrane (CM) according to the freeze-fracture replica labeling applied (as shown in detail in Figure 9). CI, ciliary base; T, trichocyst docking site. Bar = 1 μm.
Discussion
To substantiate the partial aggregation and microzonal arrangement of SERCA molecules in alveolar sacs, we combined different criteria, using Western blots, phosphoenzyme intermediate analysis, IMP size, and IMP aggregation analysis (freeze-fracturing combined with MSA image analysis), as well as EM immuno-localization studies. With the Abs against a PtSERCA peptide previously characterized by Western blots (Hauser et al. 1998; Kissmehl et al. 1998), we now localize SERCA molecules to the IM-AS. In contrast, the OM-AS/cell membrane complex binds much fewer Abs, if any. The explanation may be that this side faces the cell membrane, with its efficient Ca2+/CaM-stimulated Ca2+ pump (Wright et al. 1993; Elwess and Van Houten 1997). Both types of anti-SERCA Abs used do not recognize on Western blots the ∼130-kD large Ca2+ pump from purified Paramecium cell membrane fractions (Kissmehl et al. 1998).
What Are the Ultrastructural Characteristics of Alveolar Sacs?
Freeze-fracture replica labeling allows clear identification of freeze-fracture levels within the cell membrane/OM-AS/IM-AS complex. Therefore, we could ascertain that the OM-AS region is rather poor in IMPs which do not form any conspicuous aggregates. OMAS fractures, however, enabled us to recognize lateral suture-like connections formed by double IMP rows, first described by Plattner et al. (1973). In cryofixed cells there was the absence of the tunnel-like connections between adjacent alveolar sacs that had been previously postulated (Allen 1988). The occurrence of distinct Ca2+ store entities correlates with distinct peaks of Ca2+-activated currents in parallel with local exocytosis on stimulation of secretion (Erxleben et al. 1997). Our present data imply Ca2+ uptake and storage in defined structural and functional entities, i.e., individual alveolar sacs. As discussed below, low IMP density and lack of any conspicuous IMP aggregates, in combination with low immunoreactivity, argues against any significant SERCA localization in the OM-AS region. The opposite holds true for the IM-AS region. The “suture” may serve as a link and/or as a diffusion barrier between IM-AS and OM-AS.
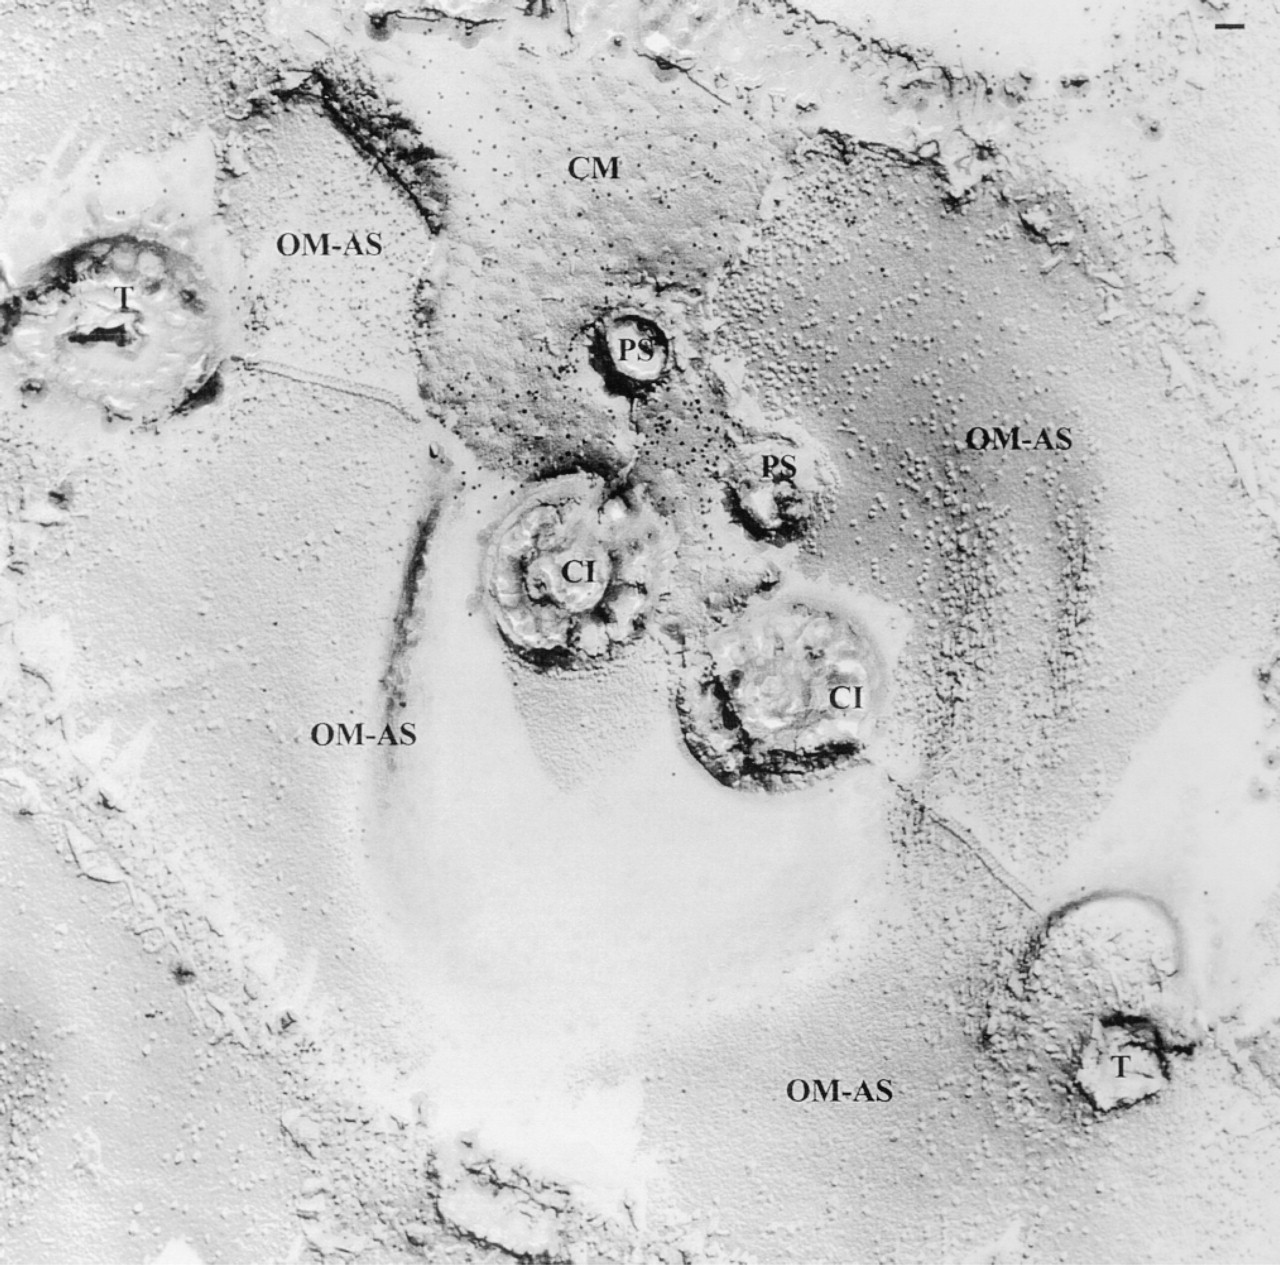
Variable density of IMPs and/or absence of oligomeric structures in OM-AS regions (to be compared with IM-AS regions in Figure 10), located below the cell membrane (CM; identified by freeze-fracture replica labeling, top middle region; see Materials and Methods). Note the “suture” connecting adjacent alveolar sacs along the axis trichocyst-cilia-trichocyst (T-C-T). Cilia here occur pairwise, with adjacent coated pits called parasomal sacs (PS). Bar = 0.1 μm.
How Should We Address the Possible Identity of IMP Aggregates in the IM-AS Region?
Because Ca2+ stores must contain Ca2+ release channels, these must be excluded as equivalents of IMP aggregates in IM-AS. According to the [Ca2+]i dynamics determined during exocytosis stimulation, we presume mobilization of Ca2+ from alveolar sacs is the first step and that Ca2+ influx from the medium is a second step (Erxleben and Plattner 1994; Erxleben et al. 1997; Klauke and Plattner 1997; Plattner et al. 1997a). This would entail Ca2+ release from sites facing the cell membrane (OS-AM, or lateral OS-AS/IM-AS transition zone), the resulting Ca2+ flux possibly being directed towards trichocyst docking sites, although we do not yet know the Ca2+ channels involved. In other systems, notably ryanodine receptors (Franzini-Armstrong and Jorgensen 1994; Franzini-Armstrong and Protasi 1997) and inositol 1,4,5-trisphosphate (InsP3) receptors (Maeda et al. 1990) are known to occur. In the SR, the first type is composed of 565-kD and the second type of 320-kD large subunits, always arranged in tetramers. In freeze-fractures, ryanodine receptors of SR normally form square groups of 10-13 nm large IMPs in 30-nm spacing (Block et al. 1988; Franzini-Armstrong and Jorgensen 1994), with rare deviations from the tetrameric arrangement (Protasi et al. 1997), whereas InsP3 receptors always form groups of 10-nm large IMPs in ∼20 nm distance (Maeda et al. 1990). Such arrangements are considered functionally relevant, so that any deviation would indicate absence of the respective Ca2+ release channels. In fact, we have thus far not seen any such tetrameric IMP arrangements in alveolar sac membranes, even though occurrence of ryanodine-sensitive channels of some other morphology cannot be excluded. In the IM-AS region, localization of Ca2+ release channels remote from potential targets would not appear feasible.
Cobblestone pattern frequently found in the PF face of freeze-fractures from IM-AS regions (used for image analysis; see Figures 11 and 12). Note densely packed composite IMPs in the IM-AS fracture area (left), which is continuous with a cross-cut IM-AS profile (right). Shadowing direction: bottom left to top right. Bar = 0.1 μm.
Could Enrichment of SERCA Molecules Account for the Freeze-fracture Appearance of the IM-AS Region?
The following arguments support this assumption. Whereas IMP density is low or moderate in the OM-AS region, it is very high in the IM-AS region, just as in the SR (Mintz and Guillain 1997). In the SR, the diameter of the ten transmembrane domains of a SERCA molecule is 7 nm according to low-dose cryo-EM and image analysis (Ogawa et al. 1998). The 6 × 17-nm size reported by others, using the same methodology (Stokes and Green 1990), represents dimers, in agreement with the size after negative staining (Taylor et al. 1988) or with the different methods combined (Cheong et al. 1996). Taking into account material pile-up during platinum/carbon replication (Plattner and Zingsheim 1983) in our image analysis, the 8-nm IMPs in the IM-AS are compatible with the size reported for the transmembrane domain of SERCA molecules. Single particle averaging shows ∼8-nm large motifs in trimeric or, more likely, hexameric arrangements of ∼20 nm. Unfortunately, direct identification of IMP aggregates is not possible in freeze-fracture labeling experiments, because in principle the cytoplasmic epitopes recognized by the anti-SERCA Abs available are not accessible to visualization by this method (see Fujimoto 1997). Therefore, the most reliable localization of SERCA we can achieve is by EM immunogold section staining. Because the region preferably labeled is the IM-AS, which is rich in IMP aggregates (formed by SERCA molecules as in SR, as we suggest), coincidence of these features in our structural and immunochemical analyses may be more than circumstantial.
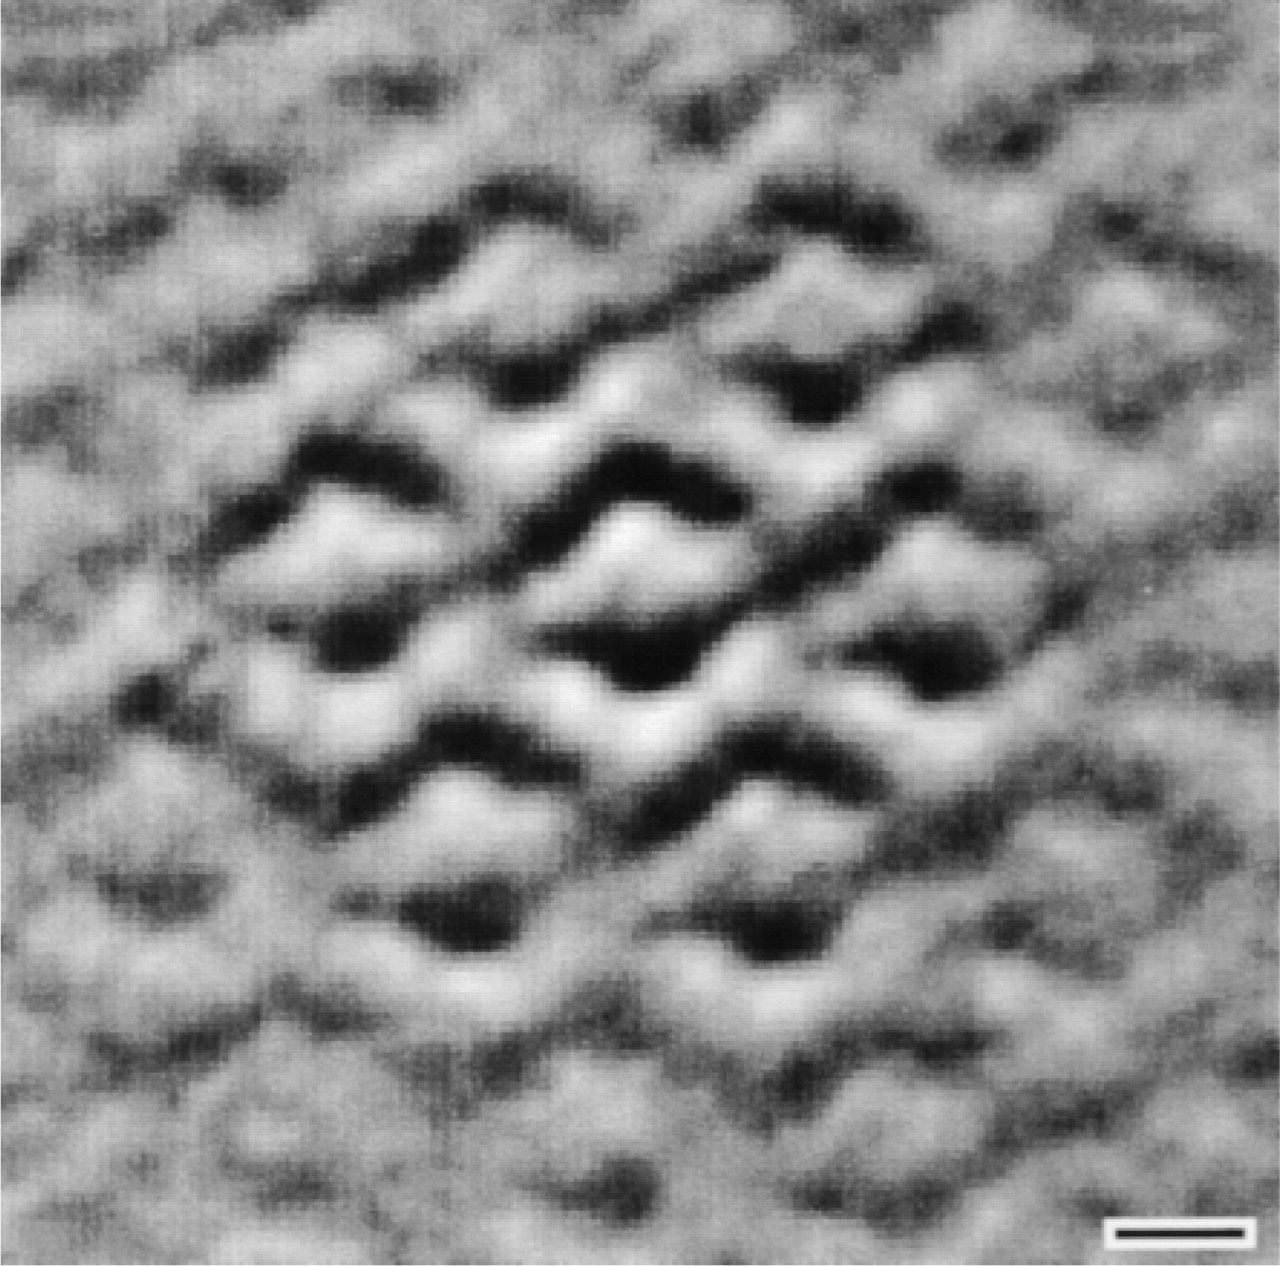
Correlation averaging of motifs indicated in the corrected peak list (Figure 11), showing regularly arranged aggregates of IMPs. These are compatible with circular or hexagonal arrangements of ∼8-nm large IMPs. Shadowing direction: bottom to top. Bar = 10 nm.
How does this compare with other systems? Analyses of vertebrate systems [Andersen et al. (1986), supported by a number of other publications] note that “the self-associated state of SR Ca2+-ATPase is a fundamental issue.” Since then, many more studies have demonstrated the tendency of SERCA molecules to form oligomers in vivo and on SDS-PAGE gels. For example, in scallop SR, SERCA molecules form aggregates in vivo (Castellani et al. 1989) and after isolation and reconstitution in liposomes (Nagata et al. 1997), again depending on preparation conditions (accounting for some variability of results). Spontaneous aggregates even beyond tetramers are clearly seen to occur on electrophoresis gels from SR (Baskin and Hanna 1979; Martonosi 1995; Maguire and Ohlendieck 1996), even on SDS gels under reducing conditions (Murray and Ohlendieck 1998). The precise size, particularly of larger aggregates, was difficult to determine, as it is with alveolar sacs (see Results). In our case, omission of long SDS treatment and of sample boiling, among other corollaries (see Methods), such as immediate sample application to electrophoresis gels, may be critical aspects. Although neither in our nor in any other work has this aspect been systematically analyzed, spontaneous crossreaction of SERCA molecules may in fact occur in alveolar sacs as in the SR. The potential involvement of superficial SH groups (Yamasaki et al. 1990) remains to be analyzed. Because oligomerization does not reflect deactivation (Shorina et al. 1997), SERCA aggregates in our system can be assumed to actively participate in establishing [Ca2+]i homeostasis in our system also.
How Can This Arrangement of SERCA Molecules in Alveolar Sacs Account for Functional Requirements?
Our main conclusion is that each alveolar sac is a separate Ca2+ storage unit, with SERCA-type pumps enriched in the IM-AS region. Clearly, [Ca2+]i in the narrow 15-nm subplasmalemmal space would be regulated most efficiently by the plasmalemmal Ca2+ pump. Finally, on stimulation of exocytosis, a large flow of Ca2+, released from alveolar sacs and enforced by Ca2+ influx (Kerboeuf and Cohen 1990; Erxleben and Plattner 1994; Plattner et al. 1997a), sweeps towards the cell interior (Erxleben et al. 1997; Klauke and Plattner 1997). Therefore, to reestablish [Ca2+]i homeostasis, an additional pump would be most efficient when localized in the IM-AS region. All this appears compatible with the kinetic properties of the plasmalemmal (Smith and Hennessey 1993; Wright et al. 1993) and the alveolar sacs' Ca2+ pump (Stelly et al. 1991; Länge et al. 1995).
Are there still some other possible functions of alveolar sacs? On induction of ciliary beat reversal by cell membrane depolarization, Ca2+ enters the cell via voltage-dependent Ca2+ channels in the ciliary membrane (Machemer 1988a,b). The ciliary cell membrane is assumed not to possess a Ca2+ pump (Wright et al. 1993), as confirmed by staining with Abs against the CaM binding domain (Van Houten 1998), which is absent from the PtSERCA molecule (Hauser et al. 1998) analyzed here. Therefore, [Ca2+]i homeostasis could be reestablished during stimulation of exocytosis, at least in part, by sequestration into alveolar sacs, probably in addition to cytosolic CaBPs and possibly some Ca2+ stores deeper inside the cell. Alveolar sacs were recently assumed to provide Ca2+ also for some other ciliary-based chemoresponses (Wassenberg et al. 1997). In this context, the SERCA-type pump of nearby alveolar sacs may also be relevant.
Footnotes
Acknowledgements
Supported by DFG grant SFB156/B4 and by the Forschergruppe “Cell surface structure and function.”
We thank Ms C. Braun, S. Kolassa, and B. Kottwitz for excellent technical assistance, and J. Hentschel, S. Huber, and N. Klauke for probing some samples. We gratefully acknowledge the generous help of Dr F. Wuytack (University of Louvain, Belgium) with anti-SERCA 3 Abs.