
Abstract
The sarco-endoplasmic reticulum Ca2+ ATP-ase (SERCA) and myosin heavy chain (MyHC) levels were measured in hindlimb-denervated and selectively denervated rat soleus muscles. Selective denervation allowed passive movement of the soleus, whereas hindlimb denervation rendered it to passivity. To minimize chronic effects, we followed the changes only for 2 weeks. Selective denervation resulted in less muscle atrophy, a faster slow-to-fast transition of MyHC isoforms, and less coordinated expressions of the slow vs fast isoforms of MyHC and SERCA. Generally, expression of the slow-twitch type SERCA2a was found to be less dependent, whereas the slow-twitch type MyHC1 was the most dependent on innervation. Our study shows that passive movement is able to ameliorate denervation-induced atrophy of the soleus and that it also accentuates the dyscoordination in the expression of the corresponding slow and fast isoforms of MyHC and SERCA.
I
In this study, we hypothesized that, in the normal soleus muscle, the impact of nerve activity on the expression of SERCAs differs from that on the corresponding MyHC isoforms. To test this hypothesis, we denervated the hindlimb of the rat. To further refine our study, we compared this intervention with selectively denervating the soleus, thereby leaving the other hindlimb muscles intact (Zádor and Wuytack 2003). We assumed that in selectively denervated (SD) soleus, the adaptation to passive movement might affect the levels of the MyHC and SERCA isoforms differently if they are each under a different control. We assessed the effects of our interventions after 2 weeks, because it was reported that a longer denervation affects the normal regulatory pathways controlling the slow MyHC expression: e.g., unlike after 1 week (Serrano et al. 2001), the expression of the slow myosin in the regenerating soleus is no longer dependent on calcineurin after 15 days of denervation (Launay et al. 2006). We found a slight dissociation in the expression of MyHC and SERCA isoforms in hindlimb-denervated (HD) soleus and even more dissociation in SD soleus compared with the normal muscle. The results showed that the expression of slow SERCA2a does not depend on innervation, like that of the slow MyHC1. These observations are in agreement with a recent report on paralyzed soleus (Talmadge and Paalani 2007).
Materials and Methods
Animals and Treatments
Experiments with animals were approved by the Ethics Committee of Animal Treatment of the Medical Faculty of the University of Szeged.
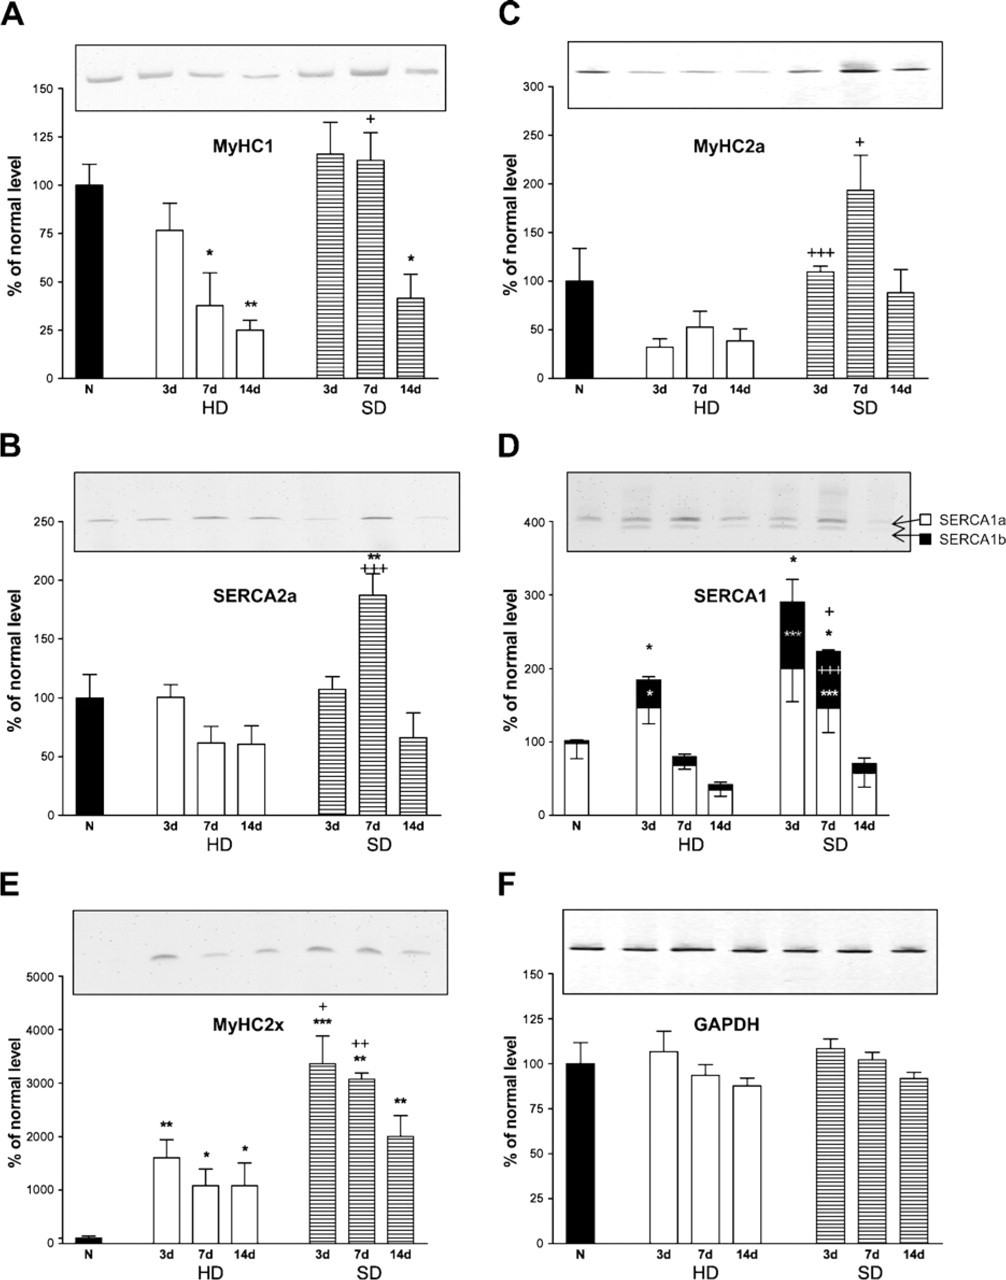
mRNA levels of myosin heavy chain (MyHC) and sarco-endoplasmic reticulum Ca2+ ATP-ase (SERCA) isoforms normalized to their respective GAPDH levels in hindlimb-denervated (HD) and selectively denervated (SD) soleus.
Male Wistar rats 3 months of age and weighing 280–350 g were used. The rats were anesthetized with an intraperitoneal injection of 1 ml of 4% chloral hydrate/100 g body weight. We treated the left hindlimbs of the animals. In the HD group, ∼1 cm of the sciatic nerve high in the thigh was cut out. In the SD group, 0.3 cm of the soleus nerve was cut out. After denervation, the soleus muscles were dissected at 3, 7, or 14 days and frozen in isopentane cooled by boiling liquid nitrogen. Normal muscles were gained from untreated animals; n = 3 in all groups except in the normal group, where n = 6. The muscles were kept at −70C until use. We also used the soleus of normal and ischiadic-denervated 200- to 215-g female Wistar rats to compare our results with those of Schulte et al. (1994).
RT-PCR
RNA extraction and reverse transcription were carried out as described previously (Zádor et al. 1996). Total RNA level was determined from its UV absorption at 280 nm using a NanoDrop spectrophotometer (NanoDrop Technologies, Inc.; Wilmington, DE). Primers and PCR conditions are as in (Zádor et al. 1996; Mendler et al. 1998; Fenyvesi et al. 2004). The cDNA was transcribed from RNA extracts that contained 1 μg total RNA. The PCR cycles were adjusted to the logarithmic/linear amplification phase. The PCR products were analyzed on a 6% (w/w) polyacrylamide gel. Twenty μl of amplified cDNA was applied on each lane. RNA levels were deduced from the bands on the ethidium bromide-stained gels quantified by Gel Doc 2000 (Bio-Rad Laboratories; Hercules, CA) and Quantity One software. We normalized the mRNA levels to the levels of GAPDH mRNA (Figure 1F), and, because RT was made on 1 mg of RNA, we multiplied by the number of micrograms of total RNA (Table 1). In this way, the mRNA levels of the whole muscle were calculated. Because of the larger variation of SERCA2a mRNA, we took the average of two amplifications from each individual muscle.
Protein Determination
Total protein levels were measured by the bicinconinic acid method using the NanoDrop spectrophotometer. The homogenate made in the first step of the SERCA extraction was used to determine the total protein level.
Immunoblotting
SERCA and MyHC protein isoforms were measured in extracts of the same muscles. For SERCA determination, immunoblots from the mitochondrial-microsomal (sarcoplasmic) fraction were used as described (Zádor et al. 1998). To extract myosin, the pellets of the first centrifugation (1000 × g for 10 minutes) were used (Hämäläinen and Pette 1997). Amounts of extract corresponding to equal parts of the muscles were loaded on each lane of the gel both for SERCA and myosin analysis. The loaded extracts contained different amounts of proteins, i.e., less in the extract of denervated muscle. The primary antibodies used in immunoblot analysis were BA-D5 (mouse, 1:100) for MyHC1, SC-71 (Schiaffino et al. 1989) (mouse, 1:100) for MyHC2a, A3 (mouse, 1:50) for SERCA1, and R-15 (rabbit, 1:5000) for SERCA2a. The bands were visualized by Ni-enhanced DAB staining (Zádor et al. 1998) or, in the case of MyHC2a, by the electro-chemiluminescent method and quantified by densitometry on Gel Doc 2000 (Bio-Rad). Two control samples were loaded on each gel as an inner standard to make the result of different blots comparable.
IHC
We obtained 15-μm-thick cryosections from muscles and stained these with peroxidase immunostaining as in Zádor et al. (1998). We used BA-D5 (mouse, 1:50), SC-71 (Schiaffino et al. 1989) (mouse, 1:20), A3 (mouse, 1:20), and R-15 (rabbit, 1:400) as primary antibodies for MyHC1, MyHC2a, SERCA1, and SERCA2a, respectively.
Muscle mass, fiber cross-sectional areas, total RNA, and total protein levels during both types of denervation
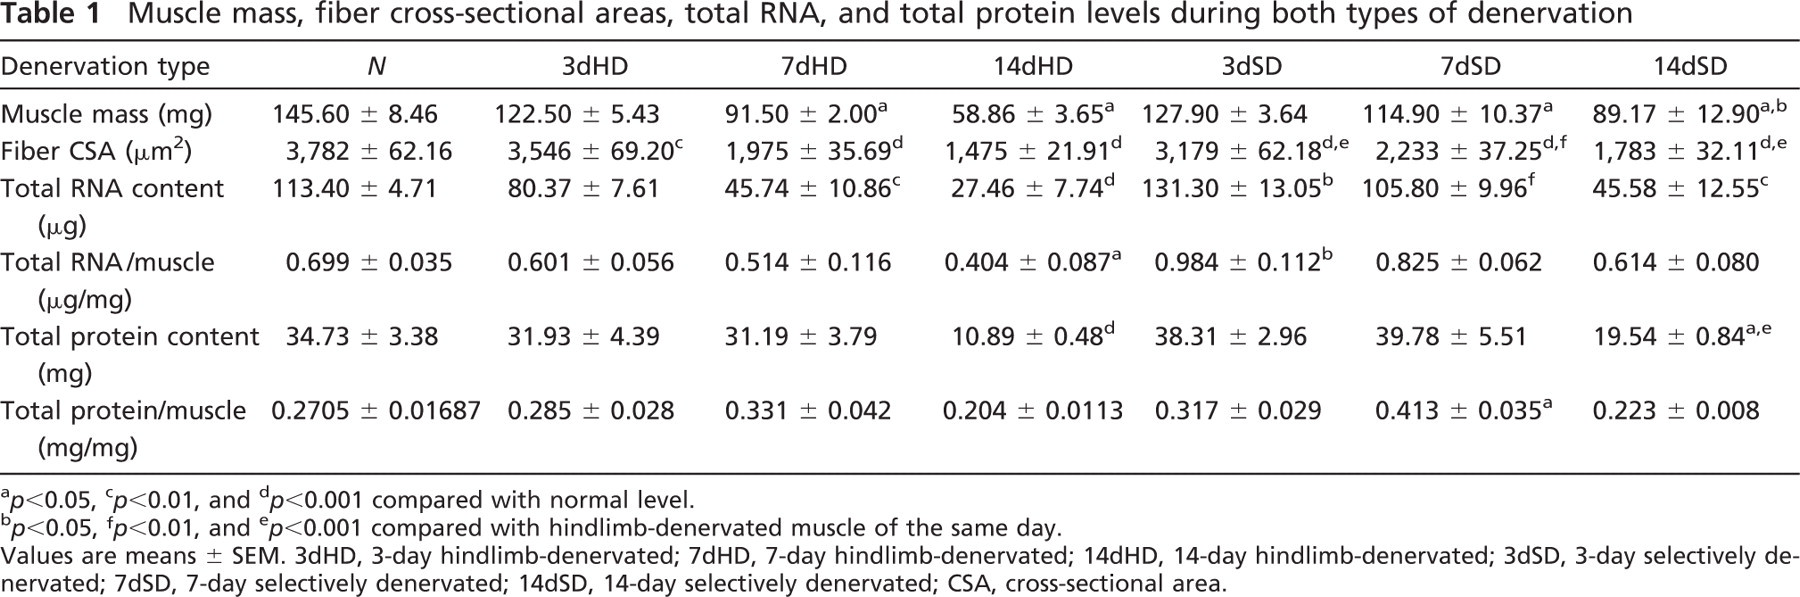
a p<0.05, c p<0.01, and d p<0.001 compared with normal level.
b p<0.05, f p<0.01, and e p<0.001 compared with hindlimb-denervated muscle of the same day.
Values are means ± SEM. 3dHD, 3-day hindlimb-denervated; 7dHD, 7-day hindlimb-denervated; 14dHD, 14-day hindlimb-denervated; 3dSD, 3-day selectively denervated; 7dSD, 7-day selectively denervated; 14dSD, 14-day selectively denervated; CSA, cross-sectional area.
Fiber Cross-sectional Areas
The cryosections were made in the same way as in immunocytochemistry. The sections were stained by hematoxylin-eosin. We calculated the fiber cross-sectional areas (CSAs) using Olympus DP-soft software, v3.2 (Olympus; Hamburg, Germany).
Statistics
All statistical analyses were made using Prism 3.0 software (GraphPad Software Inc.; San Diego, CA). We used t-tests to determine the significant differences. We considered p<0.05 significant, p<0.01 very significant, and p<0.001 highly significant.
Results
Fresh Weight, Fiber CSA, Total RNA, and Protein Levels
The muscle weight, fiber CSA, and protein and RNA content were measured in HD and SD soleus muscles. In both conditions of denervation, the fresh weight of the muscles decreased from Day 7 onward (Table 1); however, this decrease was less pronounced in SD than in HD muscles on Day 14 (p<0.05). Also, the fiber CSA was smaller compared with normal muscle at all stages in both types of denervation (Table 1). On SD, this decrease was larger after Day 3, whereas on HD, it was more pronounced after Days 7 and 14.
The RNA content decreased in HD soleus at Days 7 and 14, whereas in SD muscles, it decreased only after 2 weeks. Interestingly, in SD muscles, the RNA level increased first at Days 3 and 7 compared with the level in HD muscle (Table 1).
The total protein levels also decreased after 14 days in both types of denervation but more dramatically on HD than SD.
All together, the fresh weight, fiber CSA, and total RNA and protein contents decreased more after 2 weeks in HD than in SD soleus.
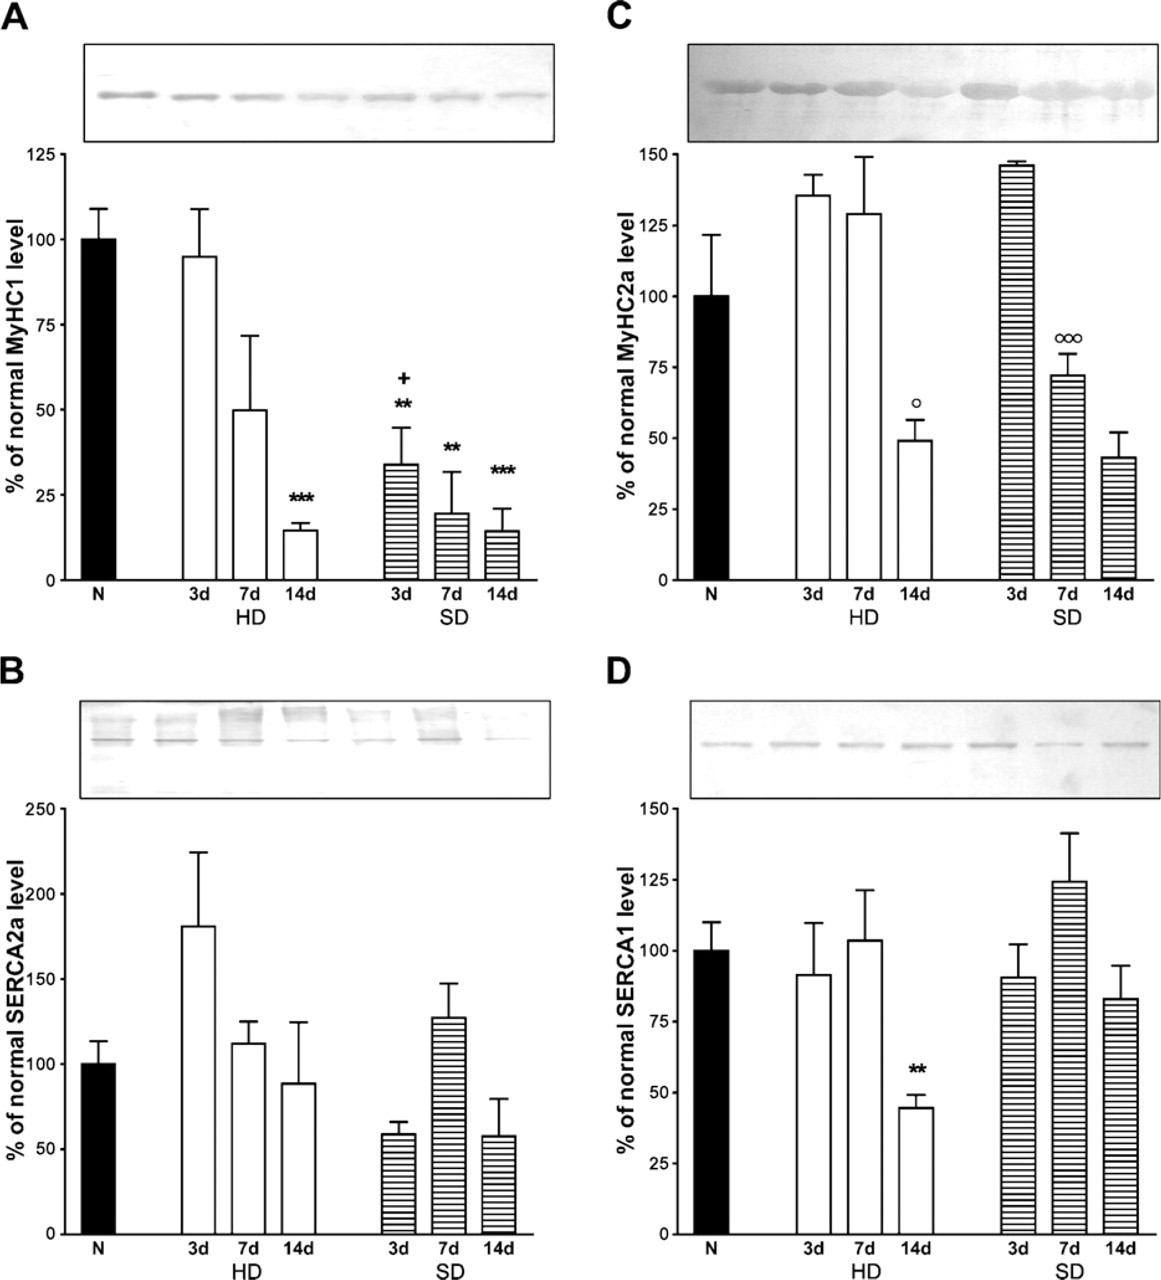
MyHC and SERCA protein levels of soleus muscles after HD and SD.
mRNA Levels
The slow-twitch MyHC1 mRNA level (Figure 1A) decreased in both types of denervation. This started already from Day 7 in HD and somewhat later on Day 14 on SD.
The level of the slow-twitch muscle-specific SERCA2a mRNA did not respond much to either form of denervation. Only on Day 7 of SD (Figure 1B) was it significantly elevated above normal and the HD counterpart (p<0.01).
The mRNA level of the fast oxidative MyHC2a (Figure 1C) changed differently in both types of denervation: it did not deviate significantly from the normal level in the HD group, whereas in the SD muscles, it increased on Days 3 and 7 compared with the HD muscles on the same days.
The level of the fast SERCA1 mRNA (Figure 1D) was significantly increased at Day 3 in HD soleus and at Days 3 and 7 in SD. Because SERCA1 exists in two splice variants, a neonatal SERCA1b isoform (lacking a 40-bp alternative exon) and an adult SERCA1a form, we also analyzed the level of both mRNAs separately, using ratio RT-PCR (Zádor et al. 1996). Both SERCA1a and SERCA1b mRNAs were amplified by the same pair of primers. The fragment amplified from SERCA1a was 40 bp longer than that of SERCA1b. Interestingly, whereas the level of the adult SERCA1a mRNA did not increase in any of the denervated muscles, the mRNA level of the neonatal SERCA1b was higher than normal in all stages of both treatments, except Day 14 of SD muscles. The increase of SERCA1b mRNA levels was higher in SD than in HD soleus muscles during the first week.
The MyHC2x mRNA levels (Figure 1E) showed a pronounced increase in both types of denervations, most remarkably on Days 3 and 7 in SD, when it was significantly higher than in the HD muscles.
The levels of GAPDH mRNA did not change during the denervations (Figure 1F), so it could be used as an adequate reference control level for total mRNA.
Protein Levels
The MyHC1 protein levels (Figure 2A) were affected differently depending on the type of denervation; it declined significantly only at Day 14 of HD, but it decreased remarkably in all stages of SD. It seems that the loss of MyHC1 protein is slower in HD muscles than in the SD muscles.
The SERCA2a protein levels (Figure 2B) were not significantly altered in either type of denervation. Of note, similar results were obtained when the SERCA2a protein levels were compared between normal and 14-day HD soleus of female rats of the same weight (Figure 3). The MyHC2a protein levels (Figure 2C) did not seem to change significantly compared with the normal level in any of the stages of both types of denervation. However, at Day 3, the protein density showed a tendency to rise in both denervation types and showed a significant decrease at Day 14 in HD and at Days 7 and 14 in SD compared with the previous stages of the same denervation.
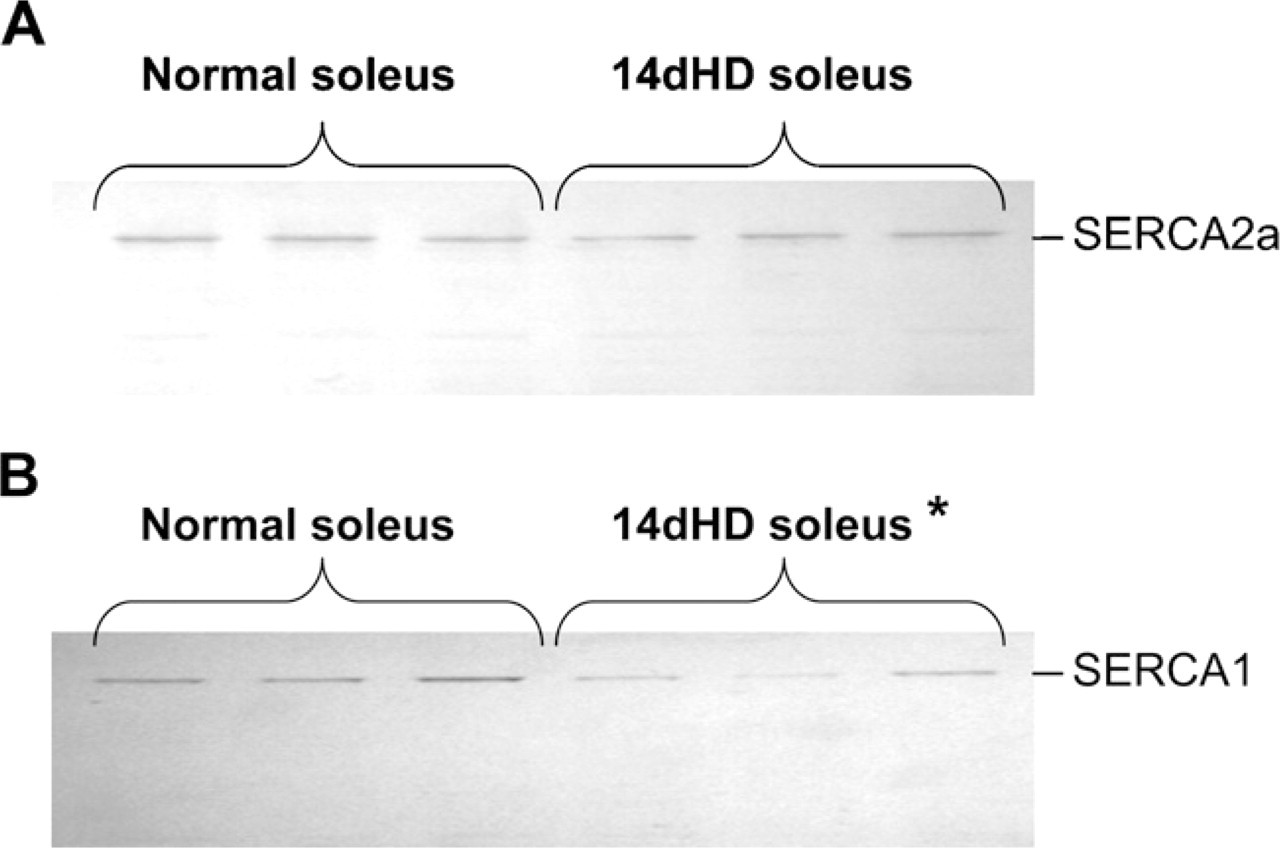
The effect of 14-day HD (14dHD) on SERCA isoforms in soleus of female rats (200-g weight).
The total SERCA1 (SERCA1a 1 SERCA1b) protein levels (Figure 2D) dropped significantly only at Day 14 of HD, but it did not change in SD soleus muscles. In 200-g female rats, the SERCA1 protein level was also significantly lower (41.81%; p = 0.0361) after 14 days in HD than in normal muscles (Figure 3).
IHC Results
MyHC Fiber Types
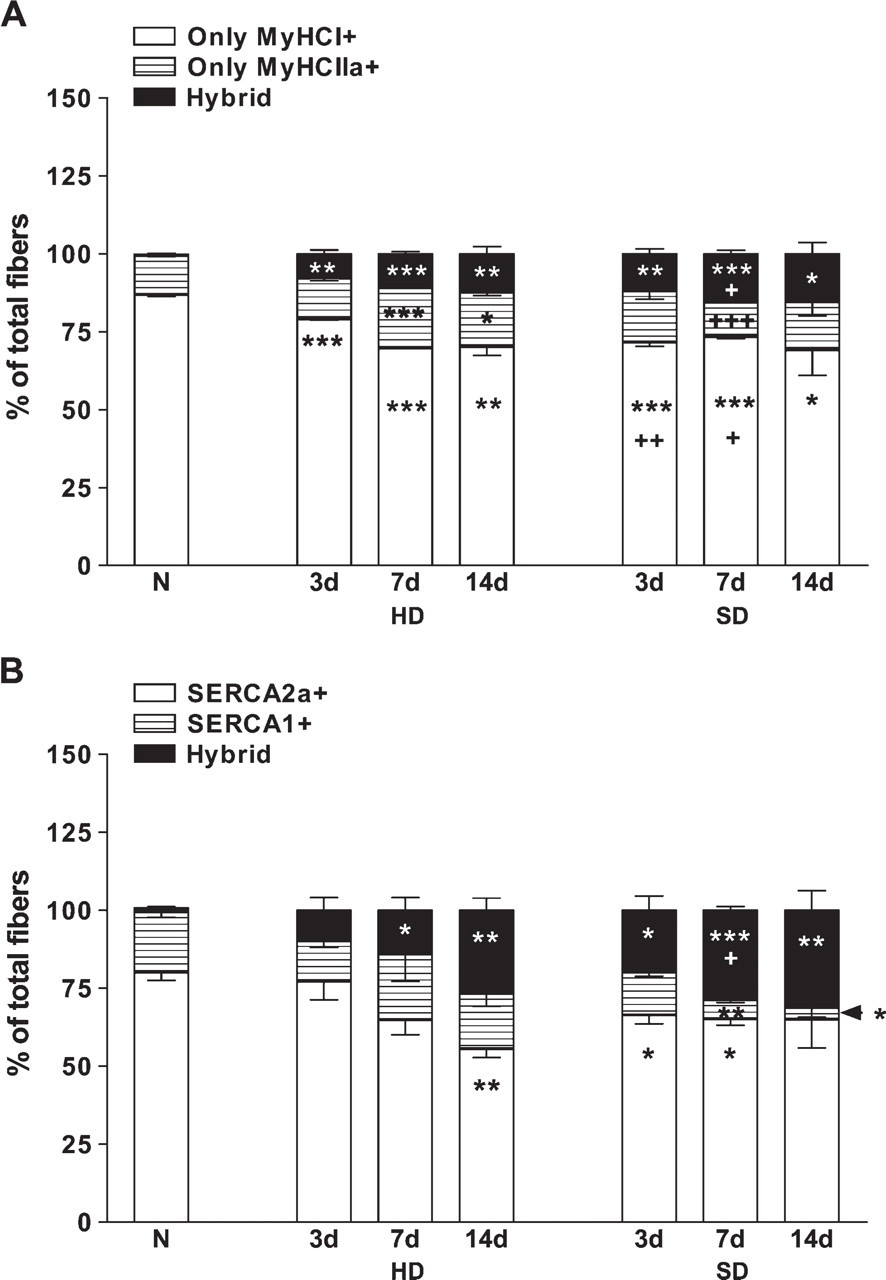
We counted fibers stained for MyHC1 and MyHC2a in both types of denervation (Figure 4). The percentage of slow MyHC1-positive type I fibers decreased in all stages of both types of denervation. The decrease was more pronounced in SD than in HD at Day 3 (Figure 5A). The percentage of Type I fibers was 7.39% of total fibers lower at Day 3 and 3.77% of total fibers higher at Day 7 in SD than in HD muscles. In agreement with this, the decrease in MyHC1 protein level was larger in the SD muscles compared with the HD ones (Figure 2A).
In HD muscles, the ratio of MyHC2a-expressing Type IIA fibers (Figure 5A) increased on Days 7 and 14 in comparison with normal soleus muscles. However, in SD muscles, the percentage of IIA fibers did not change compared with normal muscles. On Day 7, the ratio of Type IIA fibers differed significantly between HD and SD.
Hybrid Fibers
There were more MyHC-hybrid fibers (Figure 5A) in both types of denervation than in normal muscles. The numbers of MyHC-hybrid fibers were higher on Day 7 in SD soleus muscles than in HD muscles.
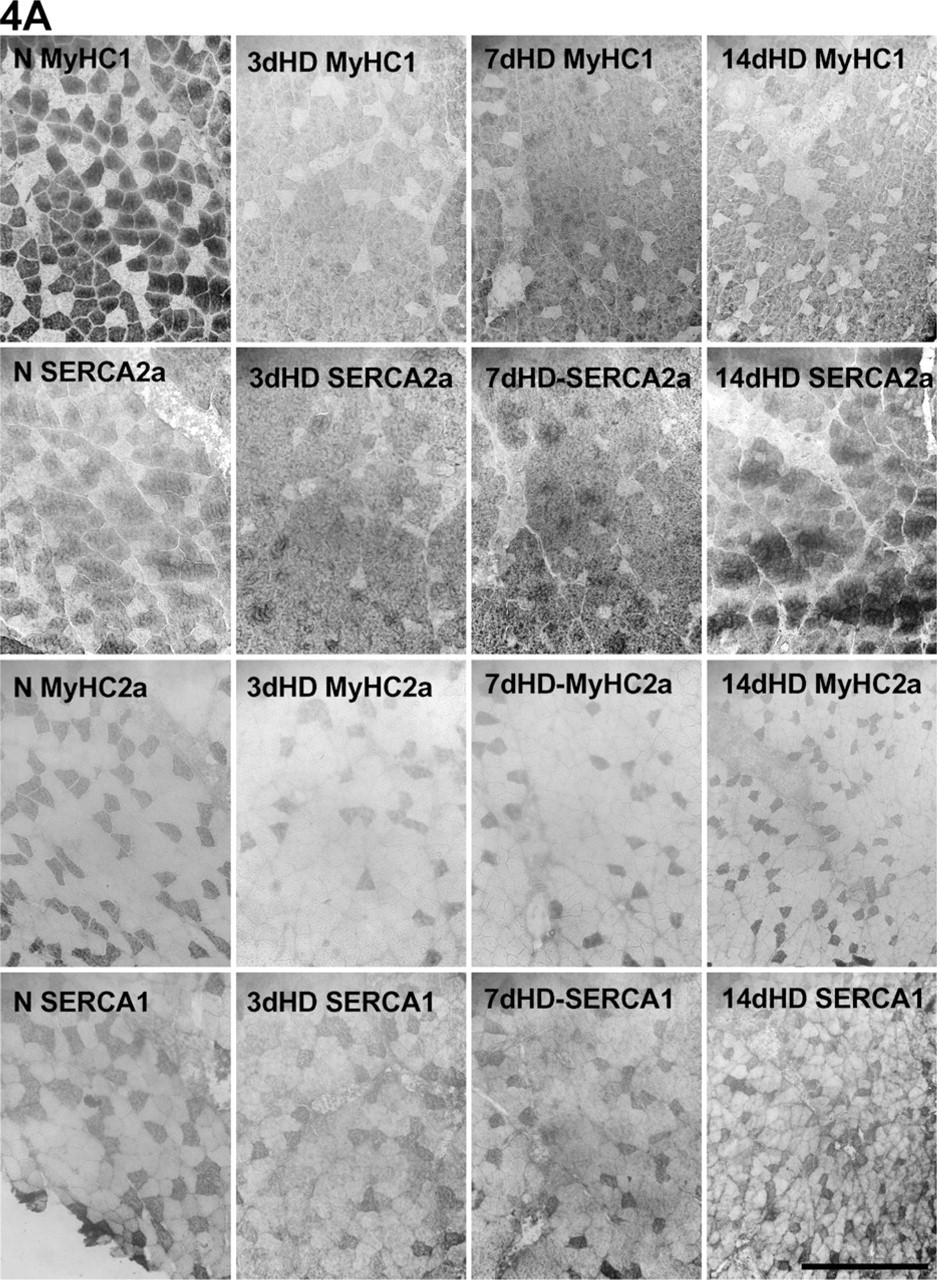
Fiber distributions of the MyHC and SERCA isoforms in HD and SD. Consecutive parallel sections of
SERCA Fiber Types
Parallel sections were also stained for SERCA1 and SERCA2a. The percentage of pure SERCA2a fibers (Figure 5B) decreased at Day 14 in HD, whereas in SD muscles, it was already lower at Days 3 and 7. The SERCA1-positive fibers (Figure 5B) changed (increased) only in SD at Days 7 and 14. Again, the number of SERCA-hybrid fibers increased in both types of denervation, but this was more pronounced in SD muscles (Figure 5B).
Coexpression of MyHCs With the Corresponding SERCAs
Next we explored to what extent the expression of the corresponding slow or fast isoforms of Ca2+ pumps and myosins remained correlated during denervation. First, we looked at the expressions of the slow isoforms. The correlation between SERCA2a-positive fibers and MyHC1-positive fibers was close in the normal muscles (r 2 = 0.987). In HD muscles, there was less correlation (r 2 = 0.222), and it totally disappeared in SD at Day 14 (r 2 = 0.00025; Figure 6A). Concerning the fast isoforms, the SERCA1-positive and MyHC2a-positive fibers retained a relatively close correlation during both types of denervation (Figure 6B; r 2 = 0.740 in normal muscles, r 2 = 0.623 in HD, and r 2 = 0.813 in SD).
Discussion
We used the effect of passive movement in selective denervation to highlight the difference in nerve control of expression of MyHC and SERCA isoforms. It is another novelty of our study that we showed this difference in the same non-regenerating muscles. It is clear that the relative expression levels of slow myosin isoform MyHC1 and slow Ca2+ pump SERCA2a are less coordinated in denervated soleus than in the normal muscle. Particularly, the mRNA and protein levels of MyHC1 decreased on denervation, whereas those of SERCA2a did not change or increased. This shows that SERCA2a is not directly dependent on the nerve in the normal soleus. Our results do not agree with the previous report of Schulte et al. (1994), who described a decline of SERCA2a after HD. However, Schulte et al. (1994) used female rats weighing ∼200 g, whereas we used male rats of ∼300 g. To make the comparison more relevant, we also measured the SERCA1 and SERCA2a protein levels in 200-g female Wistar rats after 14 days of HD, and we obtained similar results as from 300-g male rats (Figure 3). Therefore, the difference in the results of Schulte et al. (1994) and ours does not result from a difference in the sex and age of the rats but rather from the applied methodology. Schulte et al. (1994) used a cesium chloride gradient sedimentation method and Northern blot to extract and analyze RNA from pooled muscles (four in normal muscles and six in denervated muscles), whereas we used the shorter version (Gauthier et al. 1997) of the acid guanidium-phenol-chloroform method (Chomczynski and Sacchi 1987) and RT-PCR with specific primers to detect the mRNA levels in the individual muscles. In our view, our analysis is more adequate to calculate statistical differences in SERCA mRNA levels than those of Schulte et al. (1994).
Expression of (
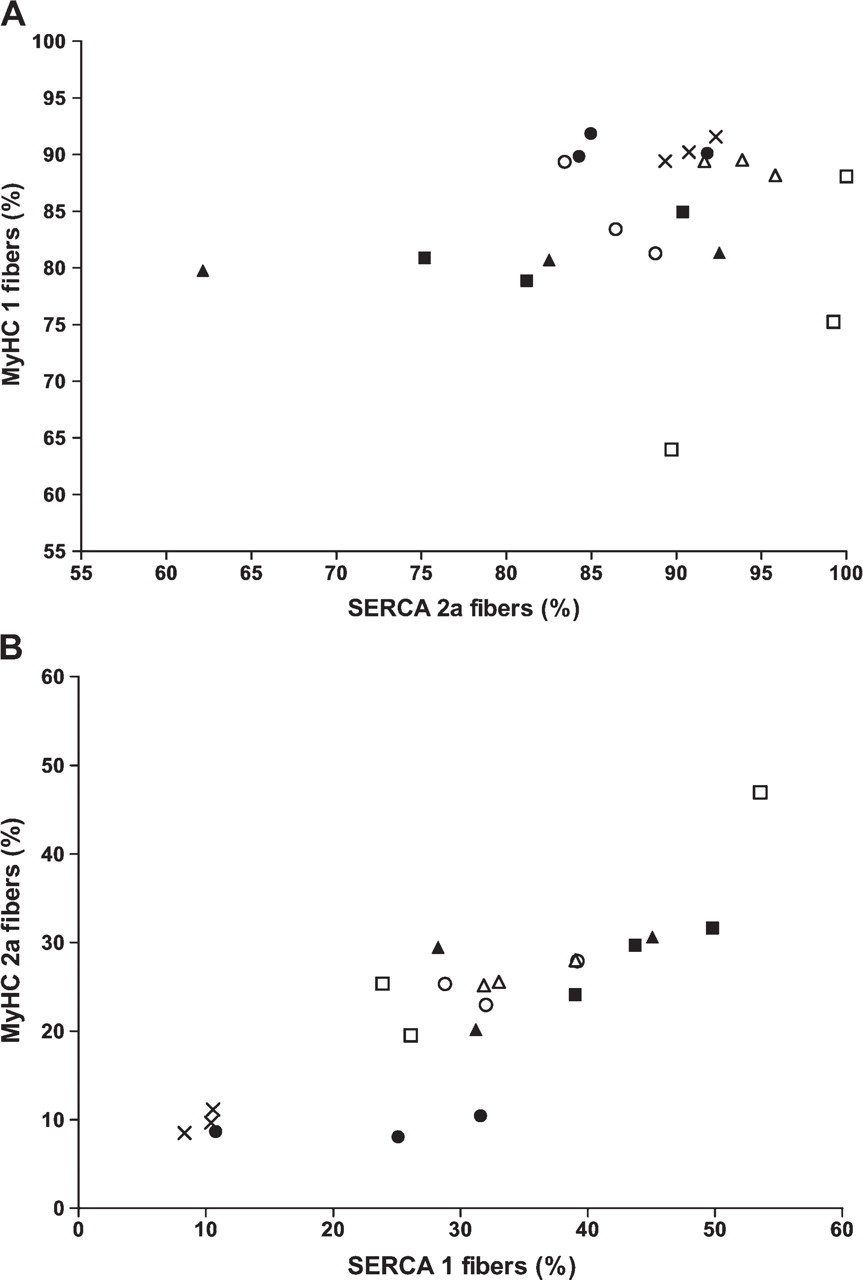
Correlation between SERCA and MyHC isoforms in different types of denervations. The results are shown in individual soleus muscles. (
The analysis of SERCA protein levels in Schulte et al. (1994) was also different than in our study; they extracted SERCA from microsomes and large membrane fractions. We used the pellet of the first centrifugation for MyHC extraction, whereas the supernatant was further sedimented to obtain the mitochondrial-sarcoplasmic reticulum and microsomal fractions (Zádor et al. 1998).
Unlike in Schulte et al. (1994), we did not relate the amount of SERCA proteins to standards (Kandarian et al. 1994). In our study, the samples represented the same proportion of each muscle. We chose this method to eliminate one source of errors, because the total protein content was more variable in the denervated than in the normal muscle extracts.
The lack of decrease in SERCA2a expression (mRNA and protein) on denervation that we observed is in agreement with a corresponding absence of changes in SERCA2a levels in spinal cord isolation (Zhong et al. 2002), in spinal cord transsection (Talmadge and Paalani 2007), in regenerating-denervated muscles (Zádor and Wuytack 2003; Zádor et al. 2005), and in overloaded soleus muscles (Awede et al. 1999).
In contrast to SERCA2a, the level of SERCA1 clearly decreased in the soleus after 2 weeks of denervation. This means that the changes in the level of the fast muscle–specific Ca2+ pump were also not coordinated with those of the fast-type MyHC2a, because the latter remained unchanged on denervation. However, at the level of the fibers, the coordination of expression of SERCA1 and MyHC2a was stronger than that of SERCA2a and MyHC1.
It is worthwhile to note that, independently from the protein, both SERCA1 mRNA isoforms were increased at 3 days of denervation. A similar increase of these mRNAs can be induced by stretch (Zádor et al. 1999, 2007). SD increased the mRNA level of both SERCA and MyHC isoforms compared with HD. This implies that there exist layers of regulation of gene expression at the mRNA and the protein level that might act differently and independently (Leberer et al. 1986; Huey and Bodine 1998).
The largest discrepancy in coordinated protein expression was found when, on SD, the MyHC1 protein level dramatically decreased, whereas the SERCA2a did not change. This drop in the level of MyHC1 protein was more than could be expected from a lack of maintenance by innervation; it indicated that a selective degradation of MyHC1 protein accompanied the slow-to-fast transformation in the muscle adapting to passive movement. A parallel drop in the level of SERCA2a was not observed, again showing that myosin and Ca2+ pumps respond differently to passive movement.
On denervation, the number of MyHC1-positive and SERCA2a-positive fibers decreased more or less together, but, for both types of denervation, after 14 days, the coordination in expression of these isoforms was practically lost. The loss of coordination was more pronounced in selective denervation. A similar, but much less pronounced, loss of coordination was observed in both denervations for the fast isoforms: MyHC2a and SERCA1. The loss of coordinated expression resulted in the appearance of hybrid fibers. The ratio of MyHC1-MyHC2a hybrid fibers, SERCA1-SERCA2a hybrid fibers (Figure 5), and mismatch fibers (expressing MyHC1, SERCA1, MyHC2a, and SERCA2a) increased after 7 or 14 days in both types of denervation. More SERCA-hybrid fibers than MyHC-hybrid fibers were found in SD soleus than in HD muscles, and SERCA-hybrids appeared earlier. This also shows that the expressions of MyHC and SERCA are differentially regulated.
At longer term (i.e., denervation of >72 days), the coexpression of the corresponding myosin and SERCA isoforms again match (Hämäläinen and Pette 2001). A likely explanation for this is that the general atrophy reduces both MyHC1 and SERCA2a levels with a different time course. Another explanation could be that the structure of the sarcoplasmic reticulum that houses the SERCA is nerve activity dependent (Heck and Davis 1988; Salvatori et al. 1988) and thereby indirectly affects the expression/stability of SERCA2a. The regulation of gene expression for myosin heavy chains and SERCAs are also likely to be different (i.e., the slow myosin promoter is activated by MEF-2D, MyoD, p300, and the calcineurin/NFATc1 pathway) (Meissner et al. 2007); similar but different upregulators, MEF-2C and NFATc4, have been reported for the SERCA2a promoter (Vlasblom et al. 2004). In addition, in regenerating muscle, the MyHC1 protein mostly follows its transcript level, whereas the SERCA2a is largely controlled post-transcriptionally (Zádor and Wuytack 2003).
In conclusion, the expression of SERCA and myosin isoforms seems to be separately controlled by a unique set of regulatory factors in the soleus muscle. The slow innervation is a major controller for the slow type myosin, whereas the fast myosin (MyHC2a) is expressed more when the slow myosin is decreased. Disappearance of the slow myosin isoform on denervation is, however, not balanced by an equimolar replacement of the fast isoform. Therefore, the switch of SERCA2a to SERCA1a isoform does not coincide with the slow-to-fast switch of the myosin isoforms. As a consequence, the slow-type SERCA is not expressed in coordination with the slow type myosin in many of the fibers, and there are more SERCA-hybrid fibers than myosin-hybrid fibers.
Footnotes
Acknowledgements
This work was supported by the TéT B-20/04 in Hungary and the BIL 02/18 from the Ministerie Vlaamse Gemeenschap, Belgium.