
Abstract
Brush cells occur in the epithelium of the small intestine and in various other epithelia of endodermal origin. Ultrastructural and histochemical characteristics suggest that they represent sensory cells. Because the apical membrane of brush cells might be involved in and specialized for (chemo-)receptive functions, we investigated the composition of the glycocalyx and compared it with that of enterocytes. Ultrathin sections of murine small intestine were labeled with a panel of eight lectins. Their binding sites in the brush border and on vesicles of the apical cytoplasm were detected by colloidal gold and quantified using image analysis. The glycocalyx of brush cells contained significantly higher amounts of L-fucose residues than that of enterocytes, as detected by the lectins UEA-I and LTA. In contrast, most of the other lectins bound more avidly to the glycocalyx of enterocytes. The cytoplasmic vesicles closely resembled the apical membrane in their labeling pattern. Quantitation of the brush cells' distribution revealed that the epithelia of the Peyer's patches contained 10-fold higher numbers of brush cells than the small intestinal mucosa distant from lymphoid tissue. We conclude that brush cells possess a glycocalyx with a specialized composition and differ significantly from enterocytes. Because similar peculiarities of the apical membrane have previously been described for sensory cells of the olfactory and gustatory organs, this study provides further evidence in favor of a sensory function of brush cells.
Keywords
B
Because brush cells resemble receptor cells of the taste buds in their ultrastructure, it has repeatedly been hypothesized that brush cells are chemoreceptors (Rhodin and Dalhamn 1956; Silva 1966; Luciano et al. 1968). This assumption has recently been supported by the observation that brush cells of the pancreatic duct, stomach, and intestine contain α-gustducin, a G-protein that is associated with the sweet and bitter gustatory function of taste receptor cells (Höfer et al. 1996; Wong et al. 1996; Höfer and Drenckhahn 1998). It can be assumed that, in brush cells, not only the cytoskeleton and the signal transduction pathways possess peculiarities but also the apical membrane, which is in direct contact with the sensed milieu. Freeze-fracture studies revealed that the apical membrane of brush cells is enriched in cholesterol but relatively poor in intramembranous particles (Trier et al. 1987; Gebert and Bartels 1987; Luciano and Reale 1997). In addition, thin-section electron microscopy showed that brush cells at various locations possess a thinner glycocalyx than the neighboring cells (Luciano et al. 1968; Isomäki 1973; Luciano and Reale 1990), and lectin uptake experiments suggest that differences exist in the composition of the glycocalyx between brush cells and enterocytes (Clark et al. 1995). In this study we investigated the composition of glycoconjugates in the membranes of intestinal brush cells at the ultrastructural level.
To characterize the glycocalyx of brush cells and to compare its composition with that of ordinary enterocytes, we used a panel of lectins specific for those terminal saccharides that typically occur on epithelial cells (Table 1). The lectins selected are known to reliably bind on ultrathin plastic sections and possess well-characterized specificities (for references see Table 1). Brush cells are relatively rare in the intestine and, by light microscopy, are difficult to identify and distinguish from other cell types, such as enteroendocrine cells or cup cells (Isomäki 1973; Nabeyama and Leblond 1974). We therefore investigated ultrathin sections and performed highly standardized lectin labeling procedures using colloidal gold as a marker. This method provides several advantages for quantitation of the labeling densities (Bendayan 1995). Because the lectins bind to the section surface only, the densities measured are not affected by the thickness of the section. In addition, gold particles of uniform shape and size allow the labeling densities to be counted automatically using simple image analysis systems without further calibration or standards. Furthermore, the relatively constant geometry of brush cell and enterocyte microvilli enabled us to develop a mathematical model and thereby eliminate the influence of the cell shape on the densities measured. This study shows that the two cell types differ considerably in the composition of most glycoconjugates, with a few lectins binding preferentially to brush cells and most of the other lectins binding more avidly to enterocytes.
Materials and Methods
Animals
Eleven BALB/c mice of both sexes kept under specified pathogen-free (SPF) conditions, 4-8 weeks old and weighing about 20 g, were anesthetized
Tissue Preparation
The samples were fixed in a solution of 2% formaldehyde and 0.05% glutaraldehyde (grade I; Sigma, Deisenhofen, Germany) in 0.1 M phosphate buffer, pH 7.3, for 4-16 hr at 4C. They were then rinsed in PBS containing 1% L-lysine (Sigma) for 16 hr to block free aldehyde groups. The specimens were partially dehydrated in graded ethanol series (30%, 50%, 70%, 90%) and transferred to LR White resin, medium grade (Plano; Marburg, Germany). The tissue blocks were enclosed in gelatin capsules and allowed to polymerize at 50C for 48 hr. Ultrathin sections were cut and mounted on formvar-coated nickel grids.
Lectin Labeling
The lectin-gold labeling was performed in PBS containing 1.5% bovine serum albumin-c (BSA-c; Biotrend, Cologne, Germany) and 0.1% sodium azide. Free aldehyde groups were blocked for 15 min in a drop of this buffer (PBS-BSA) containing 0.7% L-lysine. After rinsing in PBS containing 5% bovine serum albumin (Serva; Heidelberg, Germany), 0.1% cold water fish skin gelatin (Biotrend), 1% normal goat serum (Sigma), and 0.05% Tween 20 (Serva), the sections were incubated with PBS-BSA containing one of the biotinylated lectins (see Table 1) at 4C overnight. After rinsing, the grids were incubated for 4 hr with a goat anti-biotin antibody (1:50) conjugated to 20-nm colloidal gold (Bio-Cell; Cardiff, UK). Finally, the grids were treated with 2% glutaraldehyde in PBS, washed in distilled water, and stained with uranium acetate and lead citrate. The sections were examined in a Zeiss EM10 electron microscope (Zeiss; Oberkochen, Germany). Controls were carried out by omitting the lectin and by preincubating the lectin with the corresponding mono- or disaccharide overnight (see Table 1).
Lectins, specificities, and concentrations a
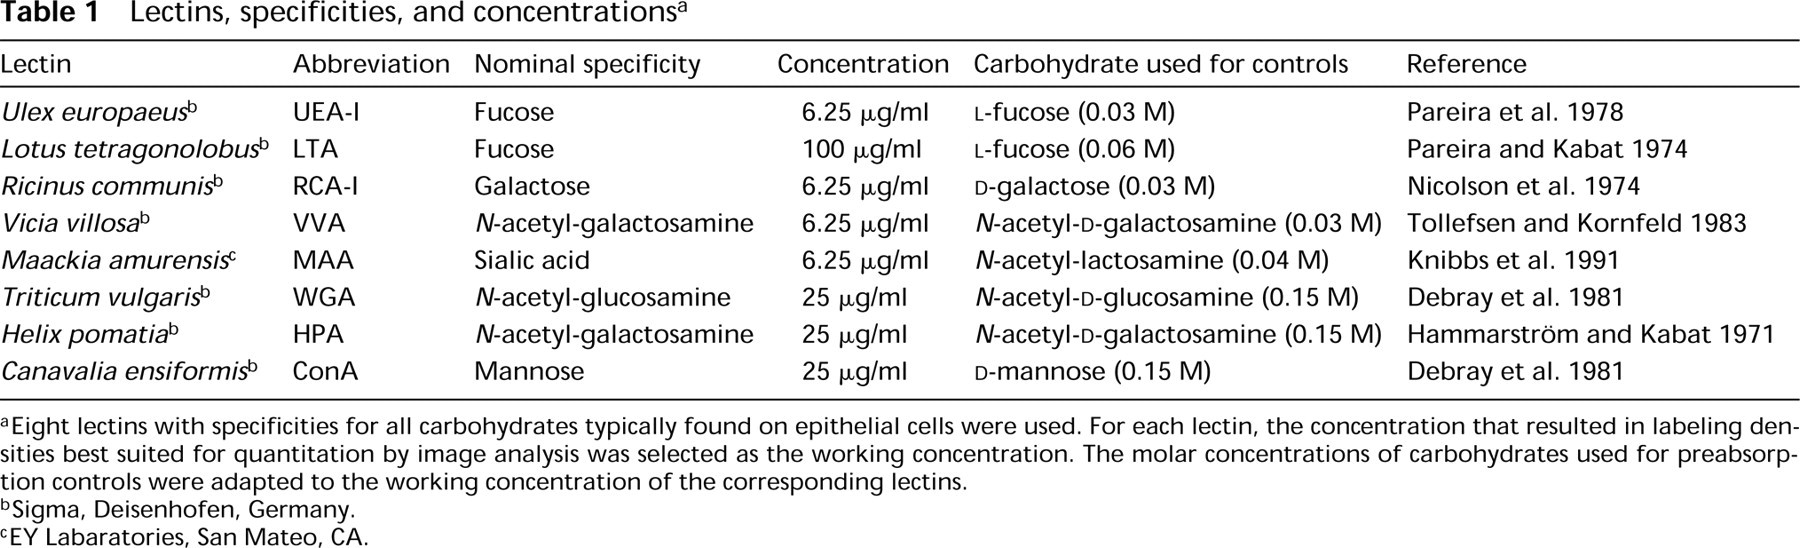
aEight lectins with specificities for all carbohydrates typically found on epithelial cells were used. For each lectin, the concentration that resulted in labeling densities best suited for quantitation by image analysis was selected as the working concentration. The molar concentrations of carbohydrates used for preabsorption controls were adapted to the working concentration of the corresponding lectins.
bSigma, Deisenhofen, Germany.
cEY Labaratories, San Mateo, CA.
Quantitative Analysis
To quantify the labeling density of gold particles on the brush border and cytoplasm, electron microscopic photographs were taken at a standardized magnification of 12,500-fold. The negatives were digitized in transmitted light mode using a Duoscan scanner (Agfa; Leverkusen, Germany) at a resolution of 1000 dots per inch. The 8-bit gray scale datasets, each containing about 8 megabytes, were stored and analyzed on standard PCs using the image analysis software UTHSCSA ImageTool, version 2.0 alpha, which is freely available in the internet (http://ddsdx.uthscsa.edu). An ImageTool program (a so-called “script”) was written by the authors which allowed a region of interest (ROI) to be drawn that contained the brush border or a part of the cytoplasm of individual cells. The program then determined the area of the ROI and detected and counted gold particles of a defined size, e.g., particles with an area of 314 ± 100 nm2 for 20-nm colloidal gold.
Labeling densities measured by this method for the glycocalyx of the brush border may not only depend on the composition of glycoconjugates detected by the lectins but are also influenced by the size and arrangement of the microvilli. Because the geometry of the brush borders of the two cell types investigated was relatively constant, a mathematical model was developed to determine the influence of the different microvillous diameters and distances between brush cells and enterocytes (Figure 1). In cross-sections (Figure 2), the average diameter of enterocyte microvilli was 95 nm (SD 10 nm; n = 50) and the minimal distance between neighboring microvilli was 20 nm (SD 7 nm; n = 34). The diameter of brush cell microvilli was 139 nm (SD 17 nm; n = 58), and their minimal distance was 18 nm (SD 9 nm; n = 30). Given a hexagonal arrangement of microvilli, the relative length of microvillous membranes per area was calculated for each cell type using the formulas shown in Figure 1. The quotient of the two values was 1.29, i.e., the length of the apical membrane and glycocalyx in a defined area of a thin section was 29% greater in enterocytes than in brush cells. This correction factor was then used to calculate labeling densities (“corrected densities”) that were no longer affected by the differing geometries of the two cell types. Corrected labeling densities were compared using the Mann-Whitney rank sum test (U-test) at a significance level of 0.05.
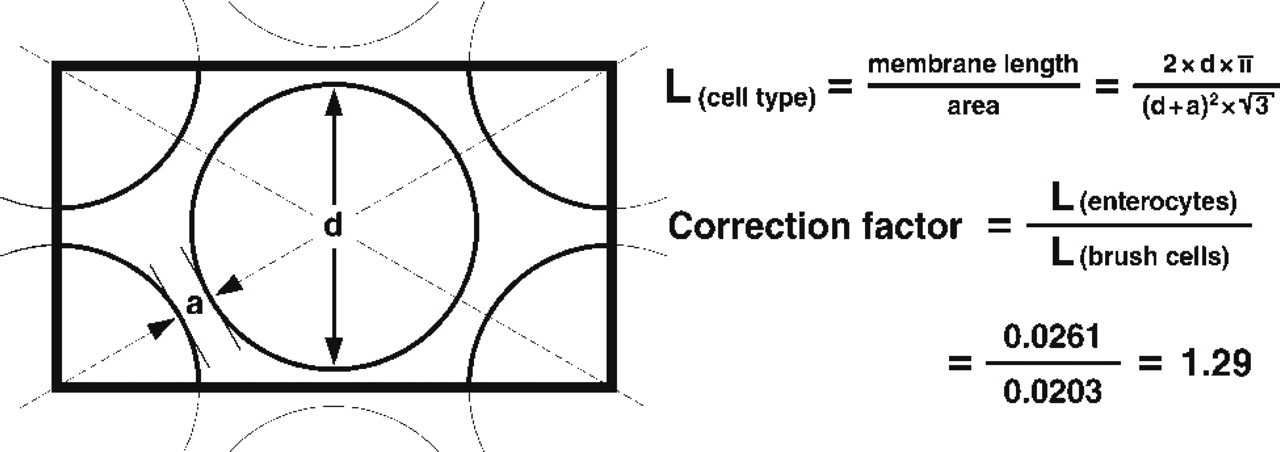
The microvilli of brush cells and enterocytes are arranged in approximately hexagonal patterns, but differ in their diameters (d) and in the minimal distances between the microvilli (a). A cross-sectional model was used to determine the relative length of membrane (L) in a defined region of interest (rectangle). The relative membrane length of enterocytes exceeds that of brush cells by 29%, so that the (raw) densities measured for brush cells were multiplied with a correction factor of 1.29. Hence, the resulting “corrected densities” are only marginally affected by the geometrical differences of the two cell types.
Results
Brush Cells
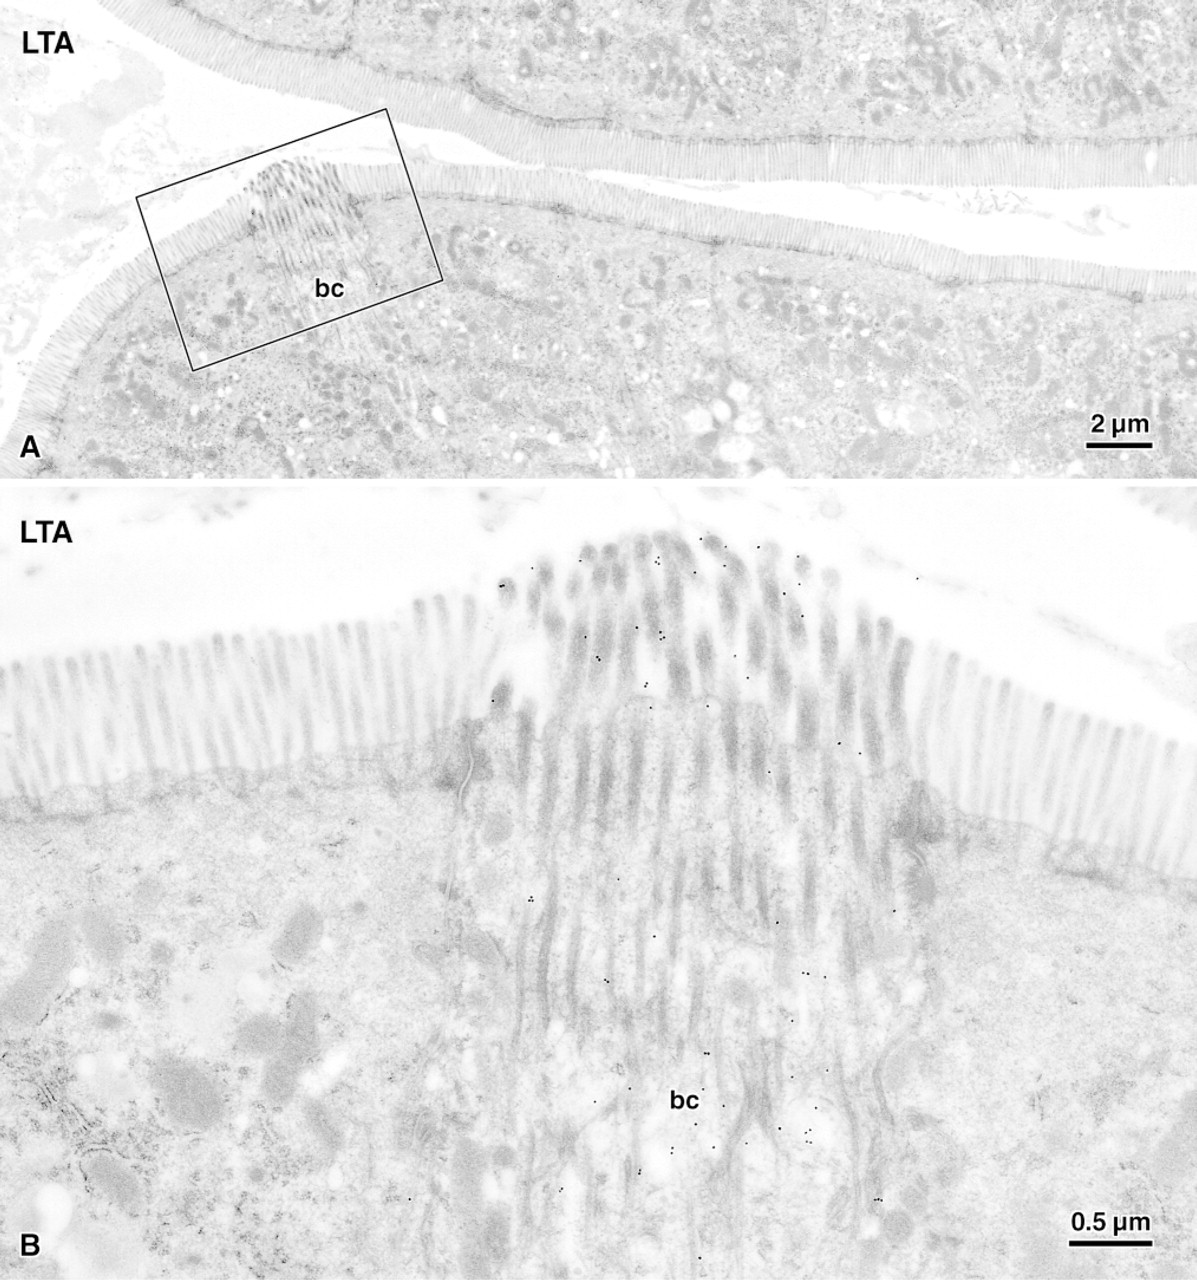
In LR White ultrathin sections of the small intestine, brush cells were identified and distinguished from enterocytes by their typical ultrastructure. The microvilli of the brush cells were thicker and more electron-dense than those of neighboring enterocytes (Figure 2). They contained microfilament rootlet bundles which extended deeply into the apical cytoplasm; many electron-lucent vesicles and tubules lay between these filament bundles (Figure 3). At the periphery of the cell apex and in the remaining cytoplasm, bundles of intermediate filaments lay close to the lateral plasma membrane, where they inserted at many desmosomes. The perinuclear cytoplasm of the brush cells possessed the typical pear-like shape and, in contrast to enteroendocrine cells, lacked electron-dense granules. The brush cells comprised only a very small portion of the intestinal epithelium and appeared to be more numerous on the villi than in the crypts. Interestingly, the Peyer's patches contained considerably more brush cells than distant villi. Whereas seven section profiles of Peyer's patch domes counted for this purpose contained 17 brush cells and 2805 other epithelial cells (0.61%), the section profiles of 12 villi contained only 2 brush cells and 3596 other epithelial cells (0.06%). The Peyer's patch and the villous brush cells did not apparently differ in structure or lectin binding characteristics.
Gold Labeling and Quantitation
The binding of eight lectins to enterocytes and brush cells of the intestinal epithelium was determined using on-section gold labeling and quantitative image analysis. Depending on the binding specificity and the avidity of the lectin used, the labeling densities of the brush border differed considerably (Figure 4). Because high labeling densities of colloidal gold may cause spatial hindrance, some of the lectins (UEA-I, RCA-I, VVA, MAA) were used at a fourfold higher dilution than our standard concentration of 25 μg/ml. Because LTA at this standard concentration showed labeling densities near zero, it was used for quantitative evaluation at a fourfold higher concentration. To exclude the possibility that quantitative differences between the two cell types were due to variation in the labeling procedure, on each photograph of a brush cell an adjacent enterocyte was included in the quantitation. In additional tests, consecutive ultrathin sections running through the same cells were separately labeled, photographed, and analyzed. However, the differences in the labeling densities between brush cells and enterocytes of the same ultrathin section typically exceeded that of the same brush cell found in adjacent but separately labeled sections by 500% or more. To compare the labeling density in the glycocalyx of brush cells with that of enterocytes, a correction factor was used which minimized the influence of the differing brush border geometries (Figure 1). This correction did not influence the statistical significance of the differences found for seven of the lectins. In principle, visual examination of the gold labelings in the electron microscope closely corresponded with the densities determined by computer-based image analysis.
Longitudinal (
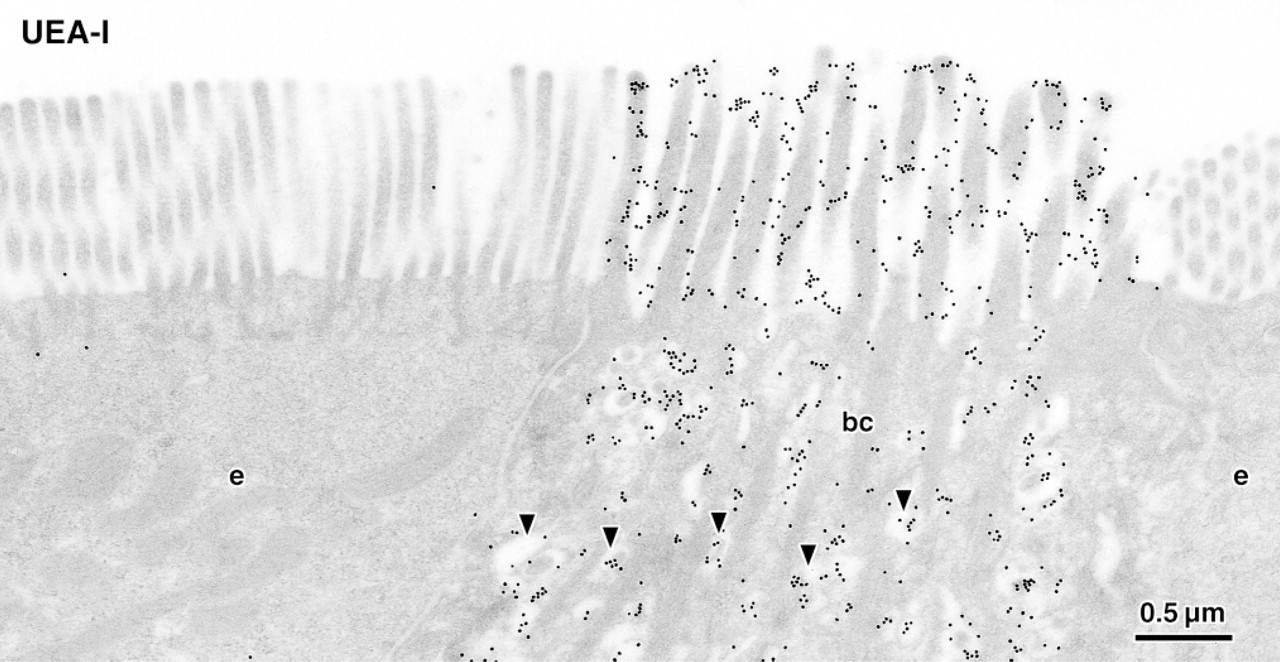
Brush cell (bc) and adjacent enterocytes (e) labeled for α-L-fucose residues using the lectin UEA-I and 20-nm colloidal gold. Whereas the brush border of enterocytes remains almost unlabeled, the glycocalyx of the brush cell intensely binds the lectin. Note that the membranes of vesicles (arrowheads) lying between filament bundles in the apical cytoplasm are densely labeled. Quantitative image analysis revealed that the labeling densities of these cytoplasmic regions were closely correlated with that of the brush border.
Lectin Binding Properties of Brush Cells and Enterocytes
The lectins used in this study preferentially bound to the brush border of the gut epithelium. They differed considerably in their binding to the two cell types investigated (Figure 4). Quantitative analysis enabled three groups to be distinguished: lectins that preferentially bound to the glycocalyx of brush cells, lectins that preferentially bound to that of enterocytes, and a lectin that bound to the two cell types with densities that were not statistically different. These lectin binding patterns were uniformly found in all of the 11 mice investigated.
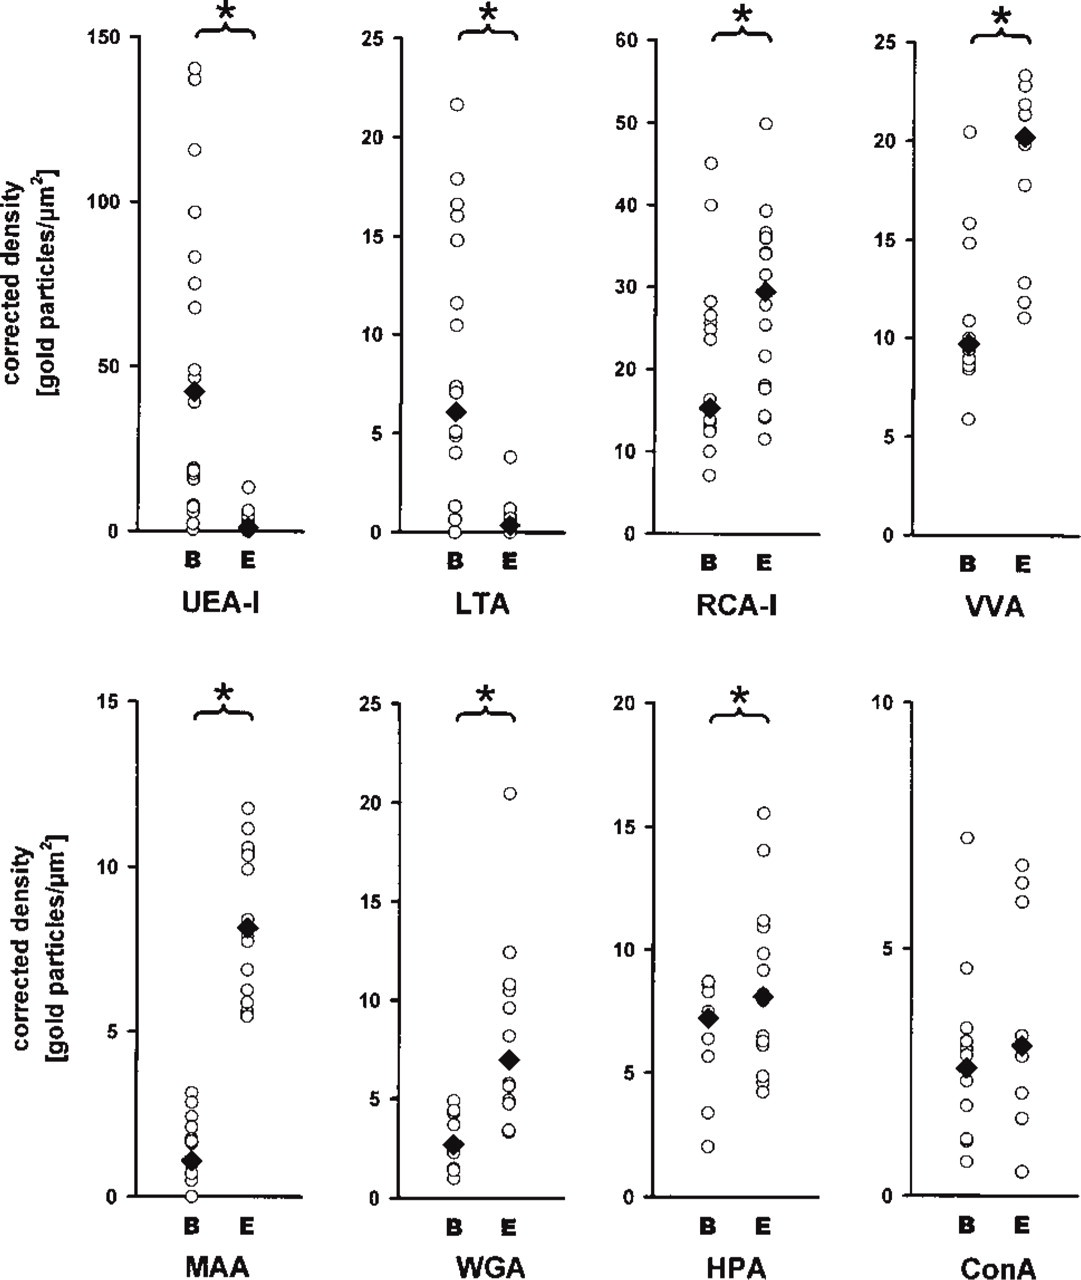
Quantitation of the labeling densities on brush cell (B) and enterocyte (E) microvilli as determined by image analysis. Each circle represents the labeling density in the region of interest of an individual cell; black rhombs indicate medians. Statistically significant differences, as determined by the Mann-Whitney rank sum test at a significance level of 0.05, are indicated by asterisks. The densities measured on the microvilli of brush cells have been corrected according to the geometrical model (see Figure 1). This allows influences of the microvillous geometry on the densities measured to be reduced or eliminated. Significantly higher labeling densities on brush cells than on enterocytes are detected for UEA-I and LTA. In contrast, the lectins RCA-I, VVA, MAA, WGA, and HPA bound more avidly to enterocytes. No differences were found for ConA. Note that the absolute values of the corrected densities considerably differed among the eight lectins, so that the y-axis has been scaled for each lectin to display the full range.
Preferential binding to the glycocalyx covering the microvilli of brush cells compared to that of enterocytes was found for the lectins UEA-I (Figure 3) and LTA (Figure 5). The absolute labeling density of UEA-I, however, was sevenfold higher than that of LTA (compare Figures 3 and 5), even at the 16-fold higher dilution of UEA-I used for quantitation. In addition to the brush border, UEA-I and LTA also bound to the small electron-lucent vesicles lying between the filaments that extended from the microvilli into the apical cytoplasm (Figures 3 and 5). Because of the differing geometries of microvilli and vesicles, the labeling densities on the glycocalyx and on the vesicle-containing cytoplasm could not be compared directly. Quantitation, however, revealed that the labeling densities of the two regions correlated closely (Figure 6). The basal cytoplasm, the basolateral membrane, and the nuclei of both brush cells and enterocytes remained almost unlabeled.
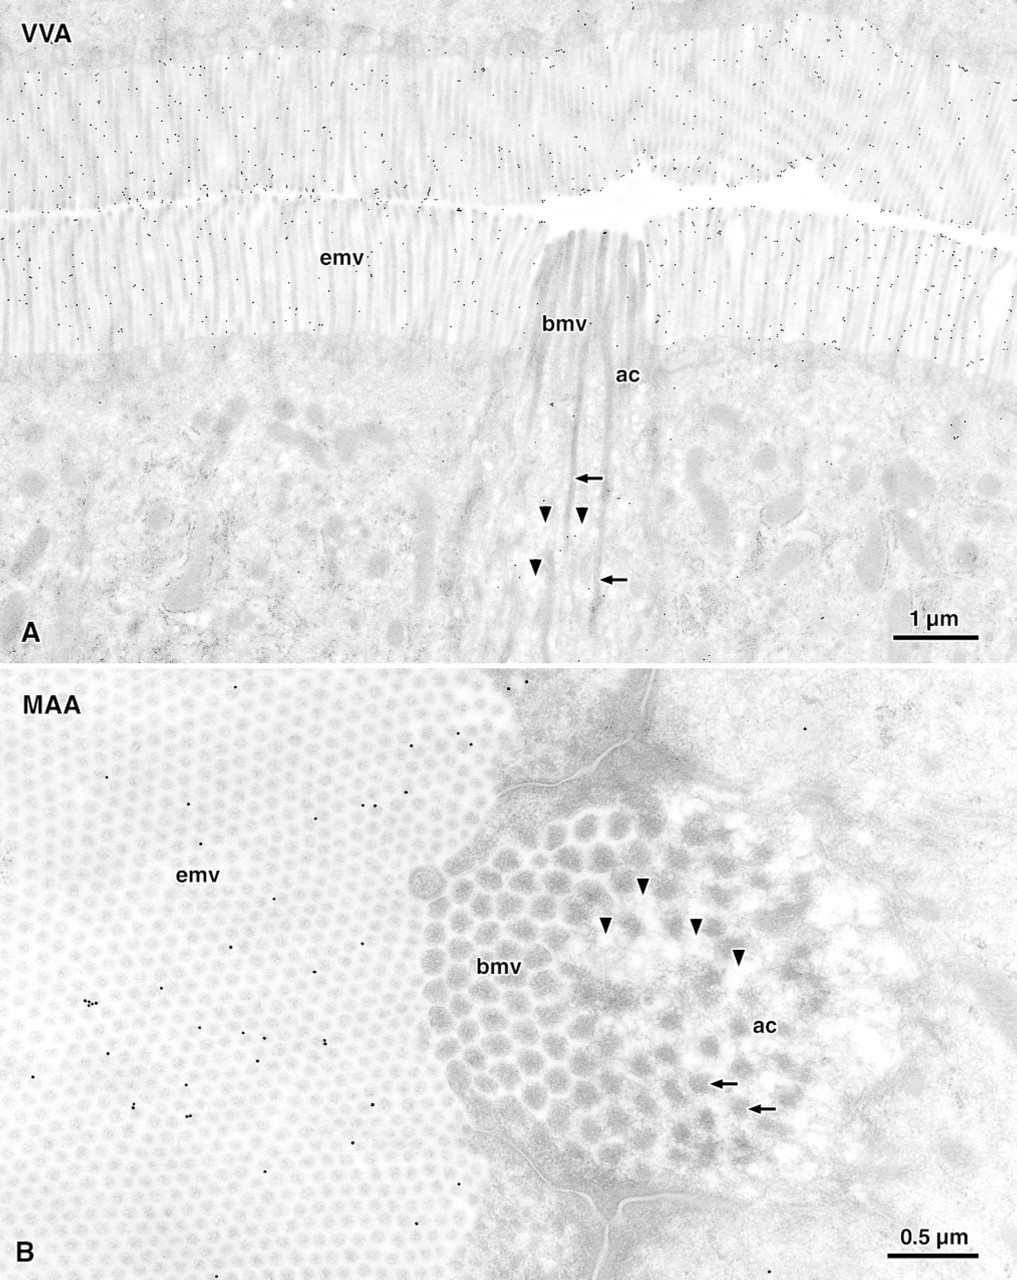
Preferential binding to the brush border of enterocytes was found for RCA-I, VVA, MAA, WGA, and HPA (Figure 4). Of these lectins, RCA-I and VVA bound most avidly to the enterocytes with labeling densities of 30 and 20 particles/μm2, respectively (Figure 2A). MAA revealed the clearest difference between the two cell types, showing an approximately eightfold higher binding to enterocytes than to brush cells (Figure 2B). The lectins WGA and HPA revealed only small but statistically significant differences in the corrected labeling densities.
Although ConA labeled the enterocytes at slightly higher (raw) densities, the corrected values did not allow statistical differences between brush cells and enterocytes to be detected. In contrast to all other lectins studied, ConA bound to the cytoplasm of the epithelial cells to roughly the same extent as to the brush border.
Controls
Preabsorption of the lectins with their corresponding saccharides (see Table 1) resulted in drastic reductions in lectin binding to all tissue elements. The binding of most lectins (UEA-I, LTA, RCA-I, WGA, HPA, and ConA) was reduced by 99% or more. The lectins VVA and MAA were reduced by preabsorption with their corresponding saccharides by 93% and 71%, respectively. Replacing the lectin with buffer during the labeling procedure reduced the densities measured over lectin-positive tissue elements by 99% or more (not shown).
Discussion
The results show that brush cells of the small intestine possess peculiarities in the composition of their glyco-alyx and thereby differ considerably from enterocytes. Quantitative evaluation of on-section lectin gold labeling revealed, in addition to some variation among the brush cells, statistically significant differences between the two cell types. The brush cells contained higher amounts of α-L-fucose in their apical membrane than enterocytes, as revealed by the lectins UEA-I and LTA. In contrast, all other lectins except ConA bound more avidly to the brush border of enterocytes, indicating that the glycocalyx of brush cells is relatively poor in galactose, N-acetyl-galactosamine, N-acetyl-glucosamine, and sialic acids. Preabsorption with the corresponding carbohydrates reduced the labeling densities by 92% or more and thus confirmed the saccharide-specific binding. A reduction by only 72%, as determined for MAA, can be explained by the complex binding of this lectin to different sialic acids (Knibbs et al. 1991).
Survey electron micrograph (
It is regarded as a general problem that the quantitation of immuno- or lectin histochemistry is impaired by minimal variations in the labeling procedure (Bendayan 1995). The additional tests performed in this study confirm that, despite thorough standardization of the labeling procedure, some variation cannot be excluded. However, the differences between the labeling densities of the two cell types by far exceeded the level of these variations. In addition, for all lectins the quantitative results were in accordance with the visual examination of neighboring cells, which necessarily underwent identical labeling conditions. In the current study a correction factor was used to reduce or eliminate the influence of the microvillous geometry on the labeling densities measured. We believe that such mathematical revisions are necessary to reliably compare the lectin binding properties of the glycocalyces that cover the two cell types. However, the application of this correction factor did not alter the results of the statistical tests.
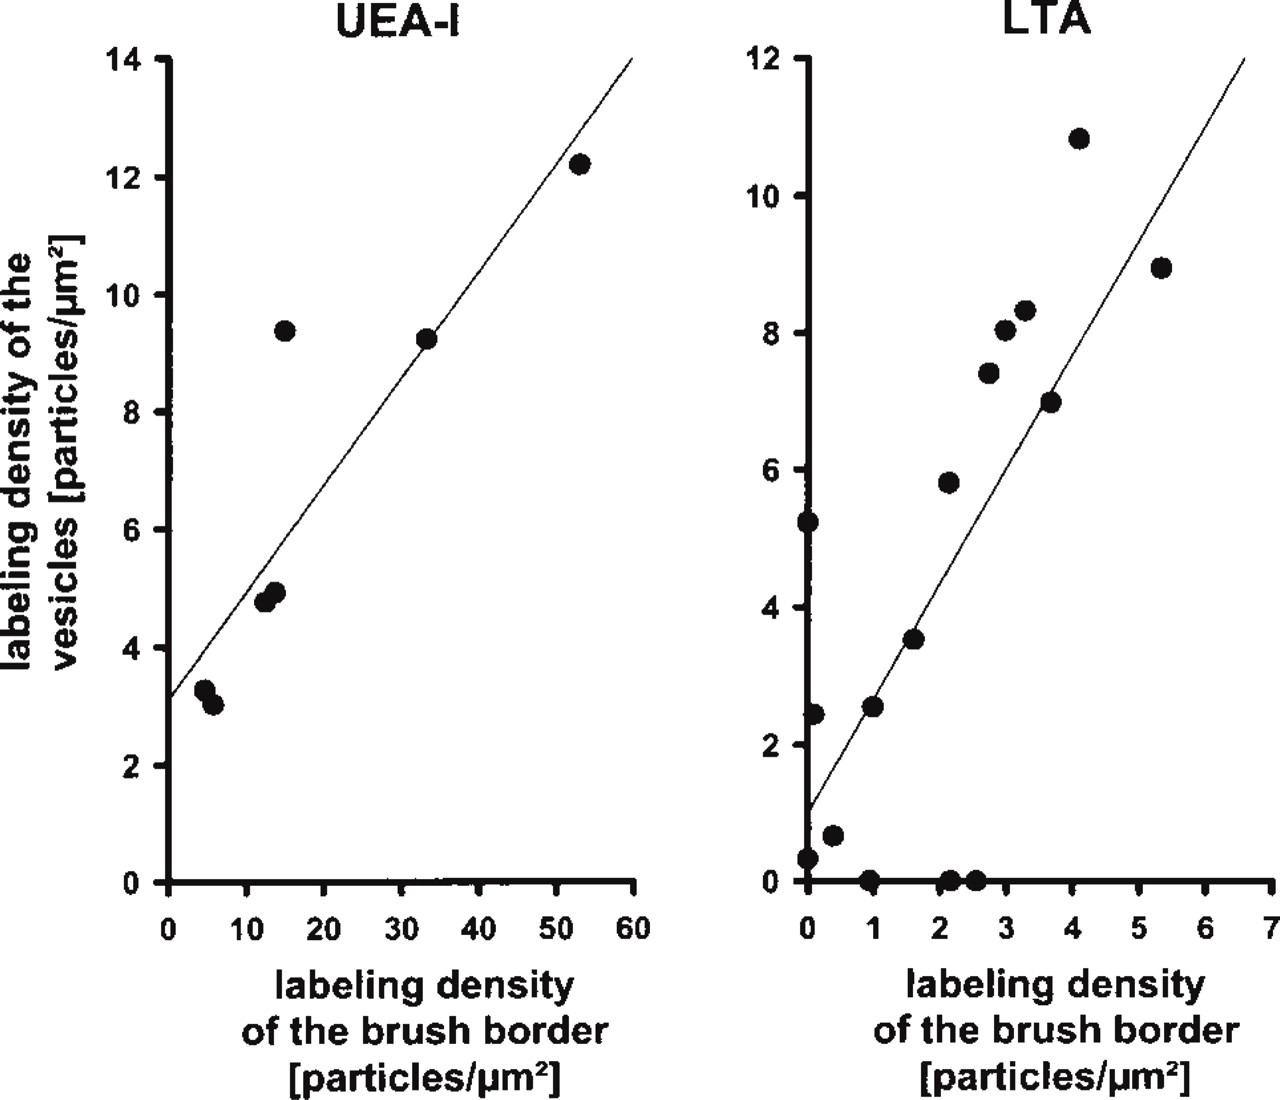
Quantitation of the labeling densities measured over the brush border (x-axis) and over the vesicle-containing region of the apical cytoplasm (y-axis). Each dot represents an individual brush cell. Although there was considerable variation in the binding of the α-L-fucose-specific lectins UEA-I and LTA among the brush cell population, the labeling densities of the apical membrane closely correlated with that of the vesicles.
Lectins are sensitive tools to distinguish among cells of different type, origin, developmental stage, or function (Falk et al. 1994). Peculiarities in the composition of glycoconjugates, as detected in the present study by seven of eight lectins, support the idea that brush cells possess special functions distinct from those of the enterocytes. A resorptive function has been proposed (Isomäki 1973; Iseki and Kondo 1990), but tracer experiments using peroxidase and ferritin as markers revealed that the vesicles of the apical cytoplasm were not involved in endocytosis (Owen 1977; Rosen et al. 1981; Trier et al. 1987; Clark et al. 1995). A secretory function has also been proposed (Silva 1966; Nabeyama and Leblond 1974), but brush cells neither possess the organelles typical for secretory cells (Luciano and Reale 1979) nor have secreted substances yet been detected in the cytoplasm or in the vesicles. Quantitation revealed that the density of fucose residues in the apical membrane correlated with that of the cytoplasmic vesicles (Figure 6). Because further similarities between the two membrane domains were described for the number of intramembranous particles (Trier et al. 1987; and our unpublished observations), it can be assumed that there is exchange between these domains. The vesicles could help replenish the apical membrane, which is assumed to possess a high turnover rate (Trier et al. 1987). This could also explain the presence of microtubules that adjoin vesicles, filament bundles, and apical membrane (Nabeyama and Leblond 1974) and therefore could be involved in the transport of vesicles to the apical membrane.
In the past few years there has been growing evidence in favor of a sensory function of brush cells (Kugler et al. 1994; Höfer et al. 1996; Höfer and Drenckhahn 1998), as had earlier been suggested (Rhodin and Dalhamn 1956; Silva 1966; Luciano et al. 1968). The peculiarities in the composition of the glycoconjugates in the apical membrane, as detected in the present study, further support this idea, because peculiarities in the lectin binding properties have previously been described for sensory cells of other organs. Takami et al. (1994) reported that the receptor cells of the olfactory epithelium and the vomeronasal organ differ from other epithelial cells of the nasal cavity in their glycoconjugate composition. Similar peculiarities have been reported for the receptor cells in the vestibular end organs (Takumida and Bagger-Sjöbäck 1991) and for those in the taste buds (Witt and Miller 1992; Zeng et al. 1995). Interestingly, the taste bud receptors of rats contain high amounts of cytokeratin 18 (Zeng et al. 1995) and thus further resemble the brush cells (Höfer and Drenckhahn 1996). Although it has been demonstrated that brush cells of the trachea may directly contact afferent nerves (Luciano et al. 1968), this is normally not the case for brush cells at other locations. However, Kugler et al. (1994) demonstrated that brush cells of the intestinal tract are capable of producing nitric oxide and thereby could stimulate other cells and/or nerve endings in their vicinity.
Quantitation revealed that those lectins that preferentially bound to brush cells varied in labeling density from cell to cell. Consecutive sections confirmed that these variations represent cell-specific differences and are only marginally affected by the labeling and quantitation procedures. In addition, the two fucose-specific lectins UEA-I and LTA revealed considerable cell-to-cell variations (Figure 4) that largely differed from those determined for other lectins, e.g., for MAA. These variations in the amount of fucose residues could be due to heterogeneities among the brush cell population or to varying functional states of individual cells. Unfortunately, the rare occurrence of brush cells in the gut epithelium makes it extremely difficult to correlate histochemical findings with other properties, e.g., the distribution or the position along the crypt-villous axis. Further studies are needed to elucidate the nature of the variations observed. Although the lectins UEA-I and LTA possess the same nominal specificity (α
The relative frequency of brush cells in the small intestine has been determined as less than 0.1%. Interestingly, the brush cells were 10-fold more numerous in the epithelia of the Peyer's patches. This quantitative finding could explain why many previous studies that primarily focused on the M-cells of rodent Peyer's patches also mentioned the presence of brush cells (Owen 1977; Rosen et al. 1981; Gebert and Bartels 1987; Clark et al. 1995). The reason for this association of brush cells with cells of the immune system is yet unknown, but it can be speculated that the production of M-cells in specialized crypts (Gebert and Posselt 1997) also affects a separate differentiation pathway from crypt stem cells to brush cells.
In conclusion, it is shown that brush cells of the small intestine of mice possess a specialized glycocalyx that considerably differs from that of enterocytes in the composition of glycoconjugates. We thereby provide evidence for the hypothesis of a receptor function of brush cells. Further experiments are needed to determine whether brush cells of other organs and other species likewise possess such peculiarities.
Footnotes
Acknowledgments
Supported by the Deutsche Forschungsgemeinschaft (SFB280/C14).
We are grateful to Prof G.-J. Rieger (Institute of Mathematics, University of Hannover) for his help in the geometrical considerations, to Prof E. Ungewickell (Medical School of Hannover) for providing the EM facilities, and to K. Al-Samir for helpful discussions. The technical assistance of A. Beck, S. Fassbender, G. Preiss, and K. Werner, and the correction of the English text by S. Fryk, are gratefully acknowledged.