
Abstract
We studied the cellular and subcellular localization of G α-subunits in pancreas by immunocytochemistry. Golfα and G11α were specifically localized in islet insulin B-cells and glucagon A-cells, respectively. Gs α and Gqα labeling was more abundant in B-cells. The presence of Golfα in B-cells was confirmed by in situ hybridization. In B-cells, Golfα and Gsα were found in the Golgi apparatus, plasma membrane (PM) and, remarkably, in mature and immature insulin secretory granules, mainly at the periphery of the insulin grains. Gqα was detected on the rough endoplasmic reticulum (RER) near the Golgi apparatus. In A-cells, the Gα-subunits were mostly within the glucagon granules: G11 α gave the strongest signal, Gsα less strong, Gq was scarce, and Golf was practically absent. Gqα and Gsα immunoreactivity was detected in acinar cells, although it was much weaker than that in islet cells. The cell-dependent distribution of the Gα-subunits indicates that the stimulatory pathways for pancreatic function differ in acinar and in islet B- and A-cells. Furthermore, the G-protein subunits in islet cell secretory granules might be functional and participate in granule trafficking and hormone secretion.
Keywords
T
Materials and Methods
Animals
Normal adult Sprague-Dawley rats of either sex were used. They were kept on a standard pellet diet and fasted for 12 hr, but with tapwater ad libitum, before sacrifice.
Cultured Cells
The B-cell line from rat insulinoma RINm5F (Gazdar et al. 1980) and mouse insulin β-TC-3 (Efrat et al. 1988) and glucagon-secreting ãTC-1 (Powers et al. 1990) cell lines were cultured as described previously. For immunohistochemical assays, RINm5F and ãTC-1 cells were cultured in 75-cm2 flasks and β-TC-3 cells were cultured at a concentration of 3 × 10⁴ cells/ml in chamber slides (Lab-Tek; Nunc, Naperville, IL).
Antibodies
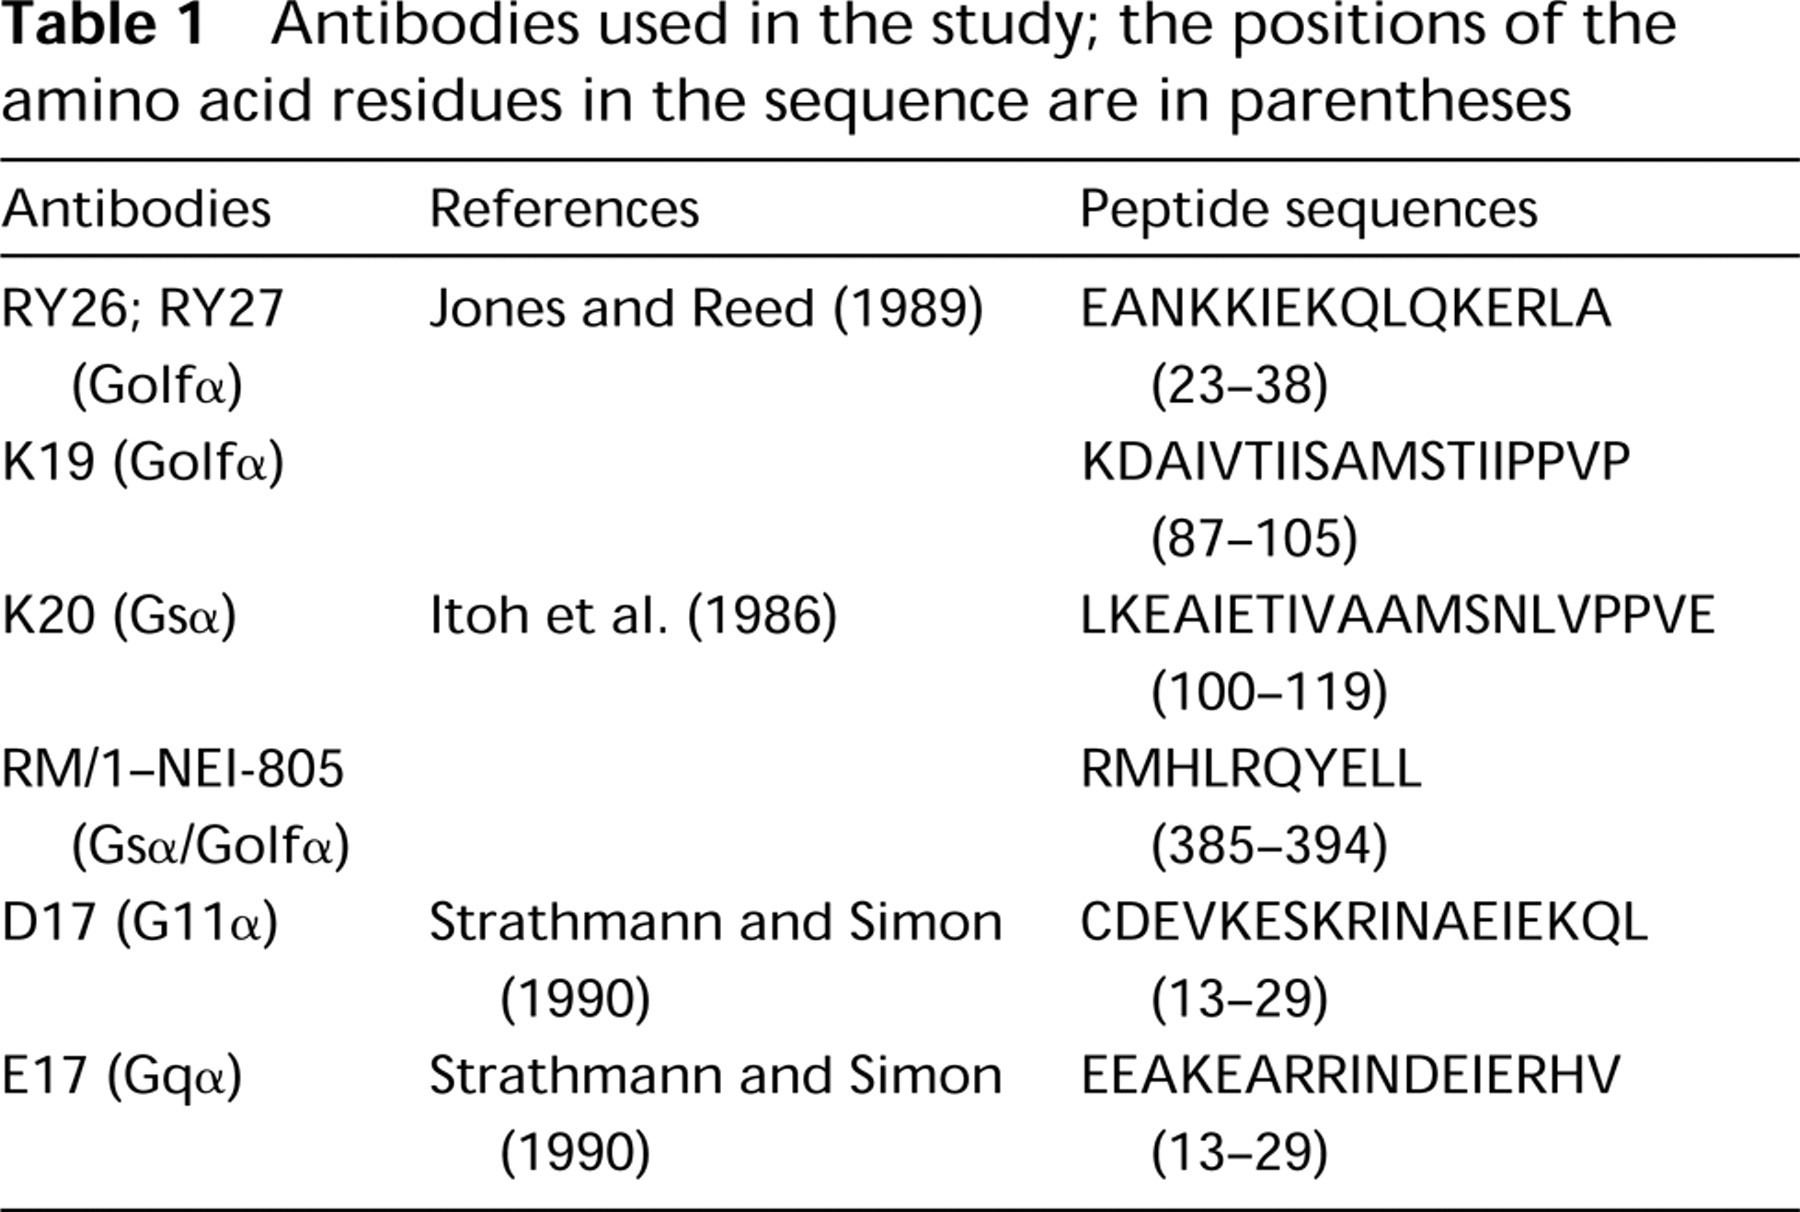
Mouse monoclonal antibodies specific for insulin (HUI-018) and for glucagon (GLU-001) were from Novo Nordisk (Bagsvaerd, Denmark). Antibodies specific for the G-protein α-subunits are described in Table 1. The sequences used to raise the antibodies RY26/27 (Yanaihara Institute, Fujinomiya, Japan), K19, K20, D17, and E17 (Santa Cruz Biotechnology; Tebu, France) are conserved in human and in rodents (NCBI Blast Search site of Genbank on Internet). The sequences used to raise Golfα antibodies K19 and RY differ from those of Gsα by 7/19 and 4/16 amino acid residues, respectively. The peptide RM/1 NEI-805 (Dupont-NEN Research Products; Boston, MA) takes into account the COOH terminal sequence of both Golfα and Gsα, which differ by only one residue of 10. The G11 α peptide used to raise D17 differs by 6/17 amino acid residues from that of Gqα, and the Gqα sequence used to raise E17 by 8/17 amino acid residues from that of G11 α. The specificity of each antibody obtained was directly studied by immunoblotting and immunocytochemistry.
Antibodies used in the study; the positions of the amino acid residues in the sequence are in parentheses
Molecular Probe for In Situ Hybridization
Nucleotide sequences specific for the Golfα mRNA were designed from the data of Genbank using the NCBI Blast Search site, and were tagged with digoxigenin (DIG). The anti-sense probe (5′-GCCTGCTGGCTCGCACTCCGATCA-GGCAAGTAGGAA-3′) and its control sense probe were tagged at the 5′ end with DIG and were purified by HPLC according to the manufacturer (Genset; Paris, France). All other reagents used in this study were of A grade.
Immunoblot Analysis
Proteins were extracted from subconfluent RINm5F or αTC-1 cells by a modification of a previously described method (Laemmli 1970) with an ice-cold lysis buffer containing antiproteases including 0.5 mg/ml leupeptin, 0.7 μg/ml pepstatinA, 1 μg/ml aprotinin, 100 μg/ml trypsin inhibitor (Boehringer; Mannheim, Germany). The protein concentration was determined as described (Bradford 1976). Aliquots containing 300 μg of protein were subjected to SDS-PAGE on a 12% gel, then transferred to a Hybond-ECL nitrocellulose membrane (Amersham; Arlington Heights, IL) by electro-blotting. The blots were probed with the antibodies described in Table 1 diluted 1:500, with the exception of D17, which was diluted 1:300. Bound antibodies were detected with the ECL Western blotting system according to the manufacturer's protocol (Amersham).
Immunohistochemistry
Animals were sacrificed and the pancreas quickly excised, and fixed for 3 hr in 4% paraformaldehyde and 0.5% glutaraldehyde in 0.1 M phosphate buffer. The samples were rinsed three times with 0.1 M phosphate buffer. They were then dehydrated in a series of solutions of ethanol and embedded in paraffin. Five-μm-thick sections were deparaffinized with xylene and rehydrated in a series of solutions of ethanol immediately before staining by double labeling procedures. Immunofluorescence staining was performed using dichlorotriazinyl aminofluoresceine-labeled F(ab)′2 goat anti-mouse IgG (DTAF; Immunotech Laboratory, Marseille, France), or Texas red sulfonyl chloride-labeled F(ab)′2 goat anti-rabbit IgG (TRSC; Jackson ImmunoResearch Laboratory, Avondale, PA). Sections were incubated with either the anti-insulin (1:500) or the anti-glucagon (1:100) antibodies overnight at 4C in a humid atmosphere with agitation, rinsed several times with 0.01 M PBS, and then incubated for 1 hr at room temperature (RT) in the dark with the goat anti-mouse IgG DTAF (1:150). The sections labeled for insulin or glucagon were thoroughly washed and then labeled for the Golfα-subunits (1:50 or 1:100) and revealed with the goat anti-rabbit IgG TRSC (1:150) by the double immunofluorescence technique. The same procedure was used to determine the cellular distribution of Gsα, Gqα, and G11 α. The antibodies were diluted immediately before use or in some instances were kept at 4C in the presence of sodium azide 0.1% to avoid freezing and thawing the serum. The specificity of the labeling was assessed by adsorbing the primary antibody with its specific antigen (1 mg/ml) before the labeling protocol. To prevent nonspecific binding of antibodies to glucagon-producing A-cells (Scopsi et al. 1986), Gα antibodies were incubated with low molecular weight poly-L-lysine (MW 3800; Sigma, St. Louis, MO) at a final concentration of 1.6 mg/ml for 24 hr at 4C. After two centrifugations at 15,000 X g for 2 min, the preabsorbed antibody was used for immunological studies as described above.
All tissue sections were examined with an Olympus BH2 light microscope fitted with the appropriate filters to distinguish DTAF (adsorption 488-520 nm) and TRSC (adsorption 575-615 nm) fluorochromes.
Immunocytochemistry
Confocal Laser Scanning Microscopy
Cellular localization of Gsα was directly studied in cultured β-TC-3 cells by CLSM examination under different conditions of stimuli. Cells were cultured in chamber slides in Dulbecco's modified Eagle's medium (DMEM) containing 25 mM glucose in the presence or absence of forskolin 6 μM, phorbol ester 12- o-tetradecanoylphenol-13-acetate (TPA) 100 nM, for 1 hr at 37C. Cells were then washed in PBS at 4C, fixed with 4% paraformaldehyde in 0.1 M phosphate buffer, pH 7, for 90 min, and processed for immunocytochemistry as described above. A TCS 4D Leica (Laser Technich; Heidelberg, Germany), equipped with a X 63 objective (plan apo NA = 1.4) was used for confocal microscopy. For DTAF excitation, an argon-krypton ion laser was set at 488 nm and 568 nm for Texas Red. For each optical section, double fluorescence images were acquired in sequential mode (i.e., DTAF first and Texas Red second). The signal was treated with line averaging to integrate the signal collected over eight lines to reduce noise. The confocal pinhole was adjusted to allow a minimal field depth. A focal series was collected for each specimen. The focus step between the sections was generally 0.3 μm. Selected paired sections were then processed to produce single composite overlay images (color-merged). Photographs were printed on an Ink Jet printer (Epson 1520) with Photoshop 4.0 software.
Ultrastructural Studies
Pancreatic tissues were fixed by immersion in 1% glutaraldehyde in 0.1 M phosphate buffer, pH 7.4, for 2 hr at RT or in paraformaldehyde-lysine-periodate for 3 hr, dehydrated in ethanol, and embedded in Lowicryl 4KM at − 20C. Semithin sections (0.5 μm) were cut and examined under the light microscope to localize the islets of Langerhans. Ultrathin sections (80 nm) were transferred to 200-mesh Parlodion and carbon-coated nickel grids, and subjected to post-embedding colloidal gold immunolabeling (Bendayan 1995). The tissue sections were incubated for 30 min on a drop of 0.1 M glycine, rinsed twice for 3 min with PBS, and transferred for 30 min to PBS containing 1% ovalbumin. They were then incubated overnight at 4C with one of the specific antibodies, rinsed with PBS, and incubated in PBS-ovalbumin and then with the protein A-gold or IgG-gold complex (gold particles 10-nm diameter) for 30 min at RT. The grids were then washed with PBS, rinsed with distilled water, dried and stained with uranyl acetate before examination.
The specificity of the labeling was assessed through a number of control experiments. The protein A-gold or the IgG-gold step was carried out without prior exposure to any antibody and the primary antibody was absorbed with its specific antigen (1 mg/ml) before labeling. Very few gold particles were detected under these conditions, confirming the specificity of the reagents and of the cytochemical results. The absence of crossreactivity among insulin, glucagon, and the G-protein antibodies was tested by adding insulin or glucagon (250 μg/ml each) to the G-protein antibodies and incubation overnight at 4C. A Philips 410 transmission electron microscope was used.
In Situ Hybridization
Pancreatic tissues were processed under RNase-free conditions, fixed in Bouin's for 24 hr at RT, and embedded in paraffin using standard procedures. Paraffin serial sections (5 μm thick) were mounted on SuperFrost/plus slides, dewaxed in xylene, and passed through a series of concentrations of ethanol. The slides were rinsed with diethyl pyrocarbonate water (DEPC) and 2 X saline sodium citrate buffer (2 X SSC), the sections were digested with 15 μg/ml of proteinase K (Sigma) in 0.1 M Tris-HCl buffer at 37C for 1 hr. Then the sections were postfixed in freshly prepared 0.4% para-formaldehyde for 20 min at 4C. The sections were prehybridized for 1 hr at 37C with hybridization cocktail (Boehringer) and then hybridized overnight with 300 μl of the DIG-labeled anti-sense oligonucleotide probe solution (200 ng/ml). Sections were washed in (a) 4 X SSC 30% formamide, (b) 2 X SSC 30% formamide and, (c) 0.2 X SSC twice for 5 min at 37C and then in Tris-buffered saline (TBS) containing 1.5 M NaCl, 20 nM MgCl2, 1% BSA, and 0.1% Triton, for 15 min at RT. The sections were then incubated for 1 hr at RT with the anti-DIG antibody (1:500), rinsed twice with TBS, and finally rinsed with distilled water. Bound DIG antibodies were revealed by the alkaline phosphatase method (Dagerlind et al. 1992) after an overnight incubation with 4-nitroblue tetrazolium chloride and 5-bromo-4-chloro-3-indolyl-phosphate as substrates (Boehringer). Slides were washed and stained with hematoxylin. Control reactions included hybridization with (a) cell-specific markers (DIG-labeled insulin or glucagon probes, 250 ng/ml), using acinar and nonpancreatic B-cells as negative controls, (b) with the Golfα probe with brain tissue sections as positive control, (c) incubation of tissue sections with an excess (6.25 μg/ml) of unlabeled Golfα probe with the labeled probe, (d) with the sense and not the anti-sense probe, and (e) without labeled probe.
Results
Antibodies
The molecular specificities of the Gα antibodies were determined by using them to probe the rat B-cell line RINm5F and the mice A-cell line αTC-1 (Figure 1). Immunoblotting of the RINm5F extracts with the anti-Golfα antibody K19 gave one band at approximately 46 kD (Figure 1, Lane 1), which was lost after incubation with the Golfα peptide (Figure 1, Lane 3). The RY26/27 antibody recognized the 46-kD band and another slower migration band (Figure 1, Lane 4) which was not lost after incubation with the Golfα peptide (Figure 1, Lane 5). Consequently, K19 was used in subsequent experiments. The anti-Gsα K20 antibody gave a band at approximately 45 kD, which totally disappeared after incubation with the peptide. This band therefore corresponds to a Gs isotype (Milligan et al. 1991). Binding to Golfα (Figure 1, Lane 1) was not displaced by Gsα (Figure 1, Lane 2) and the binding to anti-Gsα (Figure 1, Lane 6) was only weakly displaced by the Golfα peptide (Figure 1, Lane 7). The specificities of the Gqα and G11 α antibodies have been established previously (Macrez-Leprětre et al. 1997). Antibody anti-G11 α labeled a 41-kD band in protein extracts from the αTC-1 cell line, as expected (Figure 1, Lane 9), and two other bands that were lost after saturation with the peptide. This indicates the presence of G11 α isotypes in the αTC-1 cells (Figure 1, Lane 10).
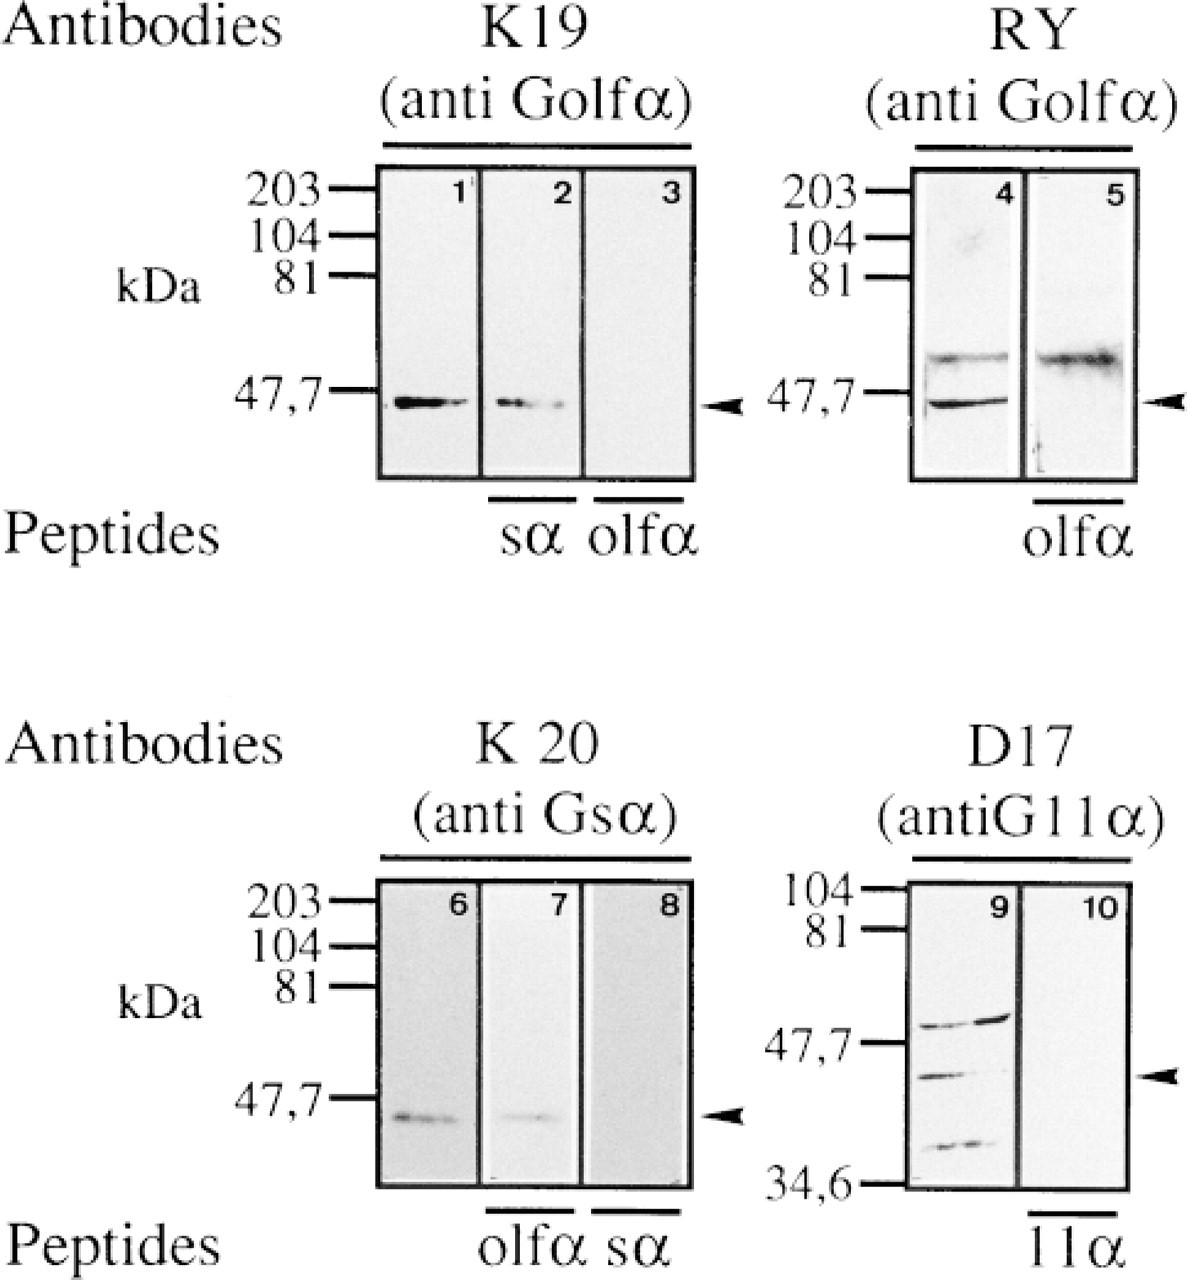
Western blot analysis of G-protein α-subunits in pancreatic cell lines. Extracts (300 μg protein) from RINm5F (Lanes 1-8) or αTC-1 cells (Lanes 9 and 10) were subjected to SDS-PAGE on a 12% gel, then transferred to Hybond-ECL nitrocellulose membrane by electroblotting. The blots were probed with anti-Golf antibody K19 alone (Lane 1), + Golfα peptide (Lane 3), + Gsα peptide (Lane 2); with anti-Golfα antibody RY (Lane 4), + Golfα peptide (Lane 5); with anti-Gsα antibody K20 (Lane 6) + Gsα peptide (Lane 8), + Golfα peptide (Lane 7); with anti-G11α antibody D17 (Lane 9) + G11α peptide (Lane 10). Antibodies were diluted 1:500 with the exception of D17, which was diluted 1:300. Bound antibodies were detected with the ECL Western blotting system. Numbers at left of the blots show the position of the molecular mass markers (kDa). Details of the antibodies are given in Materials and Methods and in Table 1.
Immunohistological Distribution
The distribution of Golfα in islet cells was studied immunohistologically and compared to that in acinar cells. Anti-Golfα antibody K19 yielded intense fluorescence labeling in cells in the central part of the islet. The Golfα-labeled cells were identified by double immunofluorescence as being insulin-containing B-cells (Figure 2A). These B-cells were also labeled with the anti-Golfα N-terminal antibodies RY. The labeling was distributed over the cytoplasm but not in the nuclei of the cells. Double immunofluorescence labeling was also carried out with the anti-glucagon (Figure 2C) and the anti-Golfα antibodies (Figures 2B and 2D). In repeated experiments with a number of sections from different animals, only B-cells were labeled by K19. Antibody RY more consistently labeled a small number of A-cells, perhaps owing to the partial crossreaction of the Golfα and the Gsα epitopes with this antibody. A similar situation was previously observed in mouse pancreas, in which labeling of glucagon cells was also observed in addition to that of insulin cells, using an antibody (RR3) raised against a Golfα sequence similar to sequences in Gsα (Zigman et al. 1993). The labeling with K19 was blocked only when the corresponding peptide was added, demonstrating the absence of crossreaction. Furthermore, preabsorption of the Golfα antibody with poly-L-lysine did not diminish the staining of the B-cells. The labeling obtained by antibody NEI-805, which recognizes the C-terminal parts of both Gsα and Golfα, agreed with previous studies: B-cells, several A-cells, and small vessels were labeled (Astesano et al. 1996). The anti-Gsα antibody K20 labeled B-cells (Figures 3A and 3B) and, to a lesser extent, A-cells (Figures 3C and 3D). Presumably, labeling of A-cells with this antibody was due to the presence of Gsα and not of Golfα. Anti-Gqα antibody mostly labeled B-cells and, to a lesser extent, A-cells. Anti-G11α antibody labeled only A-cells (Figure 4). In each case, preincubation with the corresponding antigen abolished labeling. Preabsorption of anti-G11α antibody with poly-L-lysine did not affect its binding.
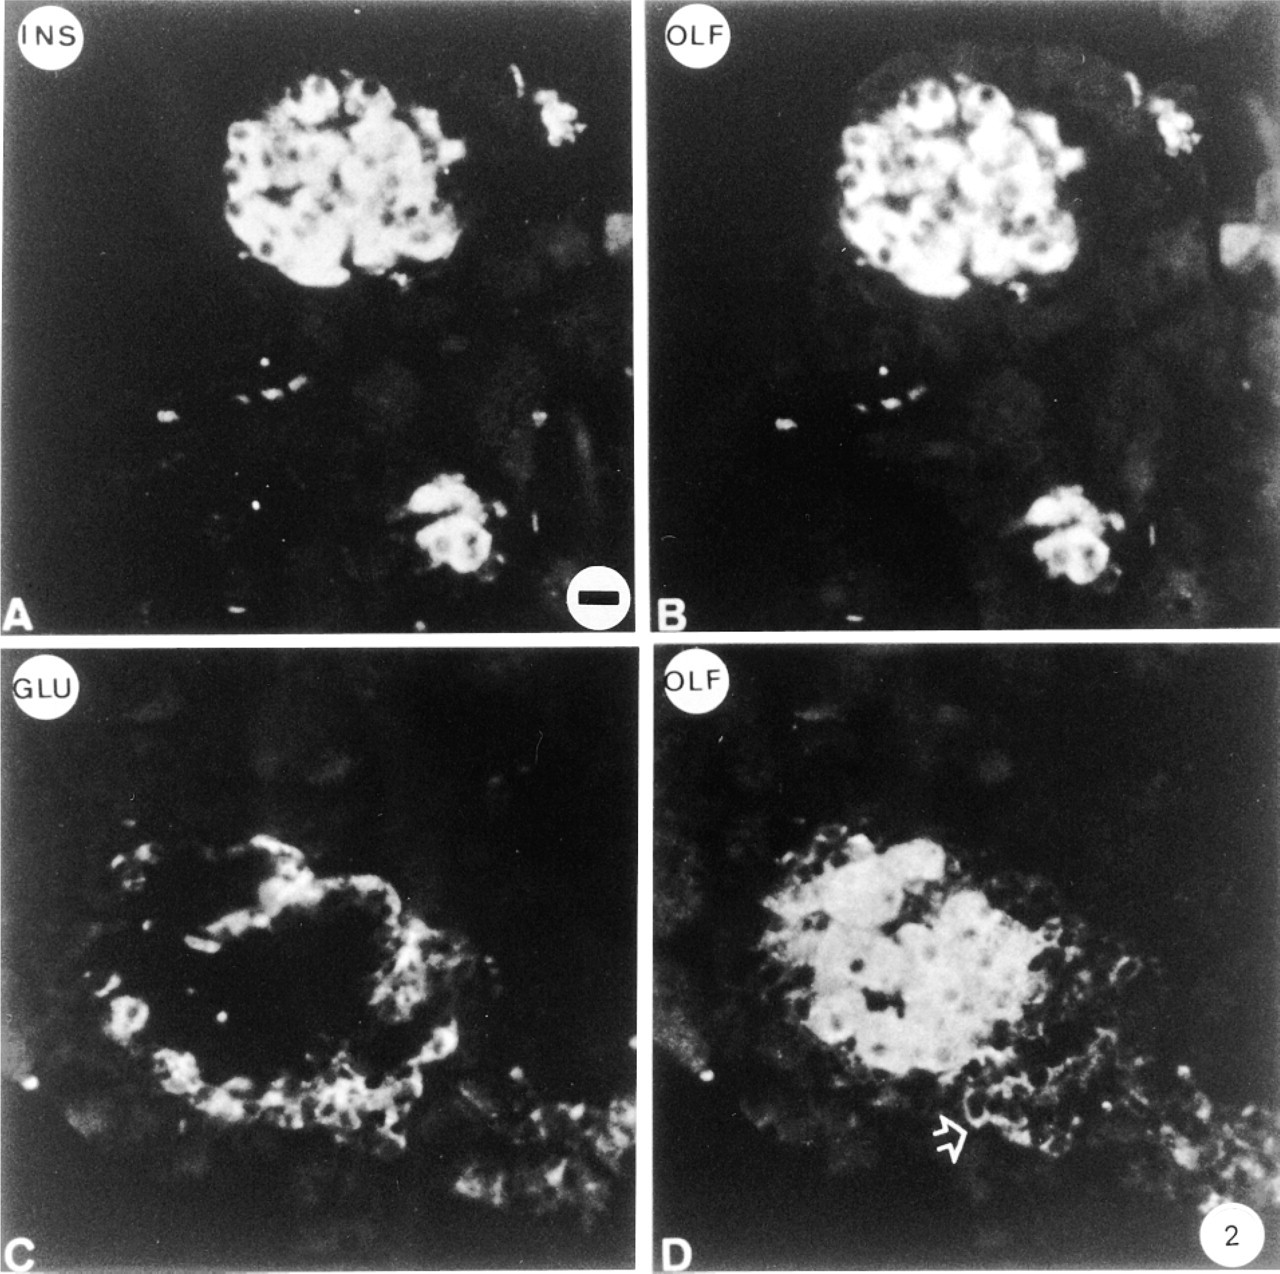
Immunohistochemical localization of Golfα in rat islets. Double labeling experiments were performed using anti-insulin (A) and anti-glucagon (C) antibodies and the anti-Golfα antibody K19 (B,D) in conjunction with secondary antibodies tagged with DTAF (A,C) or TRSC (B,D). Golfα is mainly localized in insulin-containing cells. Weak Golfα labeling is occasionally seen in some glucagon-containing cells (arrow). Bar = 17 μm.
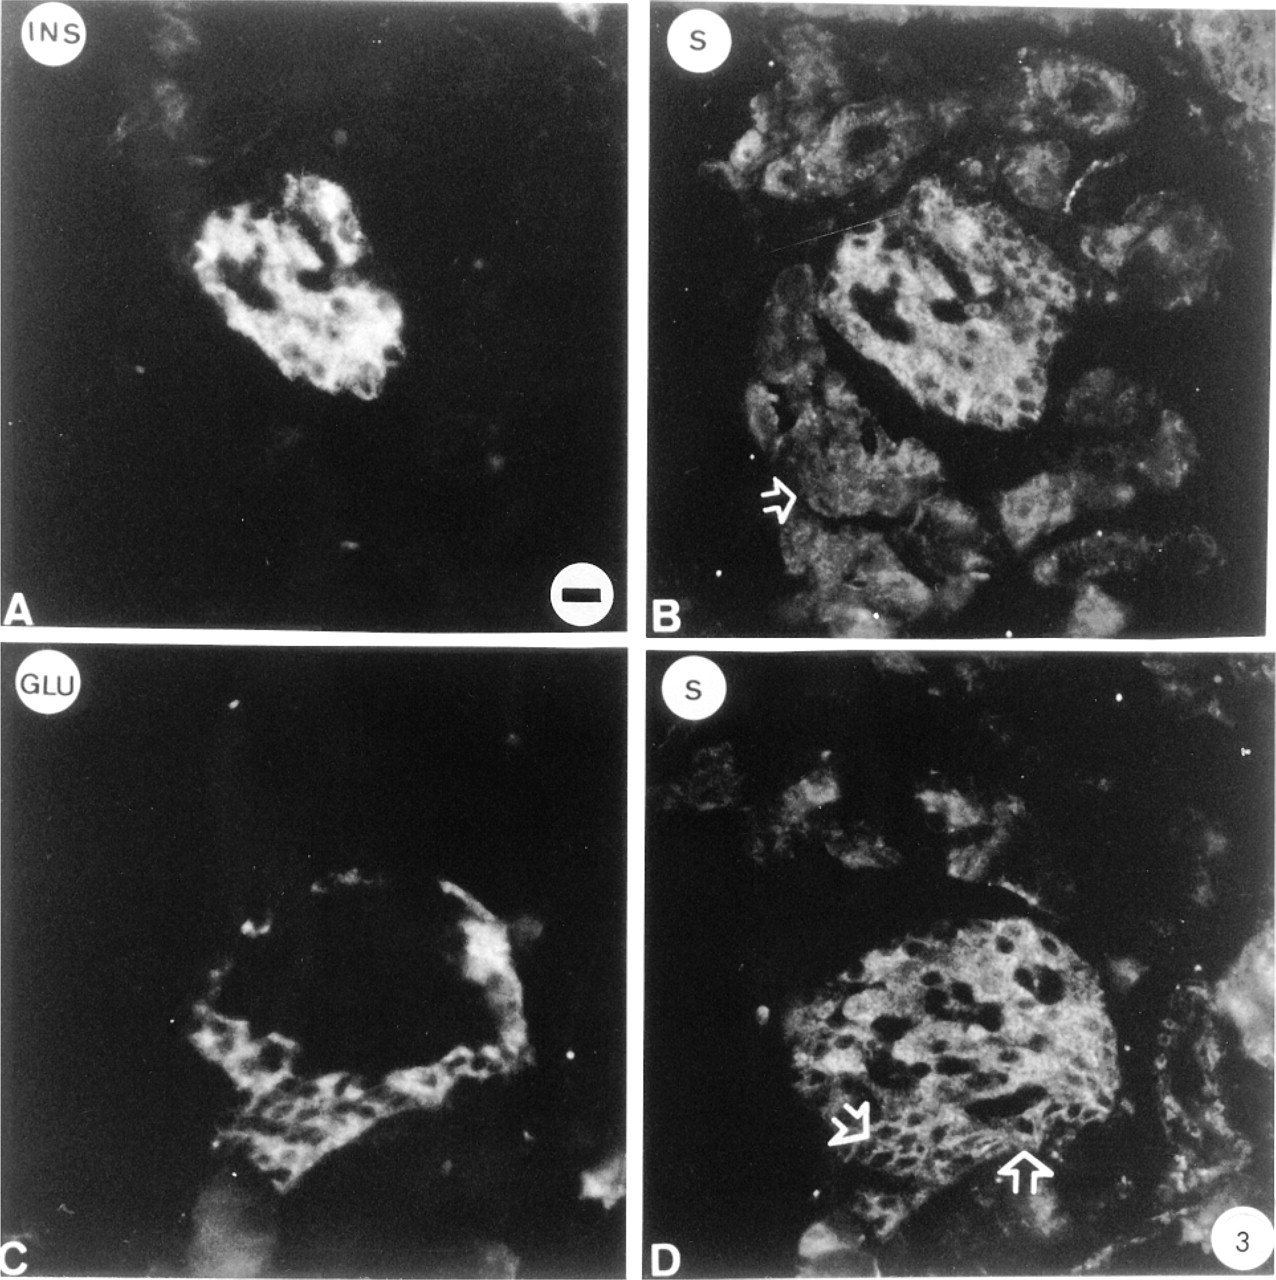
Immunohistochemical localization of Gsα in rat islets. Double labeling was performed using anti-insulin (A) and anti-glucagon (C) antibodies and the anti-Gsα antibody K20 (B,D) in conjunction with secondary antibodies tagged with DTAF (A,C) or TRSC (B,D). Gsα is mainly localized in insulin-containing cells. Weak labeling is also detected in some glucagon-containing cells (arrows in D) and acinar cells (arrow in B). Bar = 17 μm.
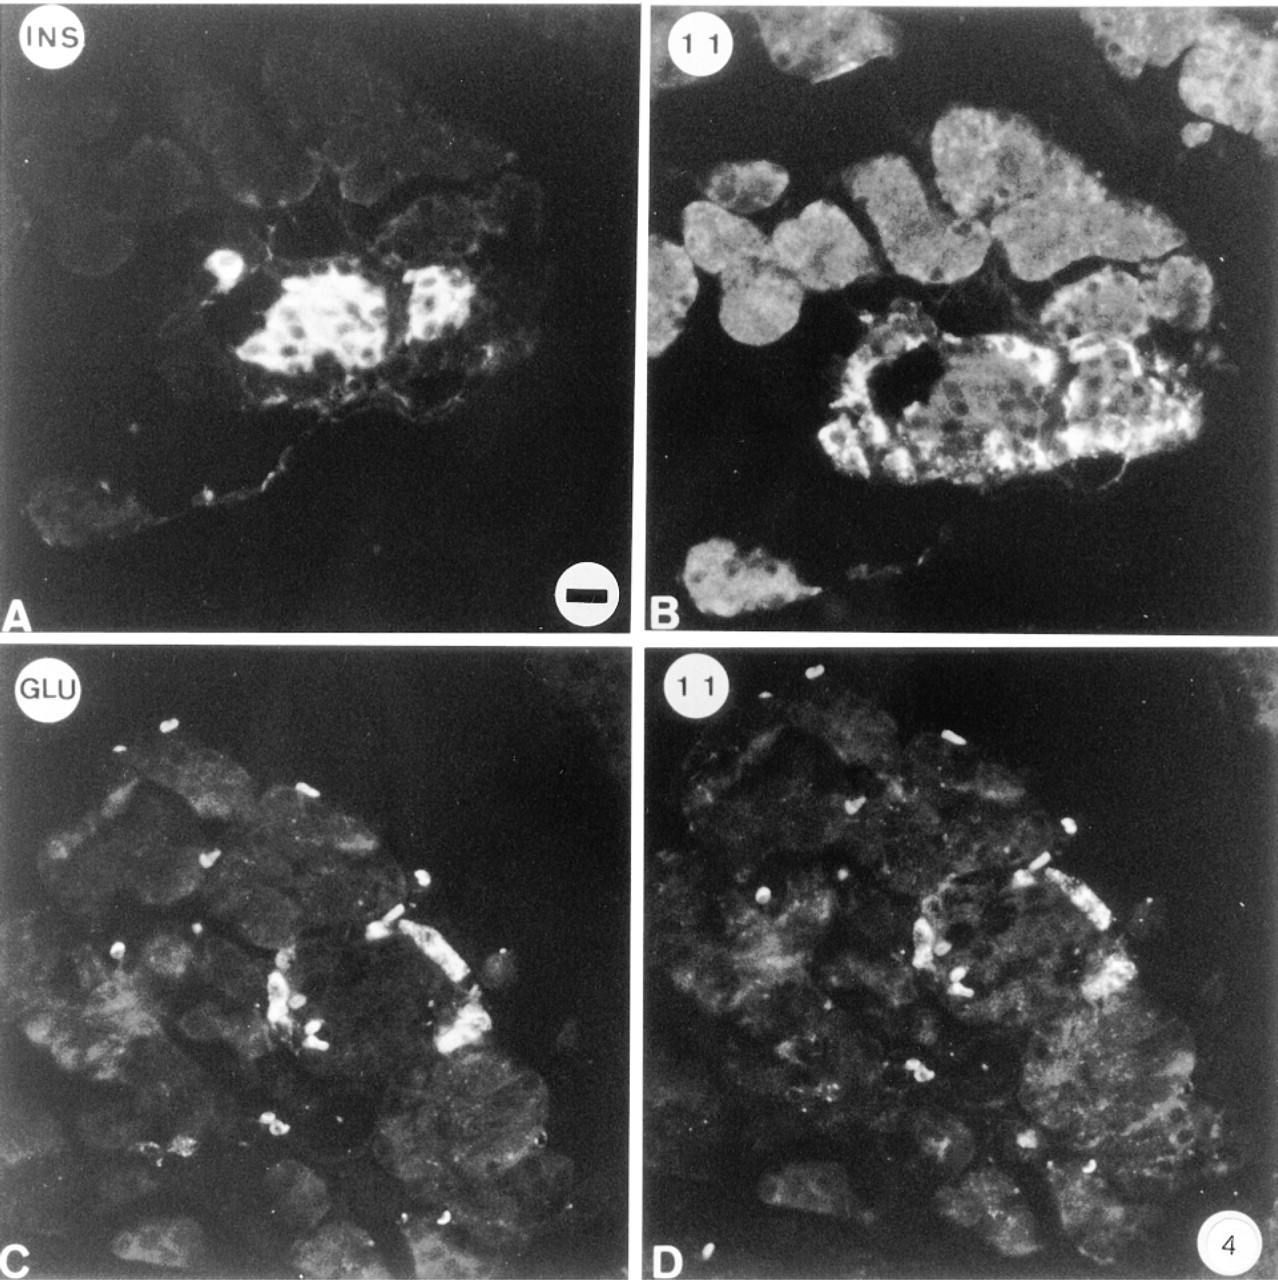
Immunohistochemical localization of G11α in rat islets. Double labeling was performed using anti-insulin (A) anti-glucagon (C), and with anti-G11α (B,D) antibodies, in conjunction with secondary antibodies tagged with DTAF (A,C) or with TRSC (B,D). G11α is localized in glucagon cells. Bar = 17 μm.
The pattern of Gα-subunits in pancreatic acinar cells was different from that in islet cells. Anti-G11α antibodies did not label acinar tissue. Labeling with anti-Golfα antibodies was not consistently reproducible, whereas consistent labeling was revealed on acinar cells with antibody NEI-805. Therefore, Gsα, but not Golfα, is present in acinar cells.
Ultrastructural Localization
The anti-Golfα antibodies K19 and RY27 labeled pancreatic B-cells, whereas antibody RY26 also labeled A-cells because of the greater interaction of this antibody with the Gsα epitopes. Blood capillary endothelial cells were weakly labeled. The anti-Gsα anti-body K20 labeled B-cells and, to a lesser extent, A-cells. These results were in agreement with those obtained above by immunohistology, showing the presence of Golfα in B-cells and Gsα in both B- and A-cells. We therefore analyzed the subcellular distributions of Golfα and Gsα in B-cells using K19 and K20, which are highly specific for Golfα and Gsα. Using K19, some gold particles were scattered over the endoplasmic reticulum and the Golgi apparatus but the labeling was mainly within the secretory granules (Figure 5) and at the plasma membrane. Immature and mature granules were labeled near the delineating membrane and halo. Unlike that in B-cells, K19 labeling was not consistent in A-cells. The subcellular distribution of Gsα in endocrine cells was similar to that of Golfα (Figure 6), which was mostly in the immature granules of the B-cells (Figure 6, inset). The anti-Gsα antibody K20 labeled acinar cells but still with a lower density than in B-cells. Most Gsα was in the rough endoplasmic reticulum (RER) and, to a lesser extent, in the Golgi apparatus and zymogen granules. Gqα antibody mainly labeled the RER and cytoplasm near the plasma membrane (data not shown).
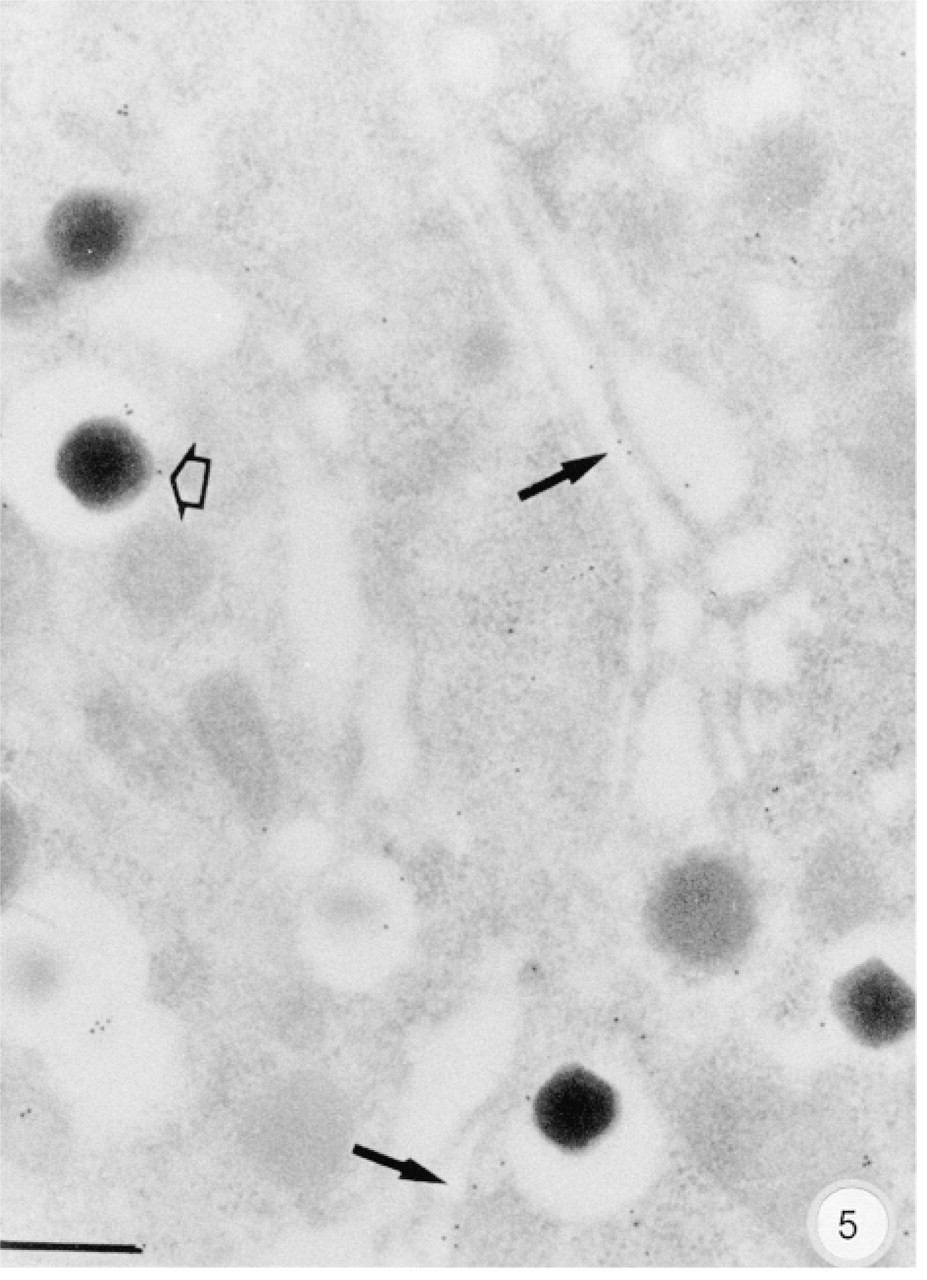
Subcellular distribution of the Golfα labeling in a B-cell. Labeling by gold particles is mainly localized within the secretory granules (open arrow). Gold particles are present in the Golgi apparatus (arrows). Bar = 0.2 μm.
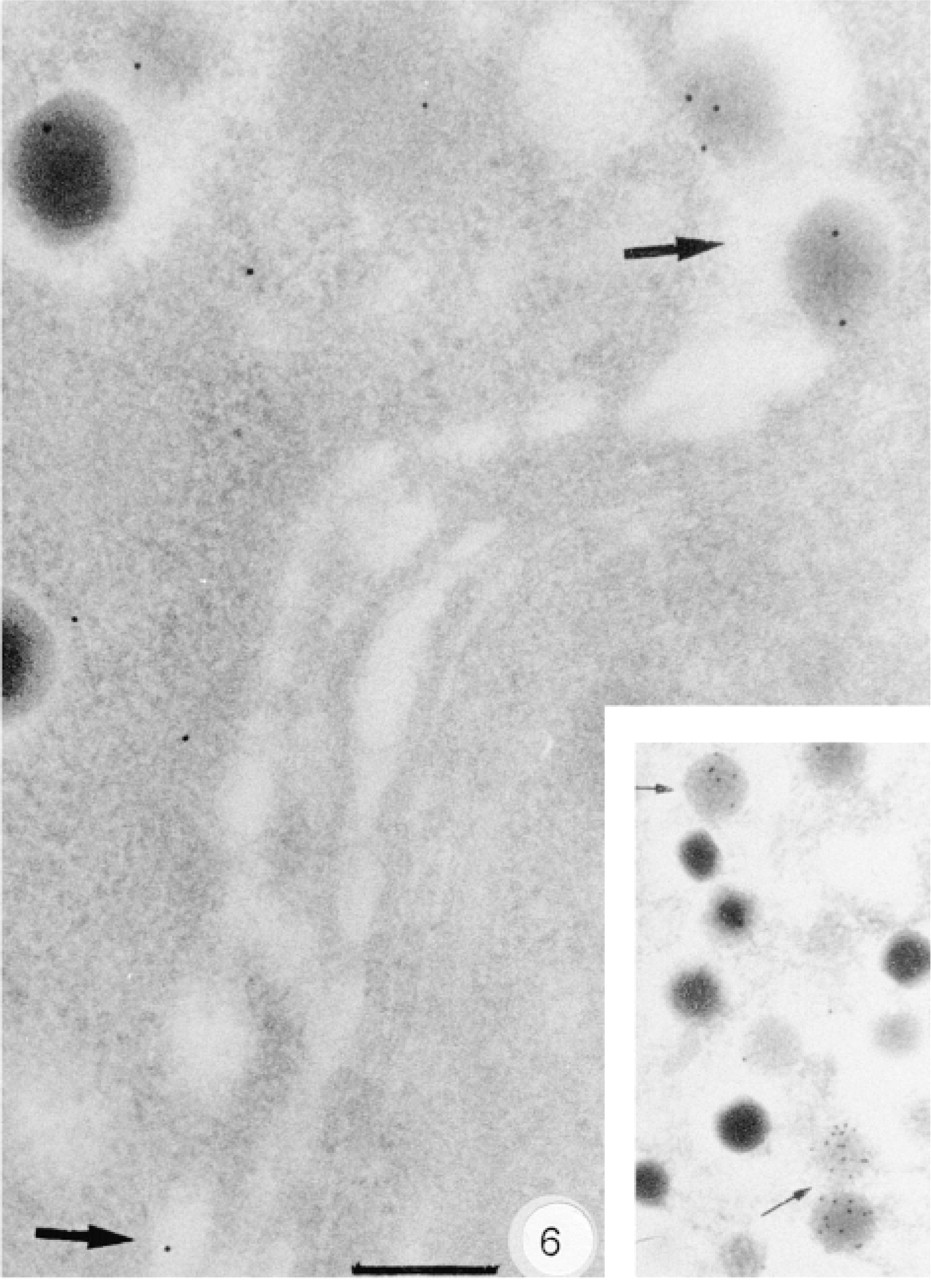
Subcellular distribution of the Gsα labeling in a B-cell. Gold particles are present in the Golgi apparatus (arrows). Labeling by gold particles is mainly localized within the immature secretory granules (inset). Bar = 0.2 μm.
Anti-Gqa antibody E17 labeled the immature and mature insulin secretory granules and was mostly localized on the halo in B-cells (Figure 7). The Gqα distribution in B-cells was particularly abundant in the endoplasmic reticulum (Figure 7, inset), near the Golgi. Anti-G11α antibody D17 gave results completely different from those with the previous antibody used. G11α labeling was observed only in A-cells, with a strong signal in the glucagon secretory granules (Figure 8). However, no labeling at all was observed in pancreatic B-cells.
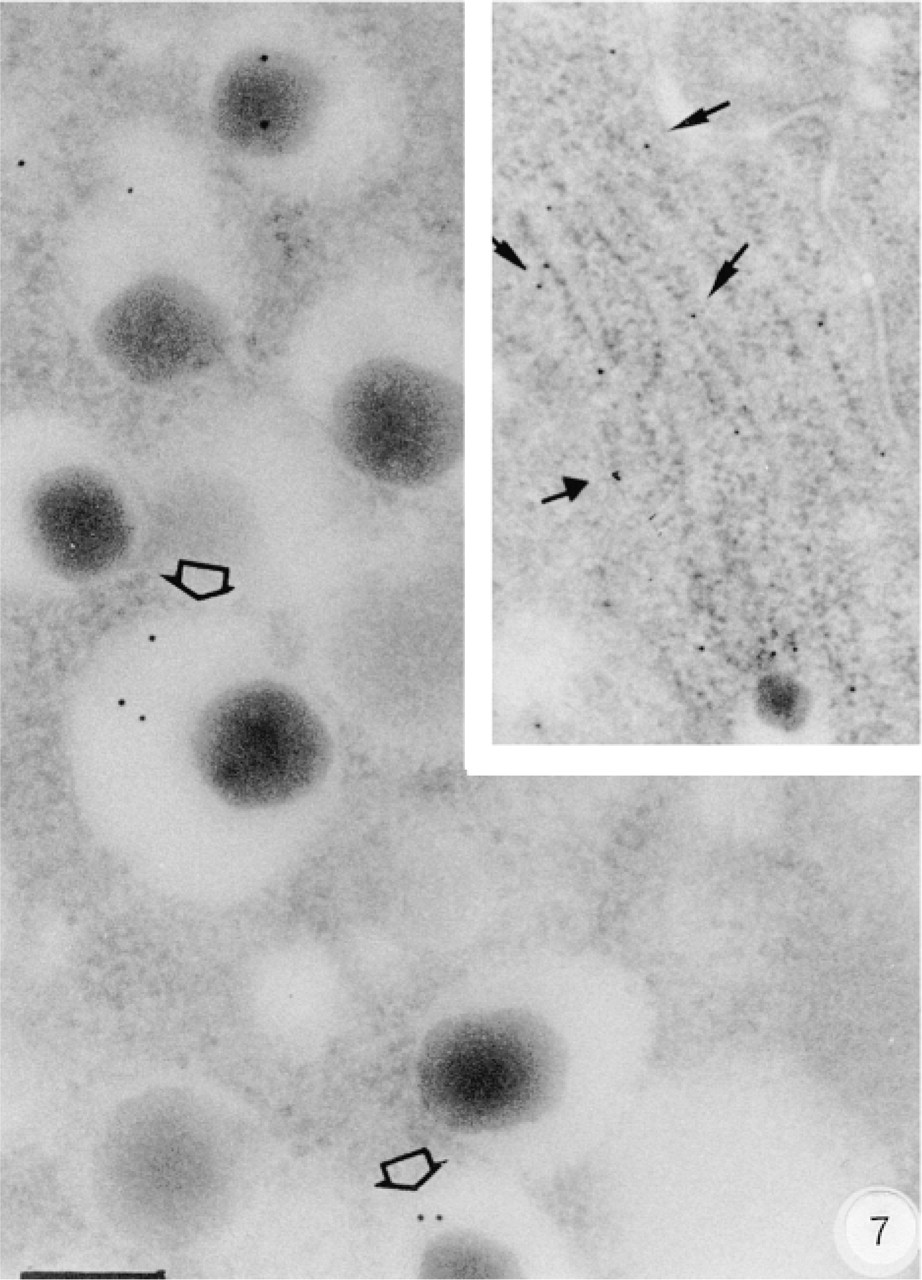
Subcellular distribution of Gqα labeling. Gqα labeling is present in the halo of a B-cell (open arrows) and mainly on the endoplasmic reticulum (inset). Bar = 0.2 μm.
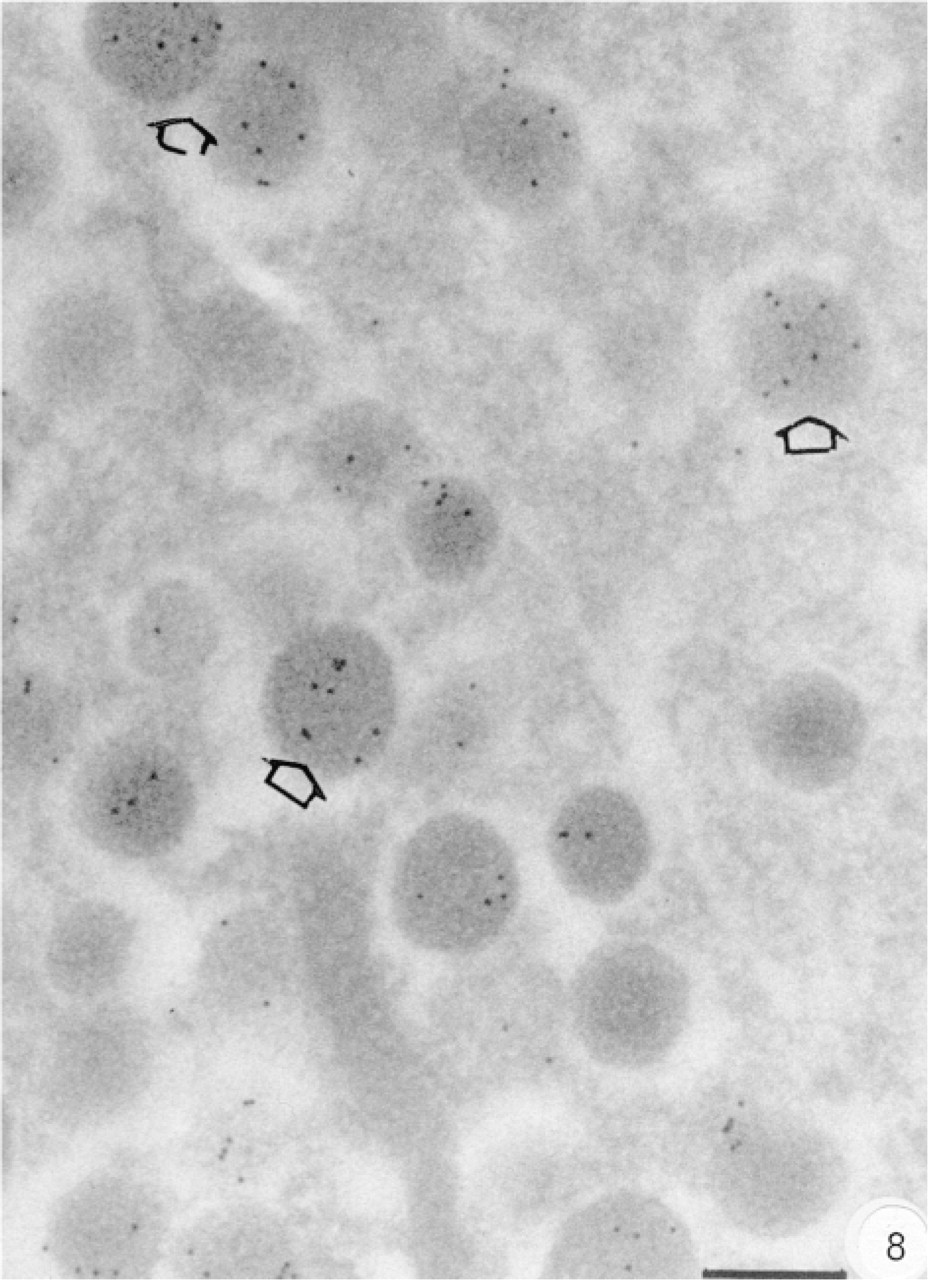
Subcellular distribution of G11α labeling. G11α is localized in an A-cell, with a strong signal within granules. Bar = 0.2 μm.
Localization of Gsα by Confocal Microscopy
To further understand the relationship between G-proteins inside the cells and those on the plasma membrane, we used cultured B-cell lines for direct study of the effect of insulin secretagogues on the localization of Golfα. The Gsα labeling (Figure 9) was denser than that of Golfα in the βTC-3 cell line (not shown) and was not uniformly distributed in the cell. No Gsα staining was observed on the nuclei. The cytoplasmic labeling was not homogeneous. It was compartmentalized and grainy, with a higher density near the plasma membrane, sometimes in the zone of insulin granules, as shown by comparison with insulin (Figures 9A and 9C) and Gsα labeling (Figures 9B and 9D). After stimulation of βTC-3 cells by insulin secretagogues (forskolin and TPA), the labeling density of Gsα at the cellular periphery (Figure 9D) was higher than in controls (Figure 9B).
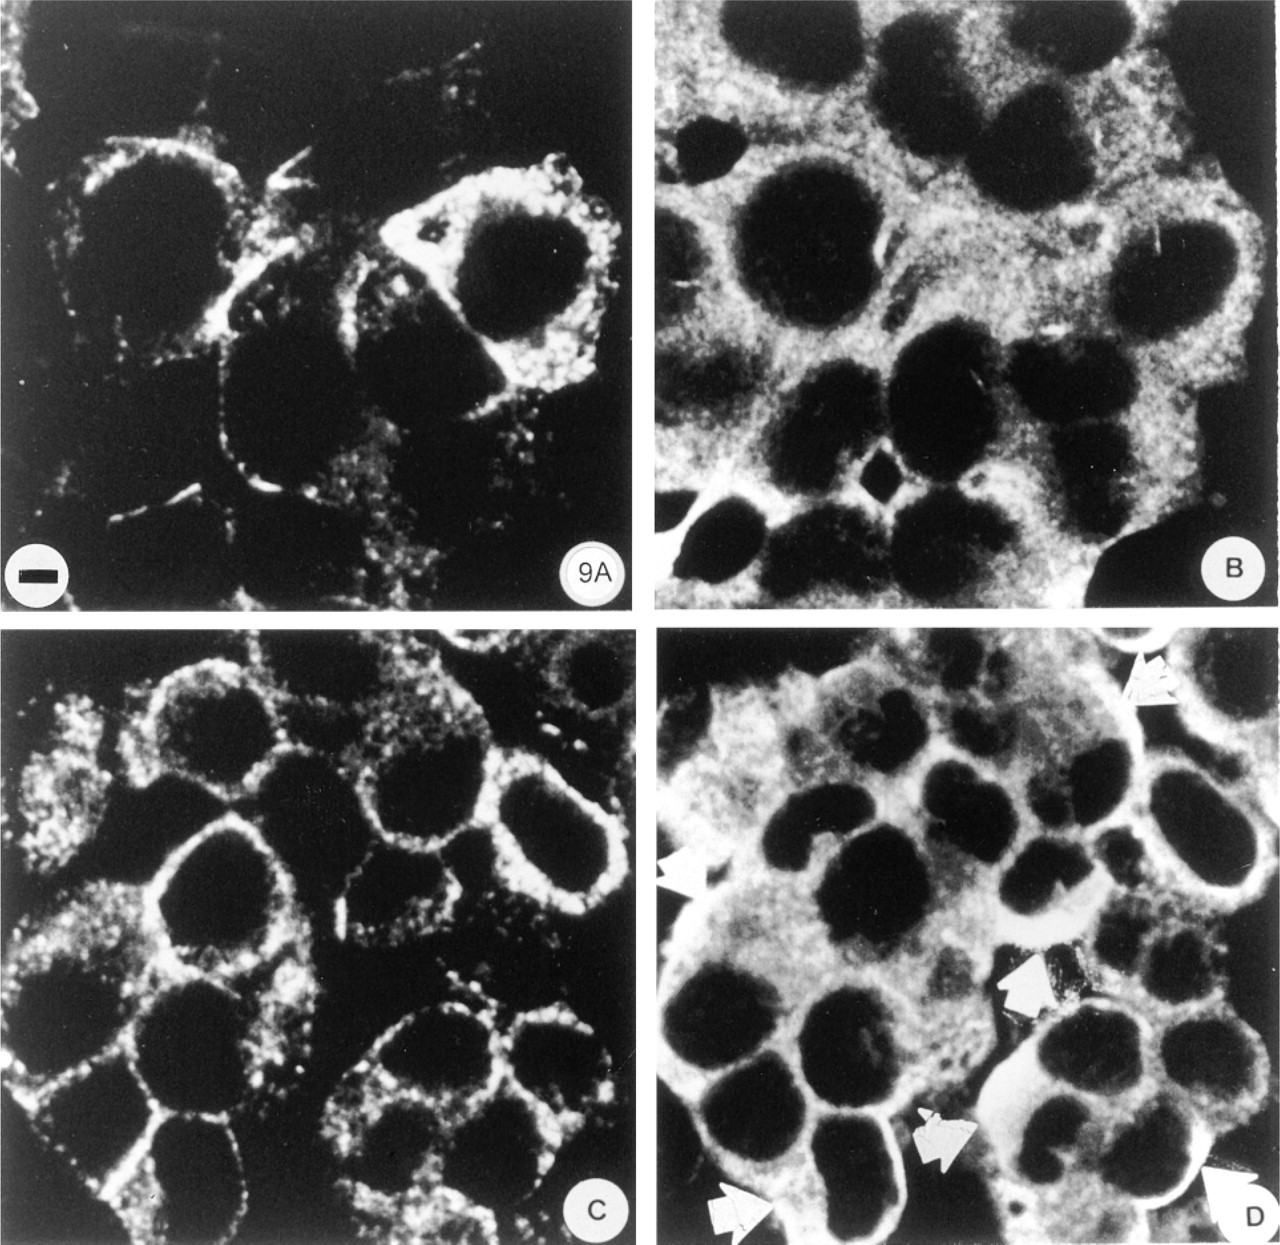
Effect of forskolin and phorbol ester stimulation on the repartition of immunolabeled insulin and Gsα in β-TC-3 cells studied by confocal microscopy. The printed photographs correspond to a 0.3-μm section of β-TC-3 cells cultured in chamber slides in the absence (A,B) or presence (C,D) of forskolin, TPA (phorbol ester 12-o-tetradecanoylphenol-13-acetate) and processed for immunocytochemistry, as described in Materials and Methods. The anti-insulin antibody is revealed in A and C and the anti-Gsα antibody in B and D. Controls show the repartition of the insulin (A) and Gsα (B) labeling. After addition of TPA and forskolin, insulin (C) and Gsα (D) labeling increase at the periphery of the cells with crescent-like shape for Gsα indicated by arrows. Bar = 6 μm.
In Situ Hybridization
To confirm the expression of the G-proteins in pancreatic cells, in situ hybridization was used. We focused on the localization of the Golfα mRNA (Figure 10). The anti-sense Golfα probe revealed the presence of Golfα mRNA in pancreatic islets from adult rats. It labeled the center of islets where the B-cells are located (Figure 10C). Glucagon cells at the periphery of the islets indicated by arrows (Figures 10C and 10F) were not labeled. The exocrine portion of the pancreas, the duct system, and the blood vessels were not labeled. The specificity of the probes was confirmed by various control experiments. Samples from central nervous system were used as positive controls. The anti-sense probe labeled the striatum, the nucleus accumbens, the piriform cortex, and the olfactory tubercles in brain sections (Figure 10A), as described (Herve et al. 1995). No labeling was detected when the sense probe was used (Figure 10B) or when pancreatic sections were probed with either sense probes (Figure 10D) or when unlabeled anti-sense oligonucleotides were present in excess (Figure 10E).
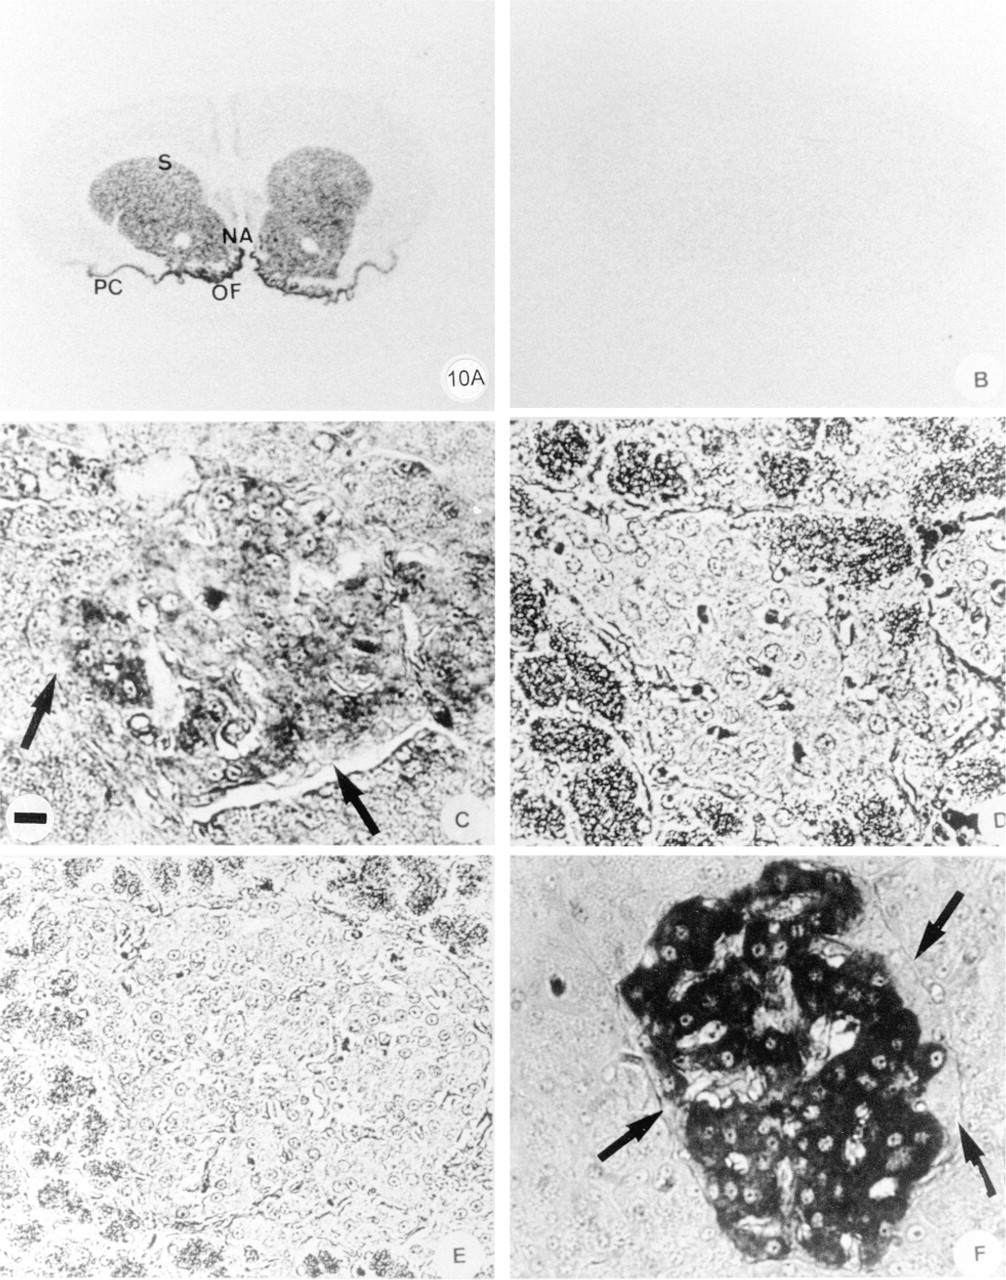
In situ hybridization of Golfα mRNA in rat brain and islets. In situ hybridization of Golfα was performed in rat brain tissues (A,B) and islets (C-F): The Golfα mRNA anti-sense probe labeled the brain striatum section (S), the piriform cortex (PC), the nucleus accumbens (NA), and the olfactory tubercle (OT), all structures known to contain Golfα. No labeling is detected with the oligonucleotide sense Golfα probe (B). In the pancreas section, the anti-sense Golfα oligonucleotide probe labeled the central part of an islet where B-cells were located (C). No labeling of islets was detected when either unlabeled Golfα sense (D) or anti-sense probes (E) were used in excess. The insulin labeling is present in a B-cell at the central part of the islet (F). No labeling was detected at the periphery of the islet where A-cells are present (arrows). Bar = 33 μm.
Discussion
In pancreatic islet endocrine cells, the signal transduction systems involving stimulatory G-proteins initiate a chain of events leading to exocytosis of secretory granules. Here we demonstrate (a) the specificity of cellular distribution of the different stimulatory G-proteins in the pancreas, (b) that each α-subunit has a particular pattern of distribution within its subcellular compartments, and (c) that structures involved in the regulatory secretory pathway are the major sites of these G-protein subunits, consistent with a role for the G-protein in the migration and exocytosis of secretory granules. Golfα is predominantly, if not exclusively, found in normal rat islet B-cells, whereas G11 α is detected in A-cells. Gsα and Gqα immunoreactivities, on the other hand, are found both in B- and A-cells. The specificity of the labeling was confirmed by its disappearance after addition of the corresponding peptides, and the persistence of the labeling after poly-L-lysine treatment excluding the existence of nonspecific binding to A-cells through a mechanism involving linkage to basic and aromatic proteins such as glucagon (Scopsi et al. 1986). The immunocharacterized 46-kD Gsα is the only isoform found in purified rat islets (Phan et al. 1997). The detection of G11 α in A-cells and of Gqα in acinar cells further extends findings with an antibody revealing Gq/G11 in rat islets and B-cell line (Konrad et al. 1995) and in acinar cells (Denker et al. 1996; Ohnishi et al. 1997). In a separate study, G11α mRNA was shown by RT-PCR amplification to be present in mouse islets (Zigman et al. 1994). The cell-dependent distribution of Gα-subunits may reflect specific pathways of cellular activation, differing from one cell phenotype to another: the presence of both Golfα and Gsα in the B-cells fits well with the number of AC-activating receptors (Skoglund and Rosselin 1993) and the abundance of AC isoforms in these cells (Emami et al. 1998). Golfα might be coupled to the calciumdependent AC-III, and Gsα to the calcium-independent isoforms of AC. The localization of G11 α in A-cells suggests its involvement in carbachol-induced stimulation of glucagon secretion.
Gα-subunits are localized at the plasma membrane and are also abundant at a site distant from the plasma membrane. It is likely that there is no single explanation for this phenomenon, because the distribution of Gα-subunits differs among cell types (Muller et al. 1994; Wilson et al. 1994; Denker et al. 1996). The presence of Golfα or Gsα within the secretory pathway could be simply interpreted as a part of posttranslational processing, driving the maturing proteins from the Golgi to the membrane. These proteins might also be involved in control of the ligand-induced stimulation of the endocrine secretion. Characterization of the subcellular distribution of Gα protein in the granule may help resolve this issue. It is certainly difficult to understand how proteins in the core of the secretory granules, e.g., G11α in the glucagon granules, can be activated and/or delivered to the plasma membrane. In B-cells, the distribution of Golfα- and Gsα-subunits and, to a lesser extent, Gqα is peculiar in that they are segregated within the insulin granule, often being at the periphery of the insulin core. At the last step of exocytosis, when the granule membranes fuse with the plasma membrane, Golfα and Gsα may be retained in the plasma membrane, whereas insulin is released externally. The intracellular distribution of G-proteins may therefore reflect a dynamic system by which Gsα is recruited with increasing glucose concentrations. Such a process would favor the availability of functional trimeric G-proteins near cell surface receptors, facilitating the signal transduction stimulated by ligands.
The presence of the Gα protein at the periphery of the granule may also be related to activation of granule trafficking downstream from the ligand-receptor interactions. This possibility is attractive, because the same signal would favor both the exocytosis and the migration of the insulin grain towards the cell surface. However, evidence that G-proteins in granules are functional is required to substantiate this possibility. All available evidence is indirect. To be functional, Gα proteins must be associated with Gβ-γ and must convert the inactive α-GDP form to a GTP-bound active form. Recent immunological data (Kowluru et al. 1996) show the presence of the β-subunit and several γ-subunit subtypes (Kowluru et al. 1997) in the secretory granules from normal rat islet B-cells and the HIT-T15 cell line, suggesting the presence of G-proteins in the heterotrimeric form. G-protein α-subunits might be translocated to the periphery of the cells on forskolin- and phorbol ester-induced stimulation of insulin secretion, as shown for Gsα by confocal microscopy. Another drug, mastoparan which is a direct activator of trimeric G-proteins, might also act on the inhibitory G-subunits Giα in secretory granules when cells are permeabilized (Konrad et al. 1995). The signaling pathway involving the stimulation of trimeric G-proteins in the granule remains to be elucidated. Direct activation by the ligands is unlikely, as shown by ultrastructural studies of VIP binding. In this case, the ligand-mediated endocytosis reaches the Golgi apparatus or lysosome but not the insulin granules (Anteunis et al. 1989). Indirect activation of intermediate signaling elements of the ligand-induced regulatory cascade is more likely. Further investigations could provide a clue to whether the trimeric G-proteins can regulate the traffic of mature insulin granules towards the plasma membrane and the chain of events responsible for their activation.
Footnotes
Acknowledgements
Supported by INSERM and FRSQ (Quebec) cooperative exchange, no. 952499 Fondation de France contract no. EB/NC, no. 877 and by AREDIC.
We thank Dr S. Efrat for his gracious gift of β-TC-3 and αTC-1, Dr N. Yanaihora for Golfα RY antibodies, and Dr M. Laburthe for the RINm5F. We also thank G. Girod and P. Fontanges for confocal laser scanning microscopy (Service Imagerie, Institut Jacques Monod, Jussieu, Paris).