
Abstract
We studied the developmental changes in the localization of peroxisome-specific enzymes in rat kidney tissues from embryonic Day 16 to postnatal Week 10 by immunoblot analysis and immunohistochemistry, using antibodies for the peroxisomal enzymes catalase,
T
The fine structure of peroxisomes during ontogenesis has been studied in various organs, including the kidney (Essner 1970; Pipan and P eni nik 1975). The ontogeny of renal peroxisomes has been characterized by electron microscopy (Goeckermann and Vigil 1975; Larsson and Maunsbach 1975; Brière 1986; Stefanini et al. 1994) employing the alkaline diaminobenzidine (DAB) reaction to identify the peroxisomes by detecting the peroxidatic activity of catalase, a marker enzyme for the peroxisome (Fahimi 1969). The biogenesis of peroxisomes in general has recently been examined at the molecular and protein levels (Lazarow et al. 1996). Because the morphological development of the kidney has been investigated from various aspects and information is accumulating concerning nephrogenesis (Desjardins and Bendayan 1991; Hanai et al. 1993,1994; Johkura 1996; Wada et al. 1996; Liu et al. 1997), the latter is considered to be a source for viewing the relationship between the biogenesis of peroxisomes and the maturation of tissues. The present study examined the maturation of kidney tissues and the development of proximal tubules based on the morphological classification of the developing nephron by Larsson (1975).
As a first step towards a basis for understanding the ontogenic appearance of peroxisomes and to create a bridge between the structural maturation of peroxisomes and the appearance of peroxisomal enzymes, this study attempted to clarify the changes in the localization of peroxisome-specific enzymes in developing kidney. We performed immunoblot analysis and light and electron microscopic immunohistochemistry using monospecific antibodies for four peroxisomal enzymes, i.e., catalase, DAOX, HOX-B, and BP. We demonstrated that the appearance of the various peroxisomal enzymes is temporally parallel and that the appearance of peroxisomes and their maturation correspond to the period of differentiation of nephrons. The subcompartments were shown to be formed along with the distinct localization of peroxisomal enzymes.
Materials and Methods
Animals and Tissues
Kidney tissues from Wistar rats from various ages were examined: embryonic Days 16, 18, and 20, postnatal Days 1, 4, 7, 14, and 28, and postnatal Week 10. Five embryos irrespective of gender in each prenatal group and five male rats in each postnatal group (45 animals in total) were used. Animals were sacrificed under deep anesthesia with diethylether according to Shinshu University School of Medicine Animal Care Committee recommendations. Small pieces of kidney tissue from each animal were immersed in fixatives immediately for light and electron microscopic immunohistochemistry. To obtain identical fixation conditions, all tissues were fixed by immersion because the perfusion technique was not possible for embryos or small animals. Other pieces of tissue without fixation were kept frozen at −30C until the immunoblot analysis was conducted.
Preparation of Antibodies
Catalase and BP were purified from rat livers and DAOX and HOX-B were purified from rat kidneys, as described previously: catalase (Furuta et al. 1986), DAOX (Usuda et al. 1986), HOX-B (Yokota et al. 1985), and BP (Osumi and Hashimoto 1979). Polyclonal antibodies were raised in rabbits against the purified peroxisomal enzymes. IgG fractions of the antisera were obtained by partial purification by fractionation with (NH4)2SO4 and were dialyzed against 10 mM potassium phosphate buffer, pH 7.5/150 mM NaCl. The monospecificity of the antibodies raised against the following enzymes has been confirmed in previous studies: catalase (Usuda et al. 1991), DAOX (Usuda et al. 1986), HOX-B (Yokota et al. 1985), and BP (Usuda et al. 1991).
Immunoblot Analysis
The kidney tissues were homogenized in 10 volumes of 10 mM potassium phosphate, pH 7.5/150 mM NaCl/1% Triton X-100 with a teflon homogenizer. The solubilized preparations were heated at 100C for 5 min in sample buffer solution containing 1% SDS. They were subjected to SDSpolyacrylamide slab gel electrophoresis and immunoblot analysis was performed. Electrophoresis was conducted with a small slab gel (6 × 7 cm). After transfer to nitrocellulose membranes, they were stained as follows: 3% bovine serum albumin/150 mM sodium phosphate, pH 7.4; staining with each primary antibody, anti-rat catalase, DAOX, HOX-B, and BP; goat anti-rabbit IgG antibody conjugated with horseradish peroxidase. Visualization was done with the reaction using 4-chloro-1-naphthol.
Light Microscopic Immunohistochemistry
Small pieces of kidney tissue were fixed in Methacarn solution (methanol-chloroform-acetic acid 6:3:1) for 48 hr at room temperature and embedded in paraffin (Shimizu et al. 1993). After deparaffinization and rehydration, 5- μm-thick sections were immunostained with monospecific antibodies employing the ABC method and reaction products were visualized by DAB reaction. They were observed with a Nikon Microphot-FXA light microscope after counterstaining with methyl green solution. Control staining was done using the IgG fraction of normal rabbit serum, using antibodies absorbed with purified enzymes, or omitting the step of staining with primary antibody.
Electron Microscopic Immunohistochemistry
Kidney tissues from seven groups were examined: embryonic Day 18, superficial and juxtamedullary cortex at postnatal Days 7, 14, and 28. Tissue processing and immunostaining were done basically as reported previously (Bendayan et al. 1983; Usuda et al. 1988). Small pieces of kidney tissue (approximately 1 mm × 0.5 mm × 0.5 mm) were fixed in 4% paraformaldehyde/0.1% glutaraldehyde/100 mM sodium phosphate, pH 7.4, at 4C. After rinsing in a cold solution consisting of 100 mM lysine/100 mM sodium phosphate, pH 7.4/150 mM NaCl and dehydration in a graded series of cold ethanol, they were embedded in Lowicryl K4M at −20C (Desjardins and Bendayan 1991). Ultrathin sections were cut on a Poter Blum MT2B ultramicrotome and collected on nickel grids with polyvinylformal membrane. They were immunostained with monospecific antibodies and a protein A-gold solution of 15-nm gold particles (EY Laboratories; San Mateo, CA) (Bendayan et al. 1983). Specimens were observed with a Hitachi H-700 electron microscope at an accelerating voltage of 150 kV after staining with uranyl acetate and lead citrate.
Classification of Developmental Stages
The presence of the immunoreaction was observed in relation to the developmental maturation stage of kidney tissues. For light microscopic observation, classification of developmental stages of the nephron was done according to the description by Reeves et al. (1978). Four developmental stages were set up on the basis of characteristics of the renal corpuscle, i.e., vesicle stage, S-shaped body stage, developing capillary loop stage, and maturing glomerulus stage. For electron microscopic observation, classification of developmental stages of the nephron was done according to the description by Larsson (1975). Four developmental stages, i.e., Stages I, II, III, and IV, were established mainly on the basis of characteristics of the proximal tubule regarding maturation of ultrastructure, microvilli, basal and lateral infoldings, and vacuolar apparatus such as apical endocytic vacuoles and lysosomes. (Larsson and Maunsbach 1975). The proximal tubule epithelium cannot yet be distinguished at Stage I and becomes recognizable by its position in the immature nephron at Stage II. Microvilli are not present in the epithelium at Stages I and II, first appear in the proximal tubules at Stage III, and develop to form a brush border with constant width at Stage IV. The apical endocytic vacuoles and lysosomes are rare at Stages I and II and become prominent in the proximal tubules, with their relative volume increasing, at Stages III and IV. These four stages in electron microscopic observation correspond approximately to the four stages in light microscopic observation (Larsson and Maunsbach 1980).
Quantitative Analysis
The size of peroxisomes was determined in the kidney tissues stained for catalase of the seven groups described above. The diameters or the long axes of the peroxisomes in circular or elongate profile were measured on the electron micrographs of the proximal tubules in each group. The developmental stage and part of the proximal tubule evaluated were as follows: stage III at embryonic Day 18, Stage III and early Stage IV in the superficial cortex at postnatal Day 7, convoluted part at Stage IV or later in the juxtamedullary cortex at postnatal Day 7 and in the superficial and juxtamedullary cortex at postnatal Day 14, and the almost mature convoluted part in the superficial and juxtamedullary cortex at postnatal Day 28. The labeling density, i.e., the number of gold particles per unit area of peroxisomes, for each enzyme was estimated in the proximal tubules at three developmental stages: Stage III at embryonic Day 18, early Stage IV in the superficial cortex at postnatal Day 7, and the almost mature convoluted part in the juxtamedullary cortex at postnatal Day 28. Cell organelles immunopositive for each enzyme were regarded as peroxisomes. Their area and the number of gold particles on them were measured with an image analyzer, LUZEX-III (Nireco; Tokyo, Japan). Fifty peroxisomes photomicrographed at × 30,000 from each group were evaluated. Statistical analysis was carried out by analysis of variance (ANOVA), and the differences between respective groups were judged to be significant at p<0.05.
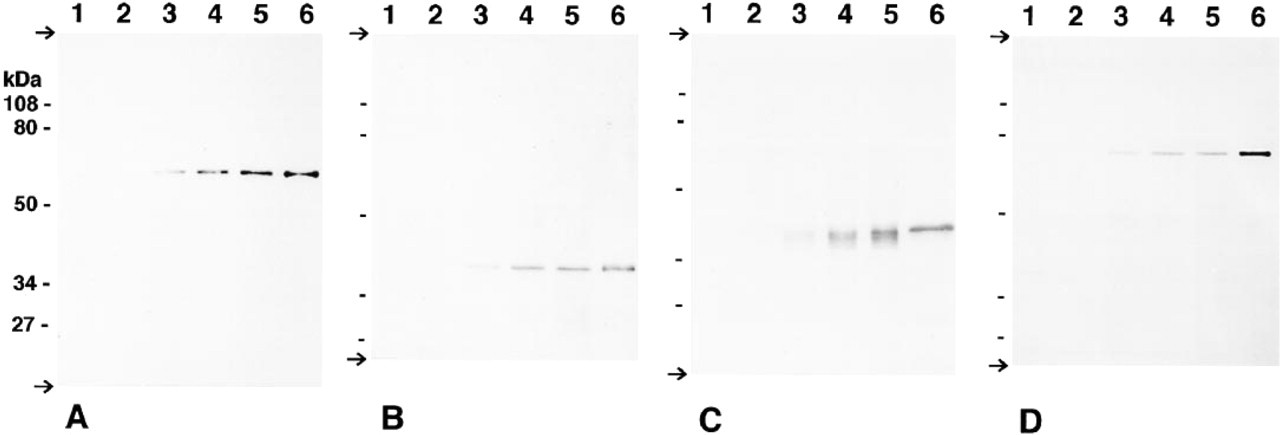
Immunoblot analysis of homogenates of rat kidney at embryonic Days 16, 18, postnatal Days 1, 7, and 14 (Lanes 1, 2, 3, 4, and 5), and purified enzyme (Lane 6) for catalase (
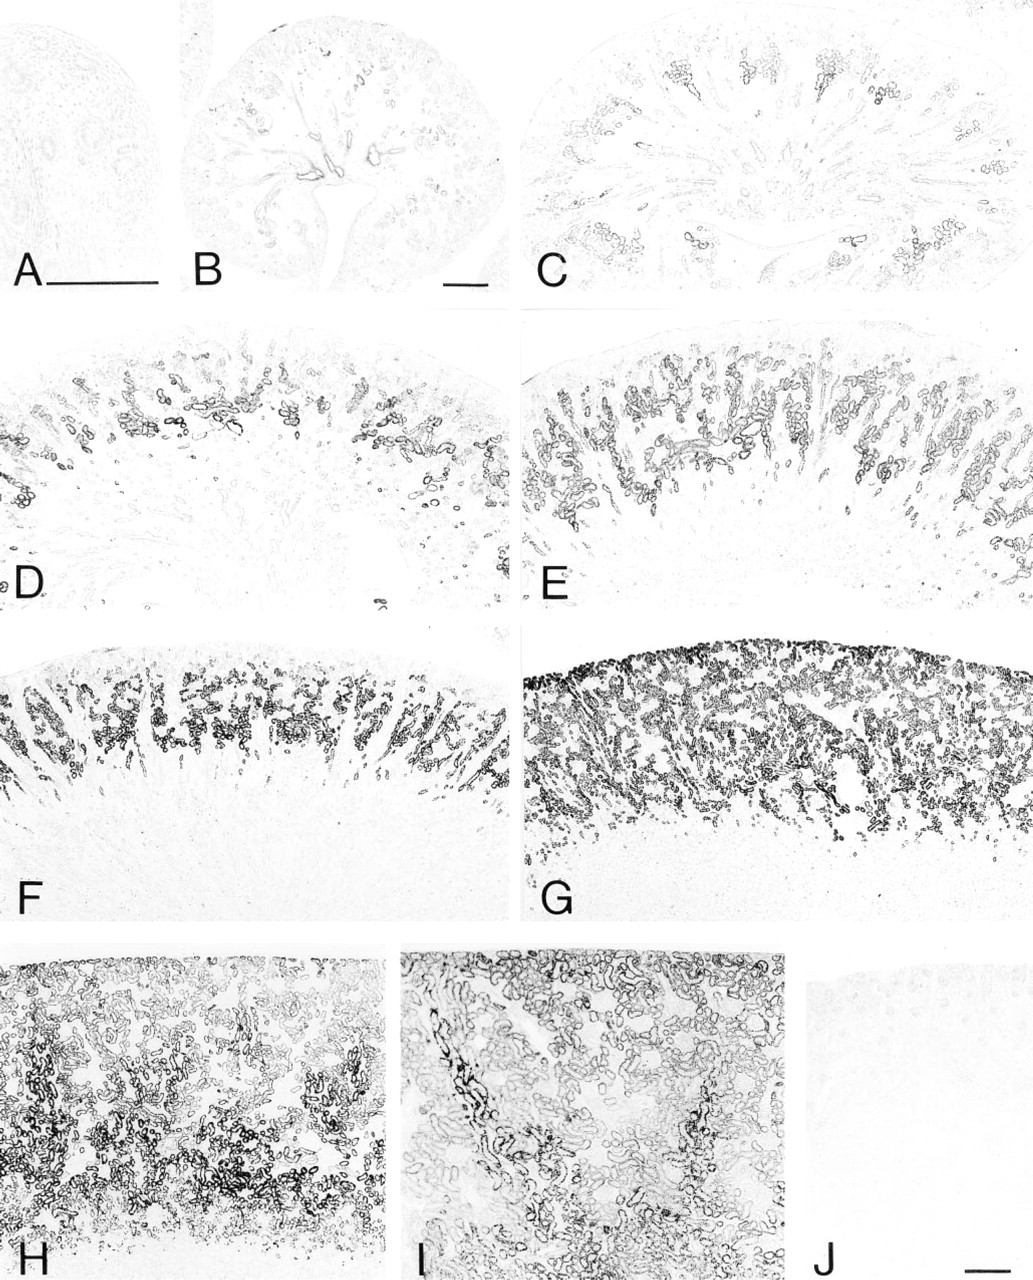
Light micrographs of rat kidney tissues stained for catalase at embryonic Days 16 (
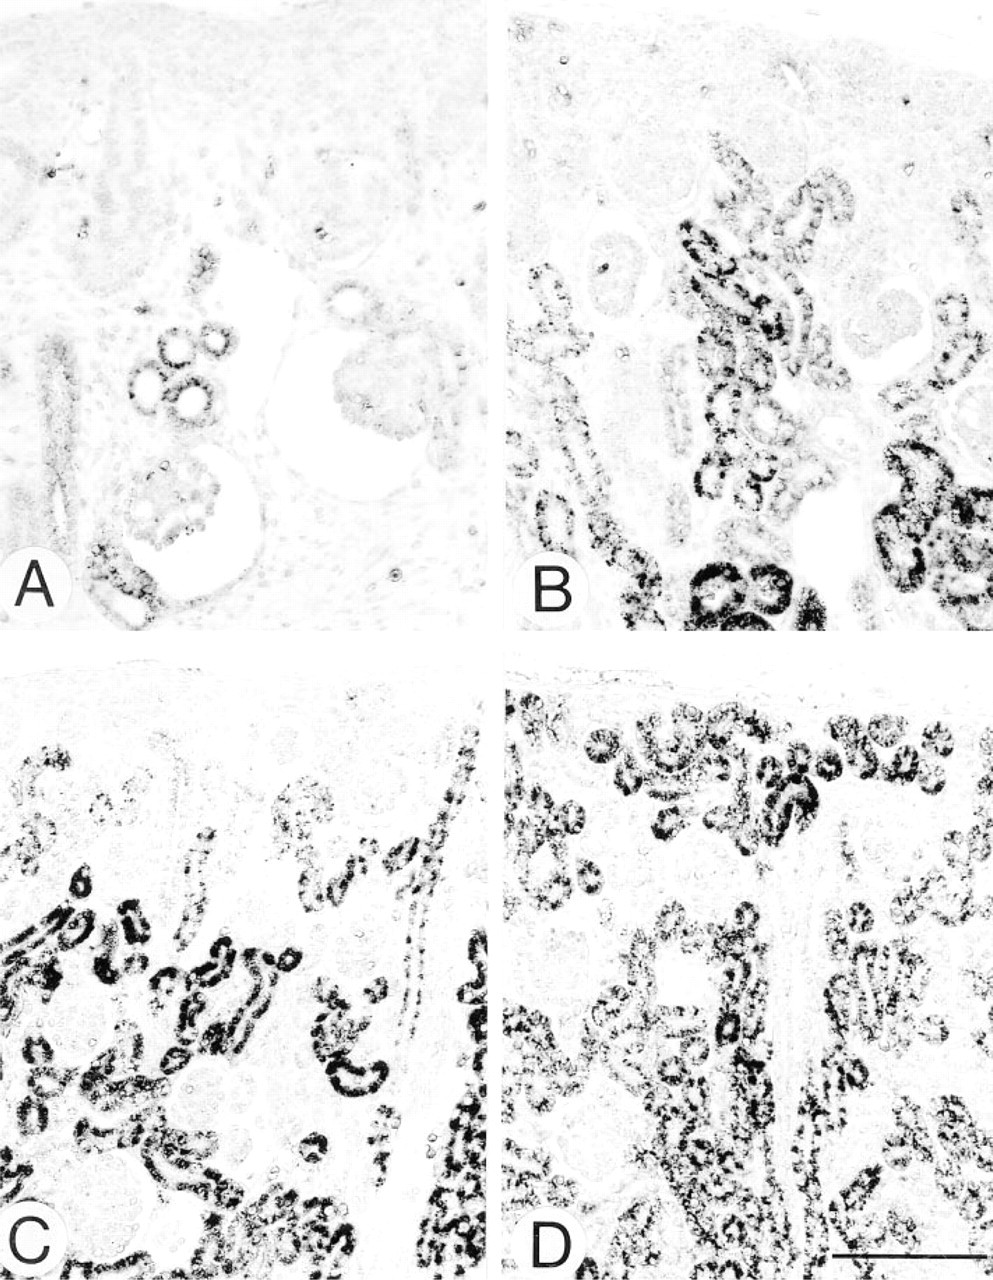
Light micrographs of the same specimens as in Figure 2 at highpower magnification, at embryonic Day 18 (
Results and Discussion
The course of the appearance of peroxisomal enzymes was analyzed by immunoblot analysis and by light and electron microscopic immunohistochemistry. Methacarn solution was used as fixative for light microscopic immunohistochemistry. The excellence of Carnoy's fixative for light microscopic visualization of peroxisomal enzymes in paraffin sections was reported by Lehmann et al. (1995). For electron microscopic immunohistochemistry, the immunogold technique was employed because it is the best method for visualizing the localization of enzymes and the substructures in the cell organelles (Bendayan 1984).
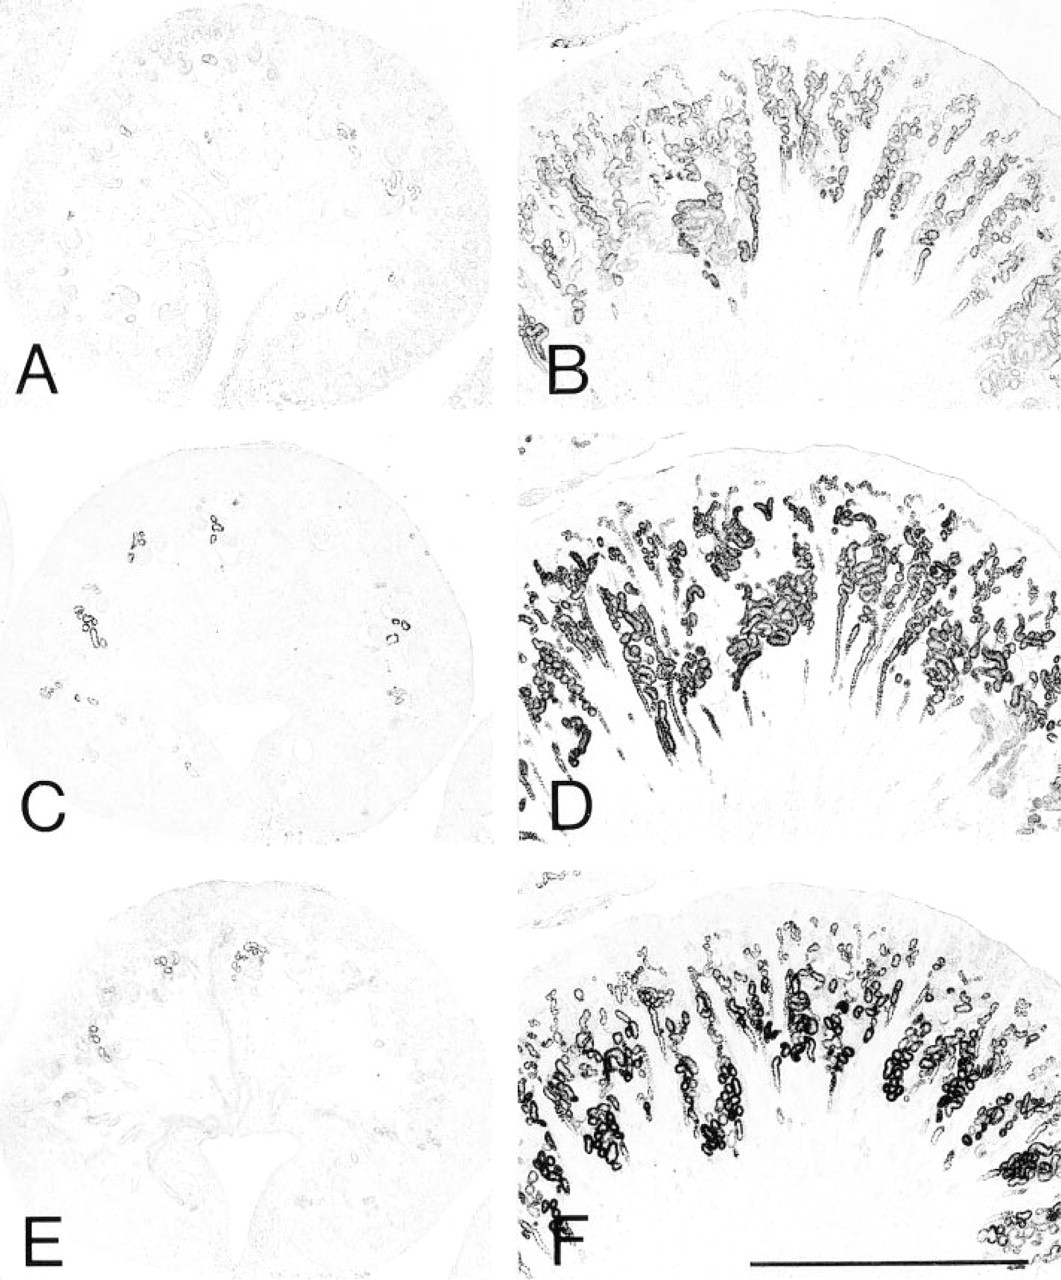
Light micrographs of rat kidney tissues stained for DAOX (A, B), HOX-B (
Figure 1 shows the results of the immunoblot analyses performed to demonstrate the presence of four peroxisome-specific enzymes: catalase, DAOX, HOX-B, and BP (Figures 1A-1D) in the developing kidney tissues at various ages. Each antibody gave a single signal with rat kidney homogenates at the same mobility as the purified enzyme. All of them were undetectable at prenatal Days 16 and 18. Each was weakly detectable in the kidney homogenate at postnatal Day 1. The signal became obvious at postnatal Day 7, and the size of the signal increased at postnatal Day 14, along with development. The time courses of the appearance of each enzyme seemed to be generally parallel.
Light Microscopic Immunohistochemistry
Figures 2–4 illustrate the light microscopic immunohistochemical localization of four peroxisome-specific enzymes in the developing kidney tissues, shown as a brown deposit of DAB reaction product. Figure 2 shows developing kidney tissues stained for catalase, indicating the tissue area positive for catalase. Figure 3 consists of high-power magnification pictures of the same specimens, showing the nephron positive for catalase. Immunostaining for catalase was negative in the kidney cortex at embryonic Day 16, in which immature nephrons at the vesicle and S-shaped body stages were identified (Figure 2A). Kidney cortex tissue at embryonic Day 18 consisted of developing nephrons from the vesicle to maturing glomerulus stages (Figures 2B and 3A). The positive staining was localized in a small number of proximal tubules near the juxtamedullary renal corpuscles at the developing capillary loop or maturing glomerulus stage, but the nephrons at the vesicle and S-shaped body stages in the outer zone of the cortex were negative for staining (Figure 3A). The number of immunopositive nephrons at the developing capillary loop and maturing glomerulus stages increased in the juxtamedullary cortex at embryonic Day 20 (Figure 2C). The tissues of the cortex matured along with kidney development, in which the outermost zone of the cortex remained immature and its thickness gradually decreased relative to the entire thickness of the cortex (Figures 2D-2F). The distribution of proximal tubules with positive staining expanded towards the surface of the kidney. The staining was more intense in the proximal tubules located in the juxtamedullary cortex and outer medulla than in those of the superficial cortex. The outermost zone of the cortex, negative for staining, consisted of nephrons at the vesicle and S-shaped body stages at postnatal Days 1 and 4 (Figures 2D, 2E, and 3B). The immunopositive nephrons in the inner zone of the cortex belong to the developing capillary loop and maturing glomerulus stages in the same periods, in which convoluted and straight parts of the proximal tubules gradually came to be distinguishable (Figures 2D, 2E, and 3B). At postnatal Day 7, the outermost zone of the cortex became weakly positive for the staining where nephrons at the developing capillary loop stage were predominant, and the proximal convoluted and straight tubules were easily distinguished in the superficial cortex (Figures 2F and 3C). The positive staining in the proximal tubules was observed in the full thickness of the cortex and the outer stripe of the outer medulla at postnatal Day 14 (Figures 2G and 3D). The kidney tissues at postnatal Day 28 (Figure 2H) and Week 10 (Figure 2I), whose cortices were positively stained in the full thickness, exhibited a characteristic staining pattern, with the straight part or S3 segment of the proximal tubules in the outer stripe of the outer medulla and medullary rays being most intense. This staining pattern for catalase has been reported in mature kidney tissues in previous studies employing the DAB reaction and in situ hybridization (Beard and Novikoff 1969; Schad et al. 1996; Baumgart 1997). The absorption of the antibody with the antigen made the intensity of staining apparently decrease (Figure 2J).
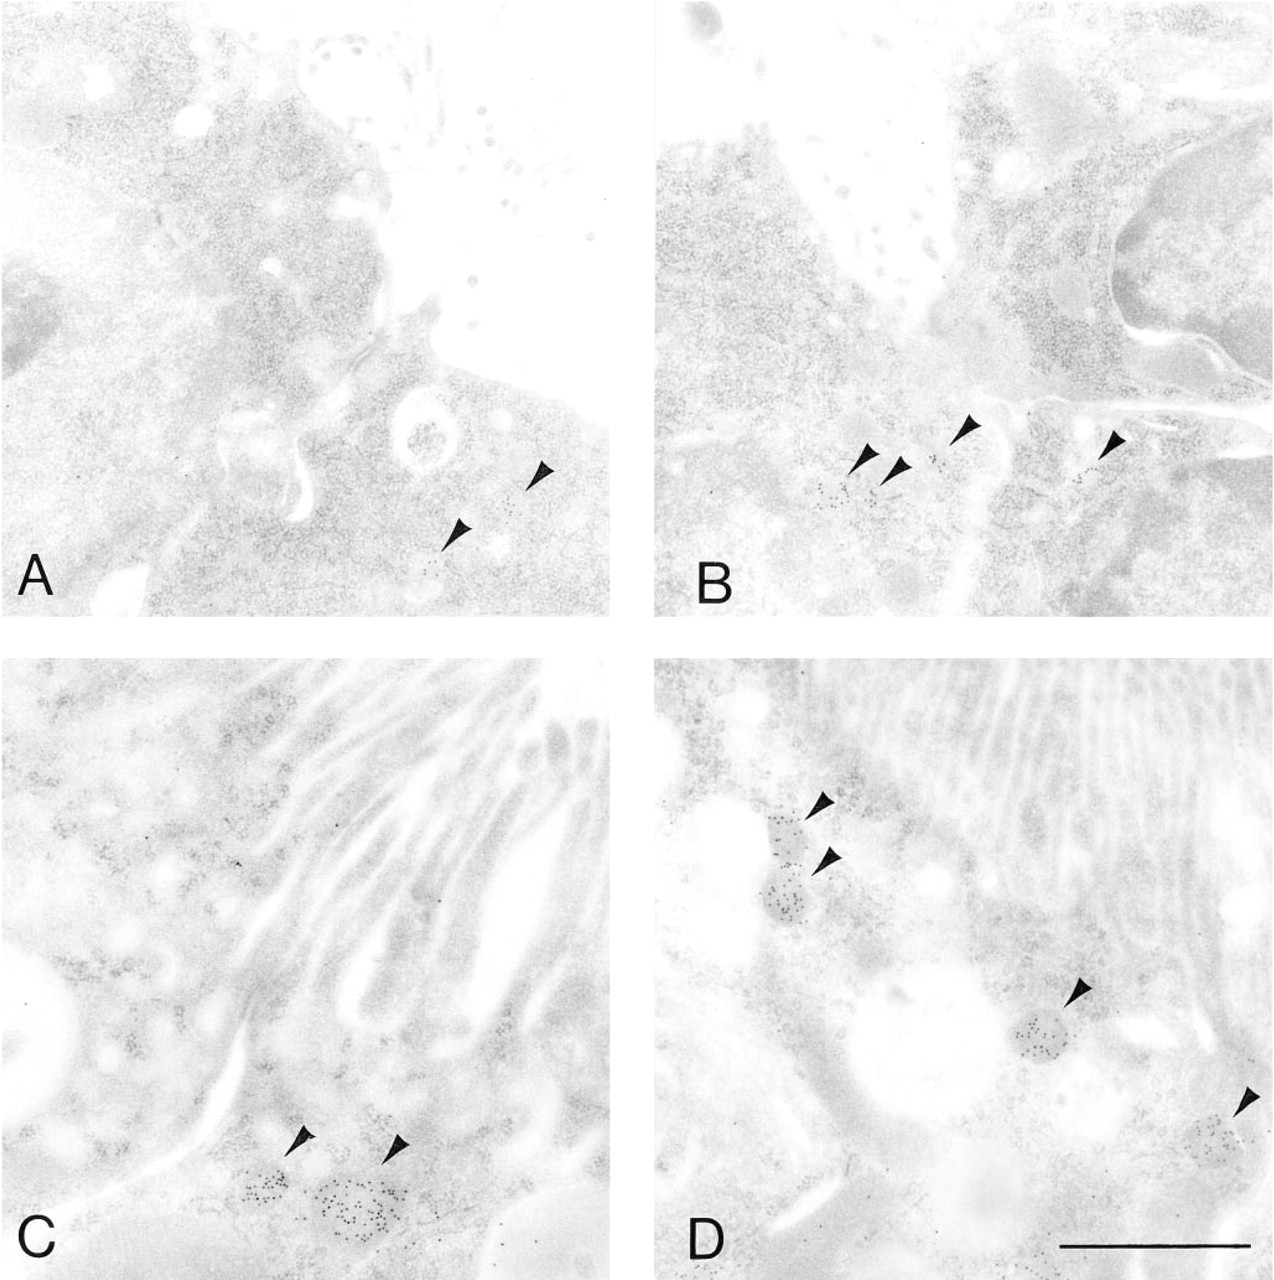
Electron micrographs showing the immunohistochemical localization of catalase in the juxtamedullary cortex at embryonic Day 18 (
Figure 4 illustrates the localization of DAOX (Figures 4A and 4B), HOX-B (Figures 4C and 4D), and BP (Figures 4E and 4F) in the developing kidney. Because the changes in localization of each enzyme were generally similar to those of catalase, findings in representative age groups are presented: embryonic Day 18 and postnatal Day 4. Immunostaining for each enzyme was negative in the kidney cortex at embryonic Day 16. Positive staining for each enzyme was found for the first time in a small number of proximal tubules around the renal corpuscles at the developing capillary loop and maturing glomerulus stages at embryonic Day 18 (Figures 4A, 4C, and 4E). The distribution of the proximal tubules positive for each enzyme was observed to expand towards the superficial cortex progressively during kidney development (Figures 4B, 4D, and 4F). The outermost zone of the cortex became weakly positive for each enzyme at postnatal Day 7 and the proximal tubules just below the renal capsule became clearly positive for each enzyme by postnatal Day 14. More intense staining for DAOX and BP, but less evident for HOX-B, in the proximal straight tubules was observed at postnatal Day 28 and Week 10, as previously reported for DAOX (Usuda et al. 1986). The light microscopic findings showed that the four enzymes appear coincidentally in the nephrons at the same developmental stage in the same region of kidney tissues. The distribution of each enzyme expands towards the surface of the kidney, with the amount of each enzyme increasing.
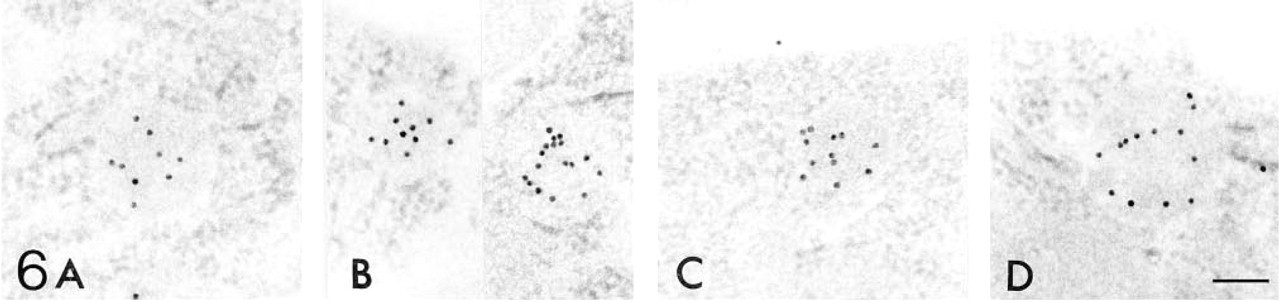
Electron micrographs showing the immunohistochemical localization of the peroxisomal enzymes catalase (
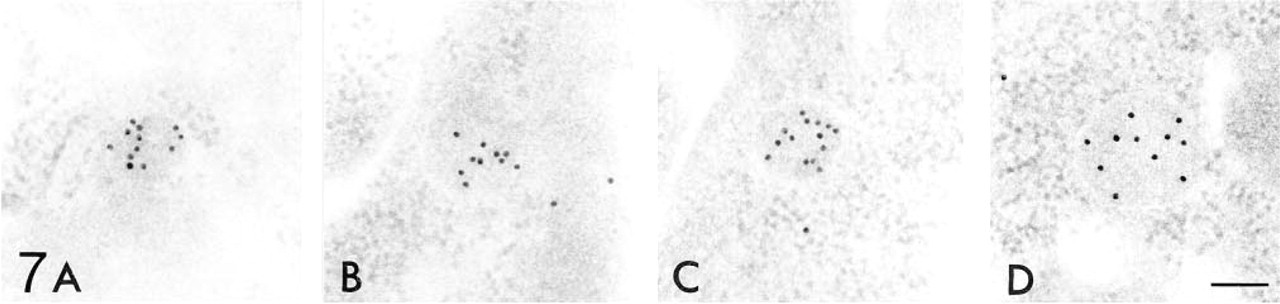
Electron micrographs showing the immunohistochemical localization of the peroxisomal enzymes catalase (Fig. A), DAOX (
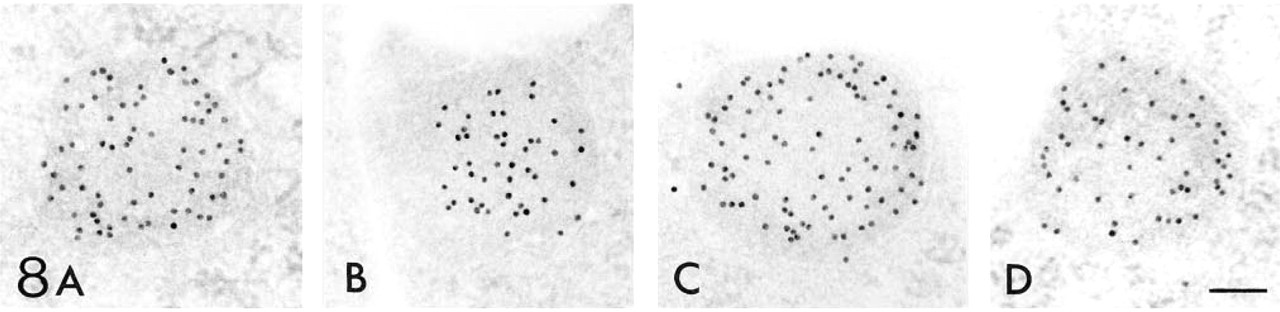
Electron micrographs showing the immunohistochemical localization of the peroxisomal enzymes catalase (
Electron micrographs showing the immunohistochemical localization of catalase (
Electron micrographs showing the immunohistochemical localization of catalase (
Electron Microscopic Immunohistochemistry Figures 5–12 show the electron microscopic immunohistochemical localization of peroxisomal enzymes in developing kidney tissues at the representative ages of embryonic Day 18, and postnatal Days 7, 14, and 28. Figure 5 illustrates the localization of catalase in developing proximal tubule epithelial cells at embryonic Day 18 (Figure 5A), postnatal Day 7 (Figures 5B and 5C), and postnatal Day 14 (Figure 5D) at low-power magnification. Staining was negative in the nephrons at Stages I and II in the kidney tissues at embryonic Day 18 as far as we observed (data not shown). Positive staining was observed in small particles, peroxisomes, in the proximal tubule epithelial cells in the juxtamedullary cortex at embryonic Day 18 (Figure 5A) and in the superficial cortex at postnatal Day 7 (Figure 5B), where weak positive staining for catalase was observed by light microscopic observation. Because some of these proximal tubules did not have dense microvilli forming the typical brush border, they can be categorized as Stage III (Figures 5A and 5B). Peroxisomes were also observed in more differentiated proximal tubules in the juxtamedullary cortex at postnatal Day 7 (Figure 5C) and superficial cortex at postnatal Day 14 (Figure 5D). These proximal tubules possess dense microvilli or brush borders and are categorized as stage IV or later. The size of peroxisomes in the proximal convoluted tubules appeared to be larger in the juxtamedullary cortex at postnatal Day 7 than in the superficial cortex at postnatal Day 14 (Figures 5C and 5D).
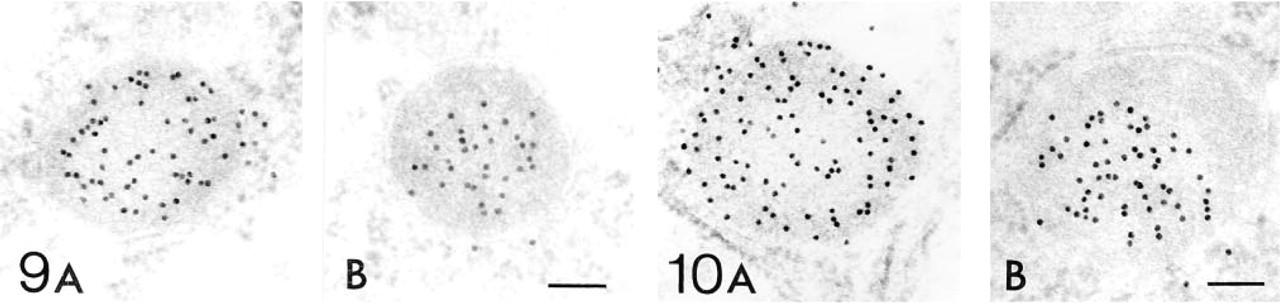
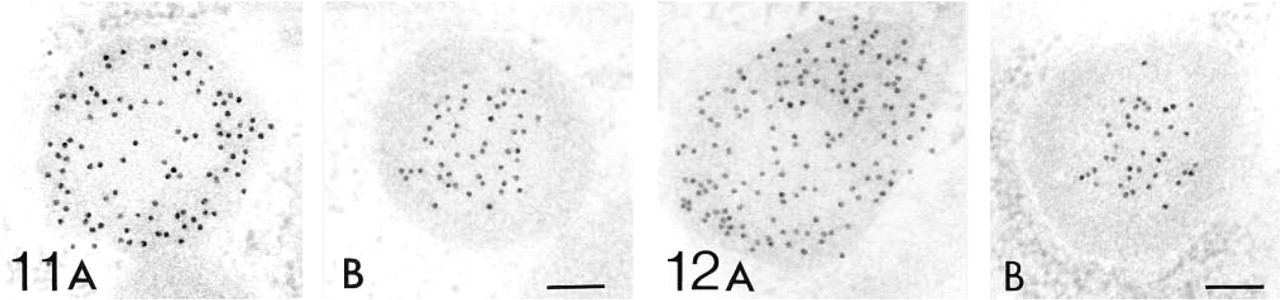
Figures 6–12 are high-power magnification electron micrographs of peroxisomes stained for four peroxisome-specific enzymes, showing the intra-cell organellar localization. Figures 6–8 show the immunohistochemical localization of the peroxisomal enzymes catalase (Figures 6A, 7A, and 8A), DAOX (Figures 6B, 7B, and 8B) HOX-B (Figures 6C, 7C, and 8C), and BP (Figures 6D, 7D, and 8D) in the juxtamedullary cortex at embryonic Day 18 (Figure 6), and in the superficial (Figure 7) and juxtamedullary (Figure 8) cortices at postnatal Day 7. Positive staining for each enzyme was observed in peroxisomes in the juxtamedullary cortex at embryonic Day 18 (Figure 6). The peroxisomes in the proximal tubules at Stage III were small, in diameter, approximately 0.1-0.3 mm (mean 0.202 mm) (Table 1) and can be categorized as microperoxisomes. The substructures such as the electron-dense peripheral matrix and central electronlucent matrix were not clearly observed and the four enzymes were distributed diffusely over the matrix in most peroxisomes [Figures 6A, 6B (left), 6C, and 6D]. However, in some peroxisomes the localization of DAOX was confined to the central area [Figure 6B (right)], showing the presence of the central electronlucent matrix. In the superficial cortex at postnatal Day 7, positive staining for each enzyme was detected in peroxisomes in the proximal tubules at Stage III (Figure 7) and those at early Stage IV (data not shown). The ultrastructure of small peroxisomes in the proximal tubules at Stage III, approximately 0.1-0.3 mm (mean 0.199 mm) in diameter (Table 1), was similar to that seen in the juxtamedullary cortex at embryonic Day 18, i.e., some did not have substructures and others did (Figure 7B). The peroxisomes in the proximal tubules at early Stage IV were larger than at Stage III, approximately 0.1-0.5 mm (mean 0.277 mm) in diameter (Table 1). In the juxtamedullary cortex at postnatal Day 7, peroxisomes of various sizes were observed in the proximal tubules that were more differentiated than at Stage IV, approximately 0.1-0.6 mm (mean 0.329 mm) in diameter in the convoluted part (Table 1). Four enzymes were localized preferentially in the appropriate subcompartments of large peroxisomes, as described previously (Yokota et al. 1987), i.e., catalase, HOX-B, and BP in the electron-dense peripheral matrix and DAOX in the central electron-lucent matrix (Figure 8). Figures 9–12 illustrate representative staining for catalase (Figures 9A, 10A, 11A, and 12A) and DAOX (Figures 9B, 10B, 11B, and 12B) in the proximal convoluted tubules in the superficial (Figures 9 and 11) and juxtamedullary (Figures 10 and 12) cortices at postnatal Days 14 (Figures 9 and 10) and 28 (Figures 11 and 12). These enzymes were localized mainly in the characteristic subcompartments of large peroxisomes, as seen in the juxtamedullary cortex at postnatal Day 7. At postnatal Day 14, the size of peroxisomes in the convoluted part in the superficial and juxtamedullary cortex was approximately 0.1-0.5 mm (mean 0.287 mm) and 0.1-0.6 mm (mean 0.325 mm) in diameter, respectively (Table 1). At postnatal Day 28, the size of peroxisomes in the almost mature convoluted part in the superficial and juxtamedullary cortex was approximately 0.1-0.7 mm (mean 0.325 mm) and 0.1-1.2 mm (mean 0.373 mm) in diameter, respectively (Table 1). Table 2 shows the labeling density for each peroxisome-specific enzyme over the peroxisomes in the proximal tubules at various developmental stages. The labeling densities for catalase, DAOX, HOX-B, and BP increased in the developing proximal tubules from Stage III to the almost mature stage. When the three enzymes, catalase, HOX-B and BP, were compared, the increase was more evident for catalase and HOX-B than for BP. This indicates that the increase in the amount of these enzymes in peroxisomes may vary with the kind of enzyme. The increase in labeling density for DAOX was not statistically significant, probably because the localization of this enzyme was restricted to the central electron-lucent matrix, which became gradually obvious. During development of proximal tubules at Stage III, early Stage IV, and the mature stage, the size of peroxisomes and the labeling density for peroxisomal enzymes increased. These electron microscopic findings showed that in the maturation of peroxisomes, in addition to the change in size and the appearance of definite subcompartments, the appearance of peroxisomal enzymes takes place in parallel with development of proximal tubules or aging.
Size of peroxisomes in developing kidney tissues
The peroxisome is defined as a cell organelle containing at least one H2O2-producing oxidase and H2O2-reducing catalase (de Duve and Baudhuin 1966). Because H2O2-producing enzymes, DAOX and HOX-B, an enzyme of the H2O2-producing metabolic system, BP, and catalase are present, the immunopositive cell organelles can be said to be peroxisomes. In short, renal peroxisomes appear in the Stage III nephron during the late embryonic period and are formed in the nephron at this stage located in the superficial cortex of developing kidney tissues of neonates. H2O2-producing peroxisomal oxidases and H2O2-reducing catalase were shown to appear in the developing kidney tissues coordinately.
The appearance of peroxisome-specific enzymes or peroxisomes with progressing development is consistent with previous reports dealing with the mammalian kidney. By biochemical and morphometric analyses, the enzyme activity of catalase was shown to be present in the kidney tissues of mouse embryos and to increase during postnatal development, correlating with the increase in the number of peroxisomes in the proximal tubules (Goeckermann and Vigil 1975). Biochemical studies also showed that the enzyme activity of catalase, DAOX, and palmitoyl-CoA β-oxidation increased during the development of rat kidney (Chan et al. 1979; Stefanini et al. 1994). The presence of peroxisomes was shown in the human fetal kidney by light and electron microscopy (Brière 1986). Stage III, during which peroxisomal enzymes were first detected in the present study, can be characterized by the appearance of distinct function of the nephron and by the fine structure of proximal tubules. Previous studies demonstrated that glomerular filtration and reabsorption in the proximal tubules occur first at Stage III (Larsson and Maunsbach 1975). The barrier function of the glomerular basement membrane, being poorly developed early in Stage III, was shown to differentiate gradually at the middle of this stage (Reeves et al. 1980). The development of the proximal tubule is also characterized morphologically by an increase in apical endocytic vacuoles and lysosomes, the elaboration of basal and lateral infoldings, the orientation of mitochondria perpendicular to the basement membrane, and the differentiation of microvilli or brush border. The microvilli were observed to first appear and the relative volume of apical endocytic vacuoles and lysosomes was observed to increase dramatically in the proximal tubules at Stage III (Larsson 1975; Larsson and Maunsbach 1975). The course of the appearance and the differentiation of peroxisomes shown in the present study temporally corresponds with this structural and functional differentiation of nephrons. An-other example of the coincidence of the differentiation of these two has been reported for the ultrastructure of peroxisomes in regenerating kidney tissues. A cytochemical study on the development of peroxisomes in the regenerating epithelium of proximal straight tubules of the rat kidney demonstrated that the formation of peroxisomes closely paralleled the differentiation of apical endocytic vacuoles and the brush border in regenerating tubule epithelium (Reddy et al. 1976).
Labeling density for peroxisomal enzymes in peroxisomes of developing proximal tubules a
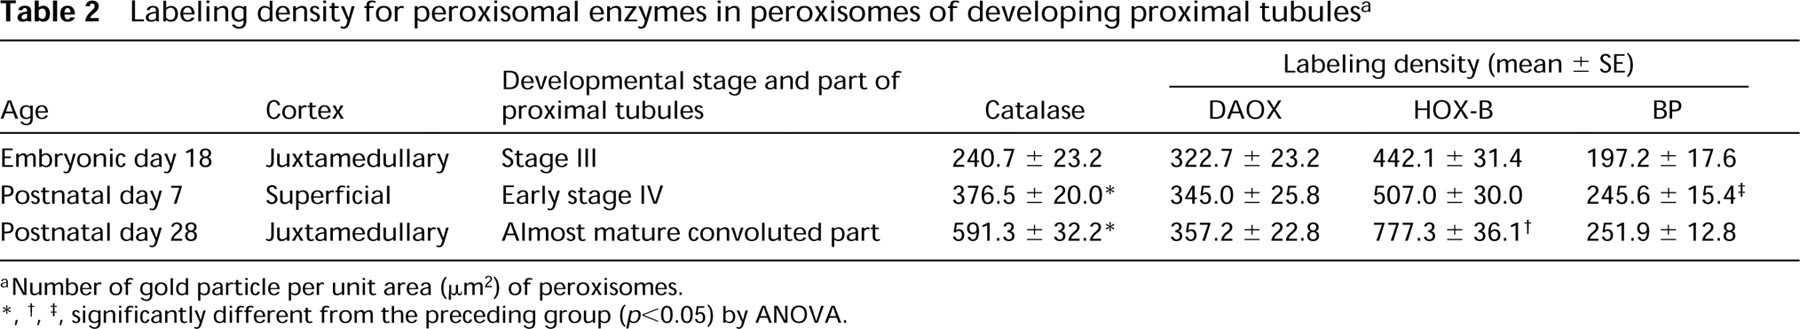
aNumber of gold particle per unit area (mm2) of peroxisomes.
∗, †, ‡, significantly different from the preceding group (p,0.05) by ANOVA.
Our observations and that on the regenerating kidney tissues indicate that the fine structure of peroxisomes might be a good marker for the differentiation of nephrons together with microvilli, apical endocytic vacuoles, and other structures in the proximal tubules. In other words, the presence of structurally or enzymologically discernible peroxisomes can be useful in identifying the nephrons at Stage III or at more differentiated stages.
Footnotes
Acknowledgements
Supported in part by a Grant-in-Aid for Scientific Research from the Ministry of Education, Science, Sports and Culture of Japan and by the Occupational Health Promotion Foundation.
We thank Dr Takashi Hashimoto for kindly providing the purified HOX-B and BP proteins and their antibodies. We appreciate the skillful technical assistance of Ms Naoko Ogiwara.