
Abstract
Oxygen insensitivity of carcinoma cells and oxygen sensitivity of non-cancer cells in the histochemical assay of glucose-6-phosphate dehydrogenase (G6PD) enables detection of carcinoma cells in unfixed cell smears or cryostat sections of biopsies. The metabolic background of oxygen insensitivity is still not understood completely. In the present study, rat hepatocytes, rat hepatoma cells (FTO-2B), and human colon carcinoma cells (HT29) were used to elucidate these backgrounds. The residual activity in oxygen was 0%, 55%, and 80% in hepatocytes, hepatoma cells, and colon carcinoma cells, respectively.
Keywords
Altman (1970) discovered that oxygen had different effects in normal and cancer cells on tetrazolium salt reduction in the histochemical assay of glucose-6-phosphate dehydrogenase (G6PD) activity. Activity of G6PD, the regulatory enzyme of the pentose phosphate pathway, was localized with the tetrazolium salt neotetrazolium chloride (NT) in carcinomas of the breast (Altman 1970). When the reaction was performed in an atmosphere of nitrogen, activity was observed in normal epithelium and cancer cells. However, when oxygen was present in the incubation medium, cancer cells still showed activity, whereas normal cells did not. This phenomenon is called oxygen insensitivity of cancer cells. The oxygen-insensitivity assay has been successful in specifically detecting cancer cells of the breast (Altman 1970; Petersen et al. 1985), bronchus (Butcher 1979,1982), stomach (Ibrahim et al. 1983), colon (Ibrahim et al. 1983), pancreas (Van Driel et al. 1999), and liver (De Jong et al. 2001). However, normal cells may also be oxygen insensitive as has been reported recently for thyroid epithelial cells by Kayser and Thomsen (2005). The best measure for the oxygen sensitivity/insensitivity phenomenon is the residual activity (RA), which is defined as the percentage of the amount of formazan produced by G6PD activity in oxygen and that produced in nitrogen. When RA in cells is <20%, these cells are considered oxygen sensitive and, therefore, non-malignant. Cells are considered oxygen insensitive and, therefore, malignant when the RA is >20% (Best et al. 1990; Griffini et al. 1994; Van Driel et al. 1997). The assay is particularly useful because it can be applied both to sections of biopsies and to brush cytology preparations. It has proven value in diagnosis of carcinoma of the pancreatic duct in brush cytology preparations (Van Driel et al. 1999).
Another aspect of the assay is that the oxygen insensitivity in colon biopsies of both man and mouse started to appear in adenomas (Van Driel et al. 1997). De Jong et al. (2001) have shown oxygen insensitivity also in rat liver neoplastic cells as well as preneoplastic cells.
Certain metabolic changes in cancer cells are responsible for the oxygen-insensitivity phenomenon, such as a combination of elevated G6PD activity, decreased superoxide dismutase activity, decreased lipid peroxidation capacity, and the absence of essential SH-groups in G6PD (Best et al. 1990; Griffini et al. 1994; Van Driel and Van Noorden 1999; Van Noorden 2000; De Jong et al. 2001). However, these changes do not yet completely explain the phenomenon. Therefore, we further investigated the chemical backgrounds of oxygen insensitivity of cancer cells in cancer cell lines of human colon (HT29) and rat liver (FTO-2B) and normal rat hepatocytes.
Materials and Methods
Hepatocytes
Hepatocytes were isolated from livers of 24-hr fasted male Wistar rats by perfusion with a collagenase-containing Krebs/Ringer bicarbonate buffer as described by Groen et al. (1982). Cells were kindly supplied by Dr. A.J. Meijer and Mrs. J. Weerts of the Department of Biochemistry, Academic Medical Center, Amsterdam, The Netherlands. After isolation, cells were suspended in PBS. Cells were transferred onto glass slides, dried, and stored at 4C up to 1 day.
Cell Lines
FTO-2B cells were derived from rat hepatoma and were kindly supplied by Prof. Dr. W.H. Lamers, Amsterdam Liver Center, Academic Medical Center, Amsterdam, The Netherlands. Cells were kept in a 1:1 mixture of F12 medium and DMEM with 4.5 g/liter glucose (Gibco BRL; Paisley, Scotland) containing 10% fetal calf serum, 100 IU penicillin/ml, and 100 mg streptomycin/ml (Life Technologies; Breda, The Netherlands). Cells were cultured at 37C in a humidified atmosphere of 5% CO2, washed with PBS, and detached with 0.05% trypsin. Finally, cells were suspended in 100 mM phosphate buffer (PB), pH 7.4, and transferred onto glass slides, dried, and stored at 4C up to 1 day.
Human colon cancer cells (HT29) were purchased from American Type Tissue Culture Collection (Manassas, VA). Cells were cultured in DMEM, supplemented with 10% fetal calf serum, 100 IU/ml penicillin, and 100 mg/ml streptomycin. After detachment with trypsin and EDTA, cells were suspended in 100 mM PB, pH 7.4, transferred onto glass slides, dried, and stored at 4C up to 1 day.
Histochemical Localization of G6PD Activity
Cells adhered to glass slides, dried at room temperature, and then incubated to demonstrate G6PD activity according to Van Noorden and Frederiks (1992). Incubation medium contained 18% (w/v) polyvinyl alcohol (PVA, average molecular mass 70,000-100,000; Sigma, St Louis, MO) in 0.1 M PB, pH 7.4, 10 mM glucose-6-phosphate (Boehringer; Mannheim, Germany), 0.8 mM NADP+ (Boehringer), 0.32 mM methoxyphenazine methosulfate (Serva; Heidelberg, Germany), 5 mM MgCl2, 5 mM sodium azide, and 5 mM nitro BT (Sigma). The medium was freshly prepared just before incubation and nitro BT was added after being dissolved in a heated mixture of dimethylformamide and ethanol (final dilution of each solvent in the medium was 2% v/v). Hepatocytes and FTO-2B cells were incubated for 10 min at 37C, and HT29 cells were incubated for 3 min at 37C. Control reactions were incubated in the absence of substrate and coenzyme (Van Noorden and Butcher 1984; Butcher and Van Noorden 1985). Involvement of SH-groups in G6PD activity was investigated by addition of 10 mM
Oxygen Insensitivity of G6PD Activity
Incubation media for the demonstration of oxygen insensitivity of G6PD activity were prepared as described above with the exception of replacement of nitro BT by neotetrazolium chloride (NT; Polysciences, Poole, UK). Test and control incubation media were poured into glass vials and equilibrated for at least 10 min at 37C in an atmosphere of either nitrogen or oxygen, using a tonometer to prevent formation of gas bubbles in the viscous media (Butcher 1978). The flow rate of the gases was 500-800 ml/min. Cells on glass slides were air dried for 5 min at 37C. After placement of plastic rings around the cells, media were poured onto the cells and glass coverslips were placed on top of the rings to keep the incubation media saturated with either nitrogen or oxygen. After 10 min of incubation at 37C, the reaction was stopped by rinsing off the viscous PVA-containing media from the cells using 0.1 M PB, pH 5.0, at 60C. Afterwards, cells were mounted in glycerol jelly.
Ultrastructural Localization of G6PD Activity
Hepatocytes, FTO-2B cells, and HT29 cells were incubated for the demonstration of G6PD activity at the ultrastructural level. Moreover, the effect of NEM on ultrastructural localization of G6PD activity in these cells was investigated by addition of 10 mM NEM to test incubation media. The procedure was performed as previously described (Frederiks and Vreeling-Sindelárová 2001,2002).
Approximately 107 pelleted cells were incubated in 0.5 ml of a solution of 20 mM NADP+ in 0.1 M PB, pH 7.4, for 10 min at 4C to protect the active site of G6PD (Frederiks and Vreeling-Sindelárová 2001). After centrifugation at 250 × g at 4C for 5 min, cells were permeabilized by adding 5 ml of a solution containing 0.025% (v/v) glutaraldehyde (Merck; Darmstadt, Germany) in 0.1 M PB, pH 7.4. Permeabilization was performed for 15 min at room temperature under continuous rotation of the tubes. The procedure was stopped by washing the cells three times for 1 min in 3 ml 0.1 M PB, pH 7.4, at 4C, followed by rapid centrifugation at 250 × g. Cells were resuspended in 0.5 ml of the same buffer. Cell suspensions (100 μl) were added to the histochemical media (1 ml) for demonstration of G6PD activity. Incubation was carried out for 30 and 60 min at room temperature under continuous rotation. Incubation medium contained 6% (w/v) PVA, 5 mM MgCl2, 5 mM sodium azide, 10 mM potassium ferricyanide (Merck), 30 mM sodium citrate, 30 mM cupric sulfate (BDH), 0.32 mM 1-methoxyphenazine methosulfate, 10 mM glucose-6-phosphate, and 0.8 mM NADP+ in 0.1 M PB, pH 7.4. Control reactions were performed by omitting glucose-6-phosphate and NADP+ from the incubation medium. After incubation, the reaction was stopped by adding 5 ml 0.1 M PB, pH 7.4, at 4C. Cells were washed three times with the same buffer, spun down rapidly at 250 × g, and resuspended in fixative.
Detection of Catalase Activity
Cells on glass slides were dried for 5 min at room temperature. Then, preparations were fixed with 0.5% v/v glutaraldehyde dissolved in 0.1 M sodium cacodylate buffer, pH 7.4, for 5 min at room temperature. After fixation, preparations were washed in distilled water and dried at room temperature. Enzyme reaction was performed as previously described (Angermüller and Fahimi 1981; Frederiks et al. 1995). Cells were incubated for 30 min at 37C in a medium containing 0.1 M glycine-NaOH buffer, pH 10.5, 2% w/v PVA, 5 mM 3,3′-diaminobenzidine (Sigma), and 44 mM H2O2. Incubation media were freshly prepared and H2O2 was added immediately before use. Final pH was adjusted to 10.5. After incubation, preparations were washed in distilled water and mounted in glycerol jelly. For electron microscopy, cells in suspension were fixed with 4% (w/v) paraformaldehyde and 1% (w/v) glutaraldehyde in 100 mM sodium cacodylate buffer, pH 7.4, for at least 1 hr at 4C. Afterwards, cells were rinsed with buffer. Then, cells were incubated for 30 min at 37C for ultrastructural localization of catalase activity using a medium containing 0.1 M glycine-NaOH buffer, pH 10.5, 5 mM 3,3-diaminobenzidine, and 44 mM H2O2.
Electron Microscopy
Cells incubated for ultrastructural localization of G6PD activity or catalase activity were mixed with fixative containing 1% (w/v) glutaraldehyde and 4% (w/v) paraformaldehyde in 0.1 M cacodylate buffer, pH 7.4, and fixation lasted for at least 60 min at 4C. Fixation was followed by centrifugation at 1000 × g at 4C. Cells were rinsed in 0.1 M cacodylate buffer, pH 7.4, for 30 min, postfixed in 1% OsO4 (Drijfhout; Amsterdam, The Netherlands) in 0.1 M cacodylate buffer, pH 7.4, for 60 min at 4C, dehydrated, and embedded in epoxy resin Lx-112 (Ladd; Burlington, VT) according to standard procedures. Semithin sections (1- to 2-μm thick) were cut on a Pyramitome (LKB; Uppsala, Sweden) and stained with methylene blue to check the quality of cell preservation. Ultrathin sections (50- to 70-μm thick) were cut on an LKB Ultratome III ultramicrotome and studied with an EM 10C transmission electron microscope (Carl Zeiss; Oberkochen, Germany).
Image Analysis to Quantify Histochemical Reactions
Formazan in cells was measured by image analysis according to Chieco et al. (1994) using a Vanox-T photomicroscope (Olympus; Tokyo, Japan) with a X20 objective (numerical aperture 0.70). Experiments were performed in triplicate, and two preparations were incubated per experiment. At least 100 cells per preparation were measured. Cells were illuminated with white light from a stabilized power supply after filtering by infrared blocking filters (Jonker et al. 1997) and a monochromatic filter of the isobestic wavelength of NT and NBT formazan (585 nm) (Van Noorden and Frederiks 1992). Images of groups of cells were captured using a CCD camera that was attached to a frame grabber (Scion image 1.59 for Mac; Scion, Frederick, MD) and a computer (8100; Apple Macintosh, Cupertino, CA). Gray values were converted to absorbance values by using a set of neutral density filters (Jonker et al. 1997). Absorbance values were converted into amounts (micromoles) of substrate converted per minute per area or per cell (Van Noorden and Frederiks 1992). Absorbance values of control reactions were subtracted from test values to obtain specific activity (Butcher and Van Noorden 1985). RA was calculated as percentage of the amount of formazan produced in the presence of oxygen and the amount that was produced in the presence of nitrogen (Griffini et al. 1994).
Statistical Analysis
Statistical processing of data was performed using Excel 97 (Microsoft; San Jose, CA) and SPSS 8.0 for Windows (SPSS; Chicago, IL). Data were expressed as mean values ± SD of three individual experiments. SD of each individual experiment was 5-10% of the mean value. A paired Student's
Results
G6PD activity as demonstrated with nitro BT as tetrazolium salt in hepatocytes, FTO-2B cells, and HT29 cells is shown in Table 1. Activity in rat hepatoma cells is 2.3 times higher than in rat hepatocytes, whereas human colon cancer cells contained five times higher G6PD activity than hepatocytes. Table 1 also shows that the RA as demonstrated with NT as tetrazolium salt is 0% in hepatocytes and 56% and 82% in hepatoma cells and colon carcinoma cells, respectively, confirming that these cells are cancer cells. The effect of NEM on G6PD activity as demonstrated with nitro BT as tetrazolium salt in the three cell types is shown in Table 1 as well. A clear effect of NEM on G6PD activity was found in hepatocytes, whereas NEM had hardly any effect on G6PD activity in hepatoma cells and colon cancer cells.
Ultrastructural localization of G6PD activity in the three cell types is presented in Figure 1. In hepatocytes, electron-dense final reaction product generated by G6PD activity was observed in the cytoplasm, in peroxisomes, and at membranes of granular endoplasmic reticulum (ER). In contrast, in hepatoma cells and colon cancer cells, G6PD activity was found only in the cytoplasm and at membranes of granular ER, but not in peroxisomes. Test as well as control reactions also gave rise to formation of electron-dense reaction product in nuclei and at the plasma membrane of the three cell types investigated. It is concluded that this reaction product is nonspecific and not due to G6PD activity.
Glucose-6-phosphate dehydrogenase (G6PD) activity in rat hepatoma cells and human colon cancer cells is expressed relative to that in hepatocytes which was taken as 1
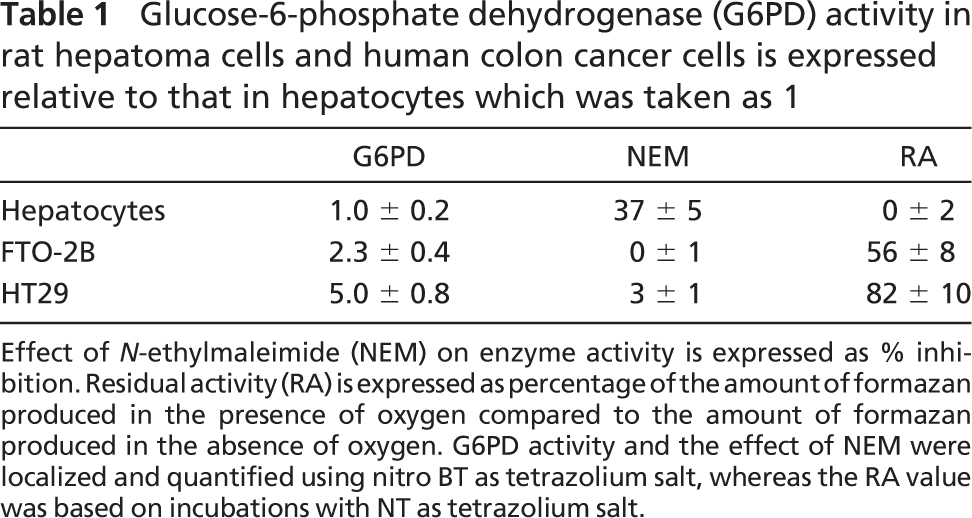
Effect of
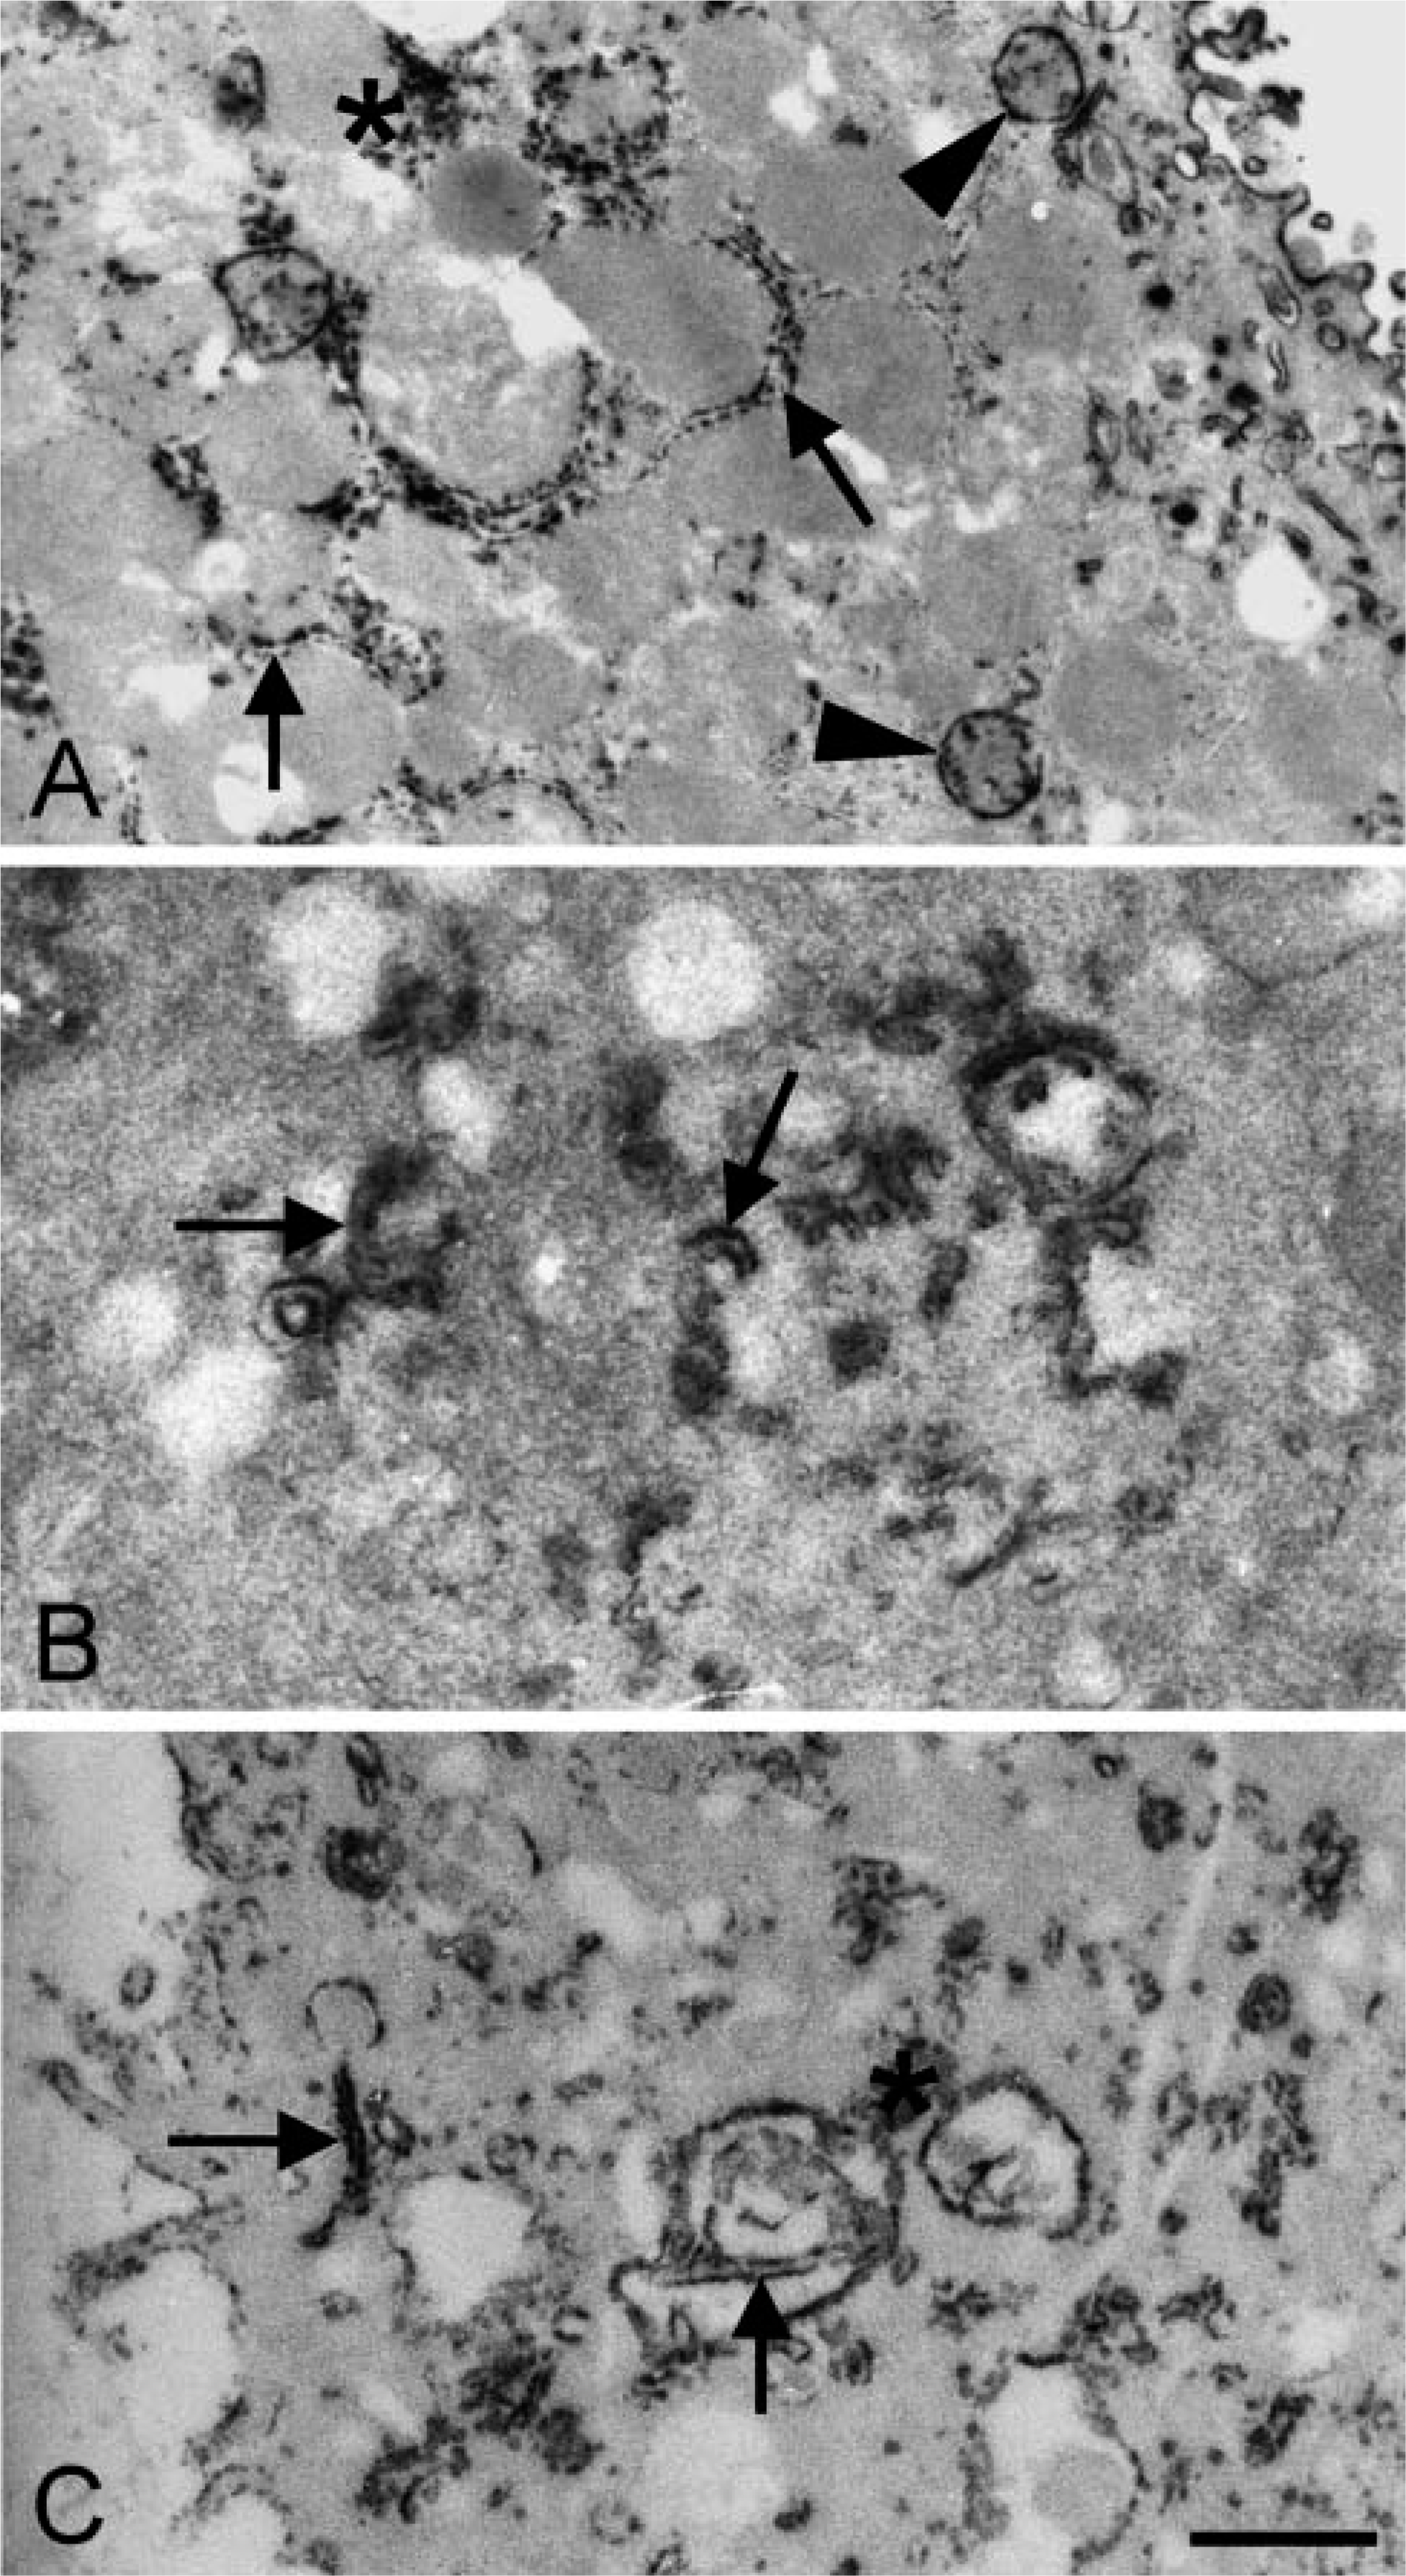
Electron micrographs of isolated rat hepatocytes (
When the incubation for the demonstration of G6PD activity in hepatocytes was performed in the presence of NEM, electron-dense reaction product was only observed in the cytoplasm and at membranes of granular ER, but not in peroxisomes (Figure 2). It is concluded that G6PD activity in peroxisomes only contains SH-groups at the active site.
Based on the different effects of NEM on G6PD activity in hepatocytes on the one hand and in hepatoma cells and colon cancer cells on the other hand, we hypothesized that peroxisomes were absent in cancer cells. For that purpose, incubations for the detection of catalase activity were performed using the three cell types. Final reaction product, precipitated as a brown diaminobenzidine polymer in a granular form, was found in hepatocytes but not in FTO-2B cells and HT29 cells (data not shown). Ultrastructurally, electron-dense reaction product was exclusively localized in peroxisomes of hepatocytes after incubation to demonstrate catalase activity (Figure 3). Electron-dense reaction product was not observed in FTO-2B cells and HT29 cells.
Discussion
The present study has demonstrated that a hepatocellular carcinoma cell line (FTO-2B) showed 2- to 3-fold increased G6PD activity as compared with that in hepatocytes (Table 1). The increase was less dramatic than in neoplastic cells in livers of rats treated with diethylnitrosamine where the increase was 6-fold (De Jong et al. 2001). However, oxygen insensitivity of G6PD was similarly detectable in FTO-2B and hepatoma cells in vivo and showed an RA of 50-60% (Table 1). Moreover, both types of hepatoma cells showed G6PD activity, which was hardly affected by NEM (Table 1).
A colon cancer cell line (HT29) had properties resembling those of FTO-2B with respect to G6PD (Table 1). G6PD activity in HT29 cells was five times higher than in hepatocytes, activity was not affected by NEM, and RA of G6PD activity was 80%. Oxygen insensitivity of HT29 cells was in accordance with findings obtained for human colon cancer (Best et al. 1990; Van Driel et al. 1997; Van Driel and Van Noorden 1999), mouse colon cancer (Van Driel et al. 1997), and metastases of colon cancer cells induced in livers of rats (Griffini et al. 1994). The importance of SH-groups in the oxygen-sensitivity phenomenon of G6PD as introduced by De Jong et al. (2001) has also been mentioned by Kayser and Thomsen (2005) using thyroid epithelial cells cultured under different conditions.
Oxygen insensitivity of the histochemical assay to detect G6PD activity in HT29 and FTO-2B cells and oxygen sensitivity of that in hepatocytes enabled us to further unravel mechanisms of oxygen insensitivity of G6PD in cancer cells. A major difference between normal cells and cancer cells was that G6PD activity was localized in peroxisomes in normal cells but not in cancer cells, whereas activity was found in the cytoplasm and at membranes of ER of all three types of cells (Figure 1). When studying the localization of G6PD activity in hepatocytes after treatment with NEM, reaction product was not found in peroxisomes but only in the cytoplasm and at membranes of ER (Figure 2). This means that peroxisomal G6PD, but not cytoplasmic G6PD and ER-related G6PD, contains SH-groups which are affected by NEM, indicating that cancer cells lack peroxisomes and thus SH-dependent G6PD activity. Indeed, both cancer cell lines that we have investigated lacked catalase activity, a marker enzyme for peroxisomes (Figure 3). This means that the schemes proposed by De Jong et al. (2001) for the oxygeninsensitivity phenomenon in the histochemical assay of G6PD activity using NT has been confirmed by the present findings obtained with cancer cell lines. SH-groups in the enzyme seem to be responsible for the decreased amounts of formazan produced in the presence of oxygen, due to the inhibiting effect of H2O2 on these groups. Other aspects mentioned earlier by Van Driel and Van Noorden (1999) such as high G6PD activity are relevant as well. High G6PD activity is important for the assay because an atmosphere of nitrogen and oxygen for the enzyme incubation is only reliable when the incubation time does not last longer than 10 min (Best et al. 1990). Increased incubation times give rise to anoxic conditions of the incubation due to the use of oxygen. Furthermore, the relatively low molecular extinction coefficient of NT formazan makes the assay relatively insensitive when compared with the formazan of other tetrazolium salts such as nitro BT and tetranitro BT (Van Noorden and Butcher 1984). Oxygen insensitivity of G6PD activity only seems to be true for adenocarcinoma cells and, for instance, not for fibrosarcoma cells (unpublished data). More studies are needed to understand this phenomenon.
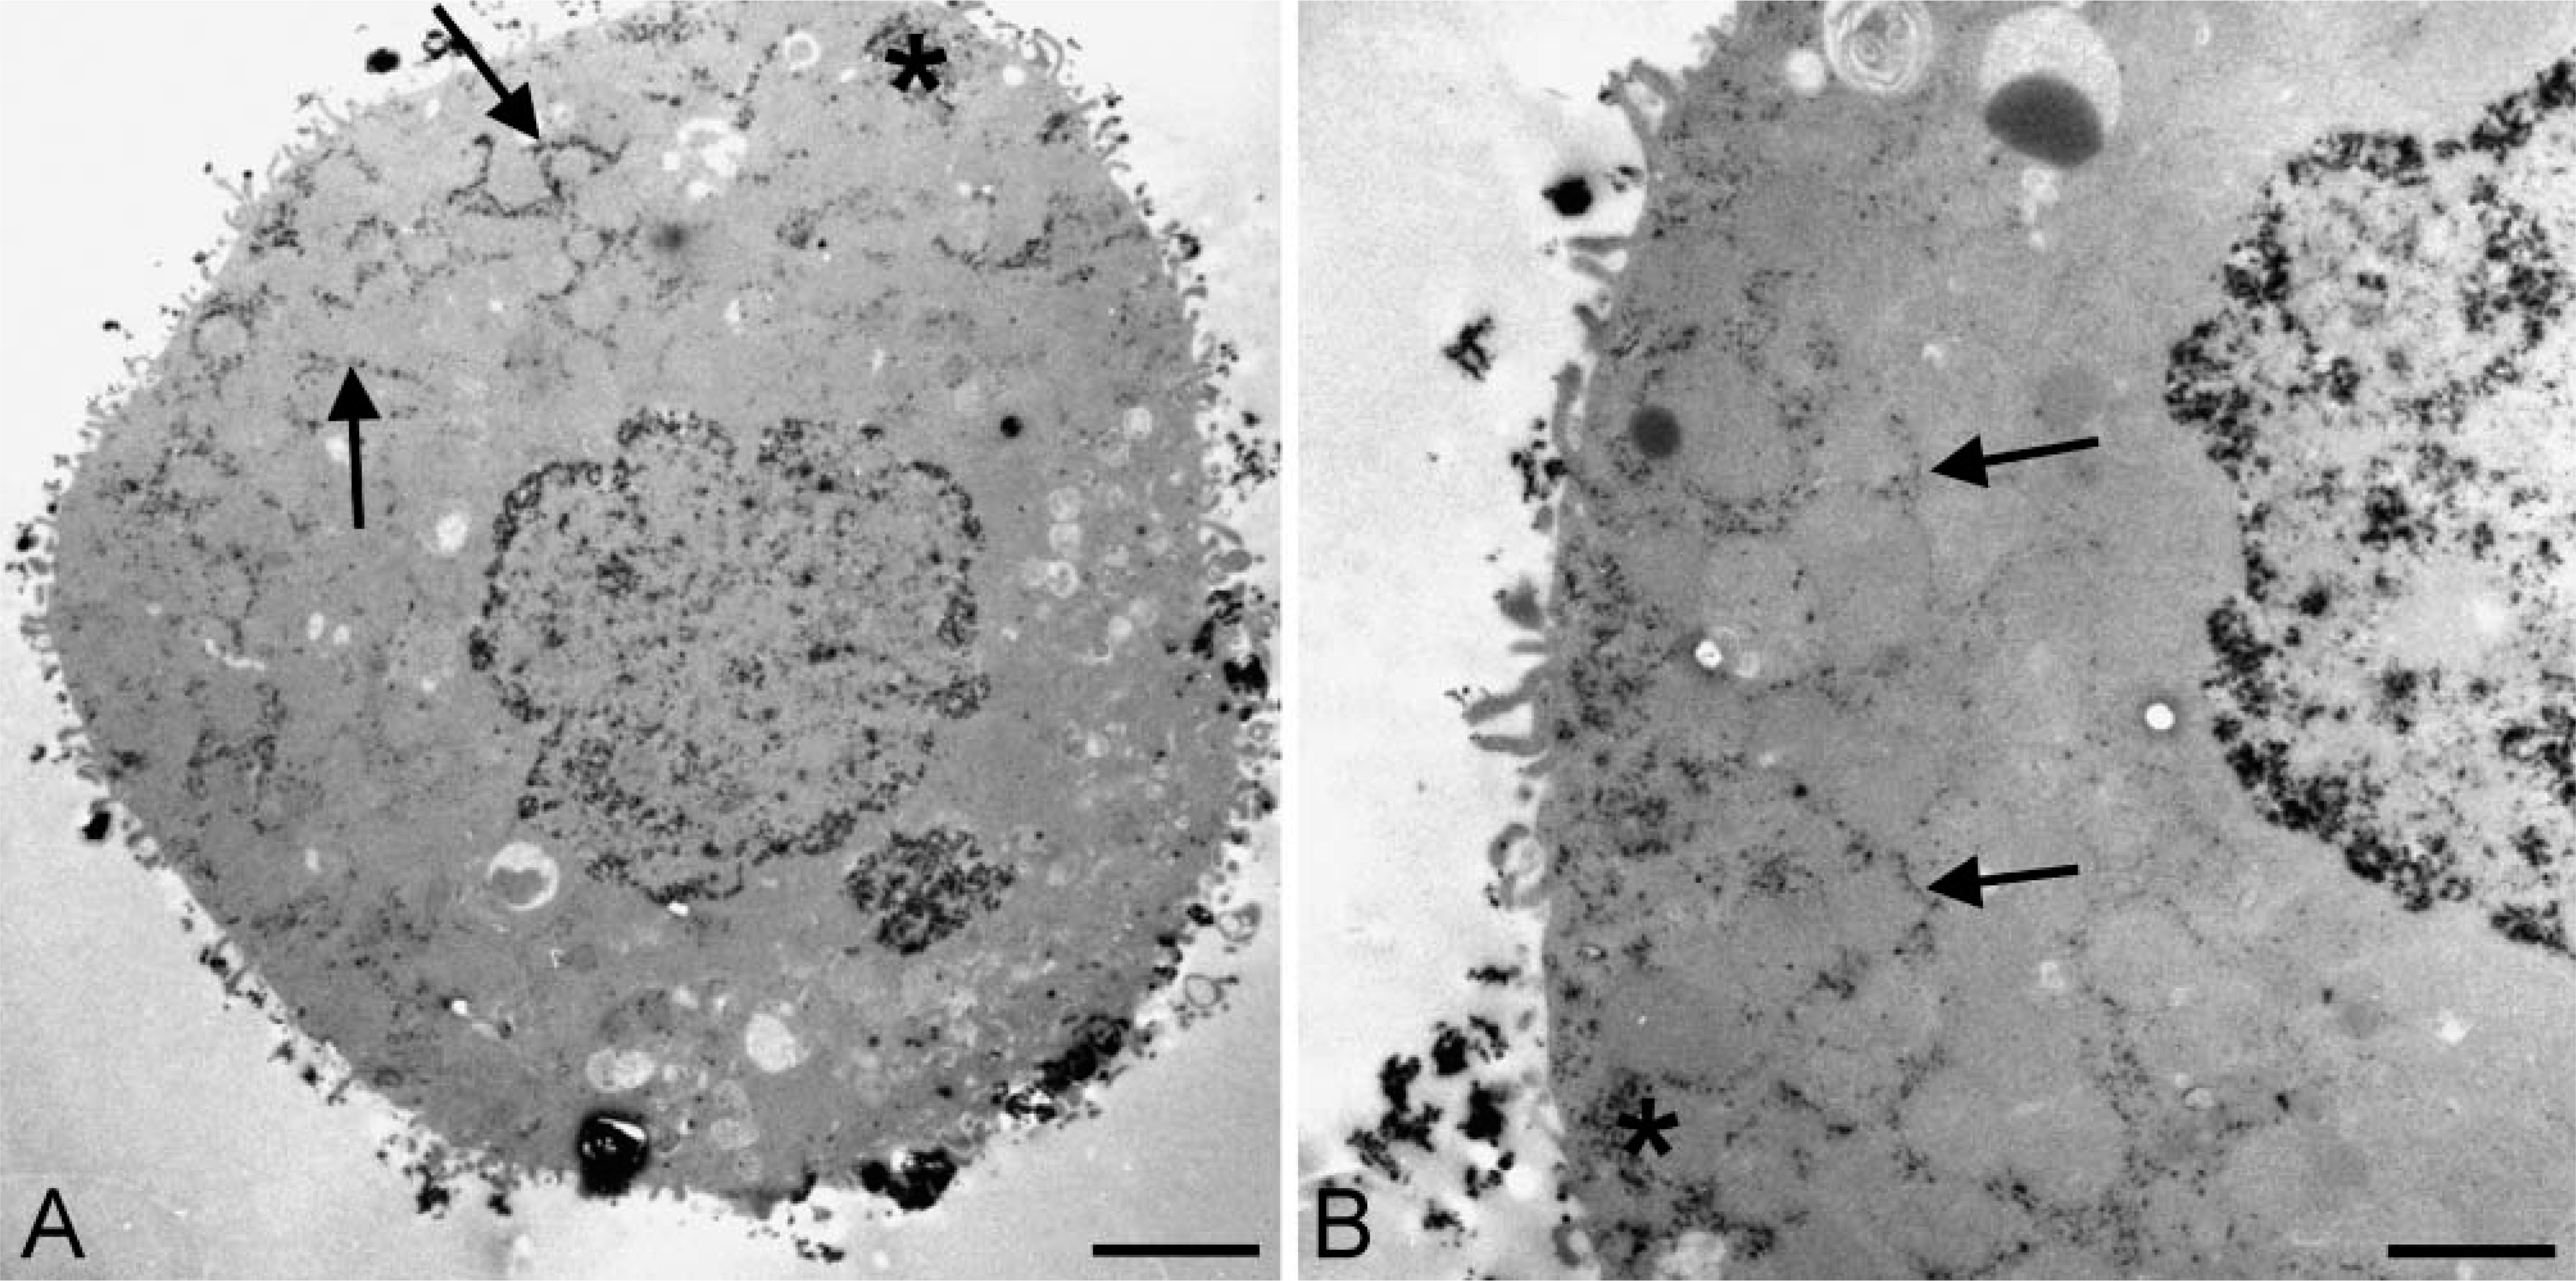
Electron micrographs of isolated rat hepatocytes incubated for the demonstration of G6PD activity in the presence of
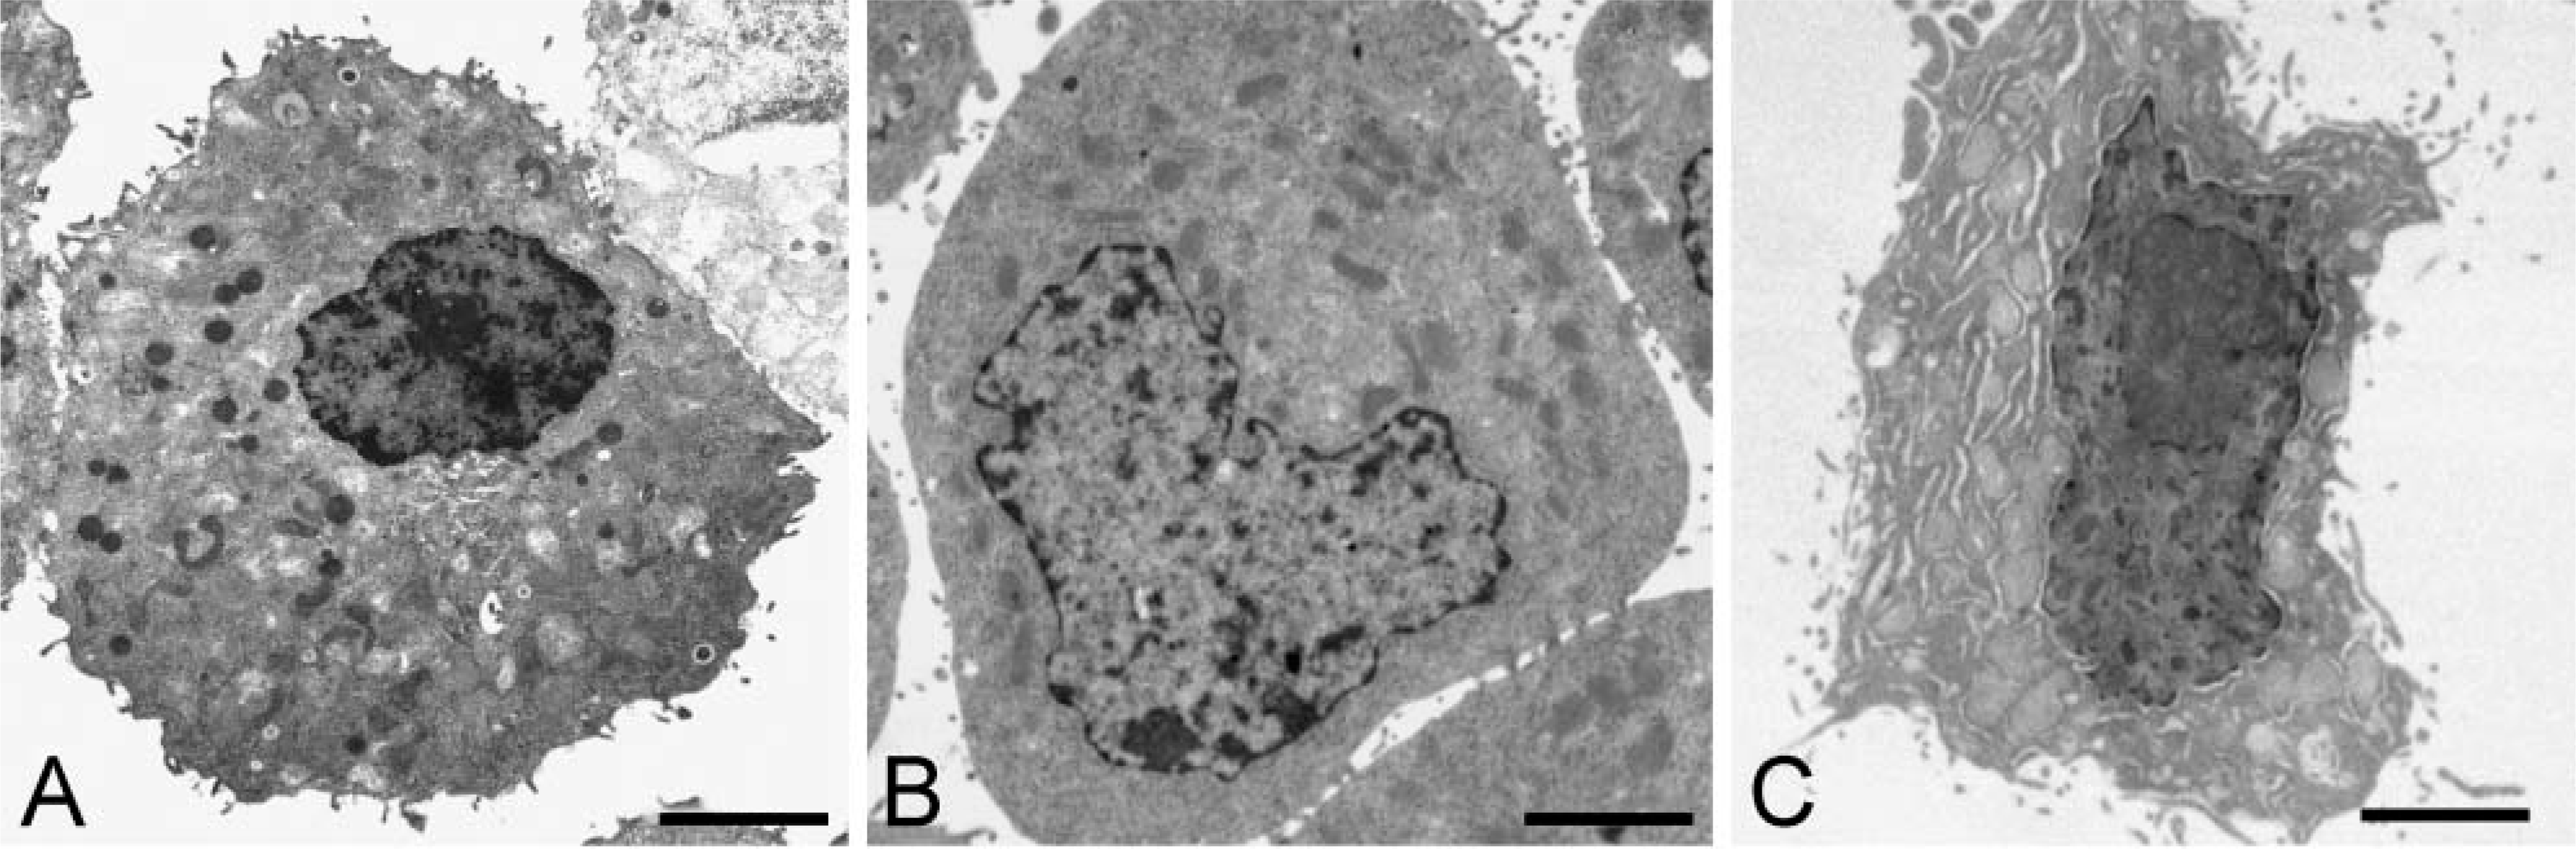
Electron micrographs of isolated rat hepatocytes (
From the above-mentioned findings and earlier literature findings, we can conclude that oxygen insensitivity of the histochemical assay of G6PD activity with NT enables the discrimination between normal cells and adenocarcinoma cells based on the absence of peroxisomes in adenocarcinoma cells.
Blumenthal and Brahn (1910) demonstrated that catalase is significantly reduced in the liver of animals with neoplasia. This was confirmed by more sophisticated studies (Greenstein 1954; Kampschmidt 1965; Ohnuma et al. 1966). Electron microscopic studies showed somewhat controversial results with respect to the presence or absence of peroxisomes in hepatocellular carcinomas. Convincing findings were presented by Litwin et al. (1999) using immunocytochemistry of catalase and peroxisomal lipid β-oxidation enzymes in human hepatocellular tumors. Reduction in antigenic sites and therefore in peroxisomes correlated with the degree of tumor dedifferentiation. Similar data were obtained in neoplastic lesions induced by peroxisome proliferators in rat livers (Yokoyama et al. 1992), human colon carcinomas (Baur and Wendel 1980; Cable et al. 1992; Lauer et al. 1999), and breast cancer (El Bouhtoury et al. 1992; Keller et al. 1993). The importance of the peroxisome in cell differentiation and carcinogenesis has been stressed by Masters and Crane (1998) in their review.
With respect to the presence of different isoforms of G6PD in liver parenchymal cells and normal epithelial cells, it has been established that G6PD activity is present in the cytoplasm, at membranes of ER, and in peroxisomes (Patel et al. 1987; Antonenkov 1989; Ozols 1993). However, it has not been determined whether localization of G6PD activity leads to different properties of the enzyme in mammalian cells. On the other hand, Esposito et al. (2001) clearly showed that two different isoforms of G6PD exist in barley roots. G6PD1 is localized in plastids and is sensitive to dithiothreitol, whereas G6PD2 is present in the cytosol and is less affected by reducing power. However, as far as we know, this phenomenon was not discussed for mammalian cells. Indications for sensitivity of G6PD for H2O2, hydroxynonenal and hydroxyl radicals were obtained with the enzyme from yeast (Szweda and Stadtman 1992; Friguet et al. 1994). Furthermore, Lushchak and Gospodaryov (2005) demonstrated that catalase is able to protect cellular proteins and, among others, G6PD in yeast against oxidative inactivation. Therefore, at least in yeast, peroxisomal G6PD seems to be sensitive to reactive oxygen species.
We can conclude that absence of peroxisomal G6PD in (pre)neoplastic cells is responsible for the oxygen-insensitivity phenomenon.
Footnotes
Acknowledgements
The authors thank students Ingrid Benito, Carine Martins Jarnalo, Marije van Santen, Marjolein Veenendaal, and Pedro Vizan for their contributions to the experiments, Mrs. Wikky Tigchelaar for her support in electron microscopy, Mr. Jan Peeterse for his help with the figures, and Mrs. Trees Pierik for preparation of the manuscript.