
Abstract
We used the nondestructive procedures of confocal laser scanning microscopy in combination with computer-assisted methods to visualize tumor cells in the process of penetrating collagen gels. Three independent sets of images were collected. The image information of all data sets was combined into one image, giving a three-dimensional (3D) impression at high light microscopic resolution and sensitivity. We collected information about the extracellular matrix using the reflection mode, the cell surface/morphology by staining with the fluorescent dye DiOC6(3), and the distribution of cathepsin B by Cy-3-labeled immunolocalization. The specific aim of our study was visualization of the spatial relationship of cell organelles as far as they contain the enzyme cathepsin B to cell morphology and motility in a 3D model of extracellular matrix. The majority of the enzyme was localized pericellularly, with no visible relationship to the direction of movement. However, substantial amounts also appeared in intramatrix pseudopodia and associated with the extracellular face of the plasma membane, which may be indicative either of secretion and/or epicellular activity. Our approach has general applicability to study of the spatial relationships of cell compartments and their possible reorganization over time. This could open new horizons in understanding cell structure and function.
BIOLOGICAL STRUCTURES have a dynamic three-dimensional (3D) organization. However, our understanding of structures and functions and their interrelations in cells is almost exclusively based on two-dimensional images and is therefore incomplete. In medical sciences, 3D imagery of whole organs or large anatomic regions of the body is possible by a number of noninvasive methods. Moreover, at the molecular level, spatial reconstitution of molecules or molecular assemblies is a common, although complicated procedure. At the cellular level, knowledge of spatial extension or interaction of structures at the light and electron microscopic level was obtained by destructive sectioning methods. Confocal laser scanning microscopy is now a well-established method to obtain optical sections of spatially extended biological objects (Brakenhoff et al. 1989; Masters and Farmer 1993; Wright et al. 1993). This precise and nondestructive procedure can render series of a sufficient number of equally thick sections to allow accurate 3D reconstitution of the imaged volume. The invention of appropriate fluorescent dyes and the development of specific antibodies to cell constituents are the last links in a chain leading to realistic 3D images of cells and their constituents.
Such a methodology is an ideal tool to study cell locomotion (movement). In situ, this is a 3D process. It involves complex rearrangements of the intracellular compartments, intercellular interactions, and interactions of cells with the extracellular matrix. Movement of cells through natural barriers (invasion) is a basic phenomenon in living organisms. In higher organisms, such invasive processes occur during all stages of development and maintenance of life. Of particular interest is the movement of tumor cells that leads eventually to metastasis. It is postulated that penetration of cells into the extracellular matrix involves a proteolytic cascade that includes the plasminogen activator system and collagenases (Mignatti and Rifkin 1993; Vassalli and Pepper 1994). Within this context, a function of the lysosomal cysteine protease cathepsin B has also been assumed but is still under dispute. In addition to a predominant activity in lysosomes, an extralysosomal and secretory activity has been described for cathepsin B (Berquin and Sloane 1994; Kirschke et al. 1995; Elliot and Sloane 1996). Light and electron microscopic investigations have provided evidence that cathepsin B and cathepsin B activity appear at the surface of tumor cells (Sylven et al. 1974; Sloane et al. 1987; Erdel et al. 1990; Rozhin et al. 1994; Sloane et al. 1994; Spiess et al. 1994). These findings, as well as its potential to digest in vitro compounds of the extracellular matrix (Lah et al. 1989; Buck et al. 1992) and to activate other enzymes involved in the proteolytic cascade (Kobayashi et al. 1991), led to the assumption of a direct and/or indirect role for cathepsin B in invasive processes. By means of a spatial model we investigated the cathepsin B distribution in tumor cells from human lung tumors penetrating a gel with a similar collagen composition as that of the interstitial space. A high number (60 or 79) of optical sections was obtained from the double-stained translucent assemblies. For the 3D reconstitution of the sectioned space, we used the software package “Application Visualization System” (AVS) (Foley et al. 1994; Sheehan et al. 1996) that was modified to meet the requirements of confocal laser scanning microscopy (Porwol et al. 1996). The reconstructed images obtained show the gel matrix, the cell surface, and the spatial relationship of the stained intracellular compartments containing cathepsin B. These images are superior to two-dimensional images and are unsurpassed in qualitity for a 3D presentation of cells.
Materials and Methods
Cells and Cell Culture
Two human lung tumor cell lines were used in our investigations: SB-3, which is derived from a metastasis of an adenocarcinoma (Schoenberger et al. 1987), and LCLC103H, which is derived from a large-cell carcinoma (Bepler et al. 1988). Culture conditions were as follows: RPMI 1640 medium supplemented with 6 mM L-glutamine, 0.22% sodium bicarbonate, and 10% fetal calf serum (full medium) (Biochrom; Berlin, Germany); humidified atmosphere of 5% CO2 at 37C. Cells grown to monolayers were detached by exposure to 0.02% EDTA-Na2 (Merck; Darmstadt, Germany) in PBS (140 mM NaCl, 50 mM KCl, 8 mM Na2HPO4, 1.5 mM KH2PO4, pH 7.2) and mechanically dispersed before subculturing or application to invasion chambers.
Experimental Setup
A chamber (12-mm inner diameter) with a glass bottom fitting to the microscope stage was used for the study of cells (Strohmaier et al. 1996).
The model for the interstitial matrix we used is collagen G (Biochrom). It is extracted from calfskin collagen and consists of 90% collagen Type I and 10% collagen Type III. We mixed 8 parts of collagen G with 1 part 7.5% NaCl and one part 0.2 N NaOH in 200 mM HEPES, pH 12.0, under sterile conditions. The solution (40 μl) was pipetted onto the bottom of the chambers and allowed to polymerize at 37C for 1 hr. The polymerized gels had a thickness of 100–300 μm.
Suspended in 200 μl of full medium, 104 cells were seeded into a chamber, which was transferred to a plastic petri dish and incubated for 24 hr under standard culture conditions.
Immunofluorescence
The cells were fixed in situ by methanol (-20C) for 5 min, washed two times with PBS for 5 min, and then for 5 min with PBS containing 0.1% BSA (Sigma Chemical; Deisenhofen, Germany). For detection of cathepsin B, the cells were incubated with the monoclonal antibody Ab-1 IM27 (Oncogene Science; Uniondale, NY, obtained from Dianova, Hamburg, Germany) diluted 1:50 in PBS for 45 min at room temperature (RT) in a humid atmosphere. This antibody was raised by the manufacturer to a peptide sequence of the mature part of the protein and should therefore detect propeptide and mature peptide. This specificity has been proved by others (Brix et al. 1996) and in our own Western blot analysis of tumor material and purified human cathepsin B. To remove unbound primary antibodies, we washed three times for 5 min with PBS; subsequently, the secondary antibody, Cy3-conjugated rabbit anti-mouse IgG (Dianova) diluted 1:50 in PBS, was applied for 30 min at RT and unbound antibodies were removed as described above. Finally, cells were stained for 5 min in 1 μg/ml of the fluorescent dye 3, 3′-dihexyloxacarbo-cyanine iodide [DiOC6(3); Molecular Probes, Eugene, OR] dissolved in PBS and were immediately studied with the confocal microscope.
Confocal Laser Scanning Microscopy
Confocal laser scanning microscopy (CLSM) was performed with an inverse LSM 410 UV (Carl Zeiss; Jena, Germany). To minimize lens aberrations, which can interfere considerably with acurate imaging, we used a water immersion objective (C-Apochromat 40X/1, 2 W Korr; 220 μm working distance, Carl Zeiss) and corrected for individual coverslip thickness. The refractive index of the matrix surrounding the cells was taken into account for calculation of the real physical dimensions in the 3D reconstructions. Series of 60 or 79 optical sections were produced (0.5 μm section distance; scanning speed 2 sec per image; pinhole setting 12). The gel was visualized via reflection mode with the 488-nm exitation wavelength of an argon ion laser. The same wavelength in combination with a 510–525 bandpass filter for detection of cell surfaces stained by DiOC6(3), and the 543 nm excitation of a helium–neon laser together with a 590 longpass filter, were used to record cathepsin B stained by Cy-3-labeled antibodies. Color-coded depth representation of image series is a feature of the CSLM 410 software for rapid demonstration of 3D extension of objects.
Three-dimensional Reconstruction
A program written in the computer language “C” was developed to allow automatic image processing using the native file format of the CLSM as well as compressed files. The command line driven program allows linear and nonlinear filtering as well as application of several edge detection algorithms (Porwol et al. 1996). Because filtering of large data sets (e.g., 3 × 512 × 512 × 60 pixels) is a rather time-consuming task, the initial data processing was done on a SPARC 10 workstation (SUN Microsystems; Mountain View, CA) equipped with 96 megabytes of RAM. The processed data sets were stored in the AVS field file format (see below) for subsequent processing on the SPARC 10 or INDY workstations (Silicon Graphics; Mountain View, CA) equipped with 192 MB of RAM and 1.8 GB of swap space. As described above, the data sets were scanned with a resolution of 512 × 512 × 60 pixels. The first step was the application of a 2D circular median filter (Huang et al. 1979) with a kernel size of 5. Because of the large memory requirements the data had to be averaged down on-line perpendicular to the optical axis by an arbitrary factor. Using the physical characterization of the settings (Strohmaier et al. 1996), the real coordinate extents were calculated (Carlsson 1991; Visser and Brakenhoff 1992) and the information was stored in the Application Visualization System (AVS) (AVS; Waltham, MA) field file format. We developed programs on the basis of AVS to perform the data visualization. A brief description of the AVS system with special emphasis on microscopy has recently been published (Sheehan et al. 1996). The features were processed as follows. Contours, well known in 2D (Ashkar and Modesting 1978), can easily be extended to 3D by calculating contours for a specific threshold for each optical section. Depending on the number of optical sections recorded with the CLSM, it was useful to flexibly reduce the number of slices taken into account. In the present study a threshold was chosen visualizing the extents of the cells. Furthermore, the isosurface was calculated for the volume data set using the same threshold. Calculation of the isosurface using the marching cubes algorithm (Lorensen and Cline 1987; Wilhelms and Van Gelder 1990; Thalmann and Thalmann 1991) results in a geometric object in contrast to commonly used volume rendering methods (Brakenhoff et al. 1989; Van der Voort and Brakenhoff 1990; Messerli et al. 1993; Van der Voort et al. 1993; Lucas et al. 1996). The calculation of the isosurface was repeated for the three individual data sets and a specific color was choosen for the three geometries, in particular, blue, red, and white for the cell extension [DiOC6(3)], the cathepsin B (Cy-3), and the collagen gel, respectively. The individual data sets showed a rather complex 3D structure. In particular, the data set obtained from the collagen gel had to be averaged down by a factor of 4 perpendicular to the optical axis. However, even with this reduced resolution a total number of about 6, 000, 000 triangles was obtained with the marching cube algorithm. Better resolution can be obtained but the memory requirements are rather large. For several reasons, it is helpful to have an “inside view” of the volumetric data sets generated by the CLSM. Here, we altered the transparency of the three different data sets to perform the data visualization. Calculation of the contours for some optical sections using the full resolution in the plane perpendicular to the optical axis enables us to represent the shape of the object. To show the physical dimensions of the objects, we used a cartesian coordinate system. All extensions are given in μm.
Results
The ability of cells to invade the extracellular matrix depends on their ability to interact with the matrix. In vivo, this eventually leads to directed movement of cells to particular sites. We studied penetration into reconstituted collagen by human lung tumor cells SB-3 and LCLC103H in 3D in vitro model systems. The cells were seeded on collagen G, which is a model substrate for interstitial space extracelluar matrix, and incubated for 24 hr before they were fixed in situ and stained for observation. In this experimental setup there is, other than gravity, no gradient along which the cells can move, and the depth of matrix by far exceeds the cell size. Experiments performed with beads resembling cells in size and mass showed that the surface strength of the gels is sufficient to support their mass. Therefore, we can assume that penetration into the gels depends on the active movement of the cells. An overview of SB-3 cells seeded on a gel is given in Figure 1A as a depth-coded reconstruction of a series of 32 consecutive images. It is clear that the activities of the individual cells were quite different. Some remained inactive on the surface of the gel. Active cells developed pseudopodia and moved into the gel. A 3D reconstruction of an SB-3 cell and the collagen matrix is shown in Figures 1B–1F. A series of 60 images was taken in the three recording modes and the images were combined by superposition. The physical dimensions of the recorded cuboid are 74.3 × 74.3 × 29.7 μm. The gel is given in white (reflection mode recording), the cell surface in blue [DiOC6(3) fluorescence staining], and cathepsin B in red (Cy-3 fluorescence indirect immunolocalization). The 3D shape of the cell is emphasized by contour lines (red) that were calculated for a fraction of the optical sections. Two different perspectives were selected to show the entire extension of the scanned cuboid (Figure 1B, view from the top; Figure 1C, view from the side and rotated clockwise for 90° with respect to Figure 1B). The collagen matrix is a 3D, randomly distributed fiber network. In the direct environment of the cell, an organization of the fibers with respect to cellular morphology can be found (Figure 1B). Fibers in contact with the prominent pseudopodium are oriented parallel to its extension. A radial orientation of fibers to the cell body is seen as well. This was a general observation. The fibers appear to be of different thicknesses. Reconstructions performed with higher resolution indicate that thick fibers are composed of several thin fibers that are closely apposed. The surface of the matrix is inclined with respect to the optical axis of the system (Figure 1C). This inclination is due to the parameters of the chamber and the surface tension of the collagen solution.
The surface of the cell appears to be very smooth. In contrast to other microscopic procedures, we can now image the complete surface of a cell. In the penetrating cells we found differences between the apical and basal surfaces. The apical surface had a predominantly smooth topography but the basal surface was strewn with small pocks. This polarity indicates a substrate-oriented cell activity. To exclude errors based on the optical system and image reconstruction procedure, we compared this result with scanning electron micrographs that provide a higher resolution. We found the same appearance of the apical cell surface in these images, but scanning electron microscopy does not allow visualization of the basal surface. The thin filopodia, present on the surface of cells when visualized by scanning electron microscopy, were absent in the reconstructions of light optical scans. These structures must be below the resolution limit of the reconstruction. Penetration of the cell into the collagen gel becomes visible in Figure 1D, in which we omitted the collagen matrix, thus opening the view on parts of the cell that were previously hidden. The cell generated a prominent pseudopodium stretched horizontally over the surface of the matrix and also extending into it. Isolated cell structures embedded in the matrix (Figure 1B) can now be identified either as parts of pseudopodia or as isolated vesicles. These vesicles provide evidence of the cell's exploratory activities by stationary motility or locomotion in the gel.
A comparison of the apparent cell morphology in Figures 1B–1D reveals that most of the volume of the bell-shaped cell is embedded in the matrix. Therefore, without any gradient other than gravity, there was a net movement of the cell in the vertical direction.
The intracellular localization of cathepsin B for this cell is shown in Figures 1E and 1F in top and side views, respectively. In Figure 1E the same point of view is shown as in Figure 1B, but the cubus is slighty tilted around the x-axis. For these images the gel was removed and the color of the cell surface was attenuated. The enzyme appears in sheet-like and vesicular structures highly concentrated in the central part of the cell. The spatial arrangement of this central assembly reveals a polarity. One side is smooth and concave (Figure 1F). This curvature suggests a close apposition of this face to the nucleus, which is thus negatively imaged. The opposite face appears to be dissolved into vesicular structures (Figure 1E). The entire staining pattern we observed should represent such parts as the endoplasmic reticulum, the Golgi complex, the trans-Golgi network, and lysosomes that contain cathepsin B, pro- and/or mature forms, respectively. Further cathepsin B-containing structures appear dispersed all over the cell. Figure 1E shows that cathepsin B could also be found in pseudopodia.
Cells of the line LCLC103H are shown in Figure 2. Figure 2A shows cells on a gel in a color-coded depth reconstruction from a series of 32 sections. These cells behaved similarly to the SB-3 populations shown in Figure 1A. In Figures 2B–2D, two cells on such a gel are presented in a reconstruction from a series of 79 sections. The attenuation of the gel in Figure 2C reveals the movement of the cells into the gel. Figures 2D–2F show particularly the distribution of cathepsin B in views from the top (Figure 2D), and the side (Figures 2E and 2F). The pseudopodium marked by an arrow in Figure 2D is seen at a higher magnification in Figures 2E and 2F. The cells appear very flat, and the translucent surface opens the view on the cathepsin B-containing organelles that also appear in the pseudopodium. Reconstruction of the plasma membrane reveals external cell surface-associated enzyme (Figure 2F). In these cells, the cathepsin B distribution is very similar to that found in SB-3 cells. However, the plasma membrane-associated cathepsin B was observed much more frequently. In addition, the calculation of isosurfaces allowed precise quantitative determination of volumes. The total volume of the SB-3 cell shown in Figure 1B was determined to be about 15 μm3 and the volume of the cathepsin B-containing structures to be about 1.183 μm3. This is about 8% of total cell volume.
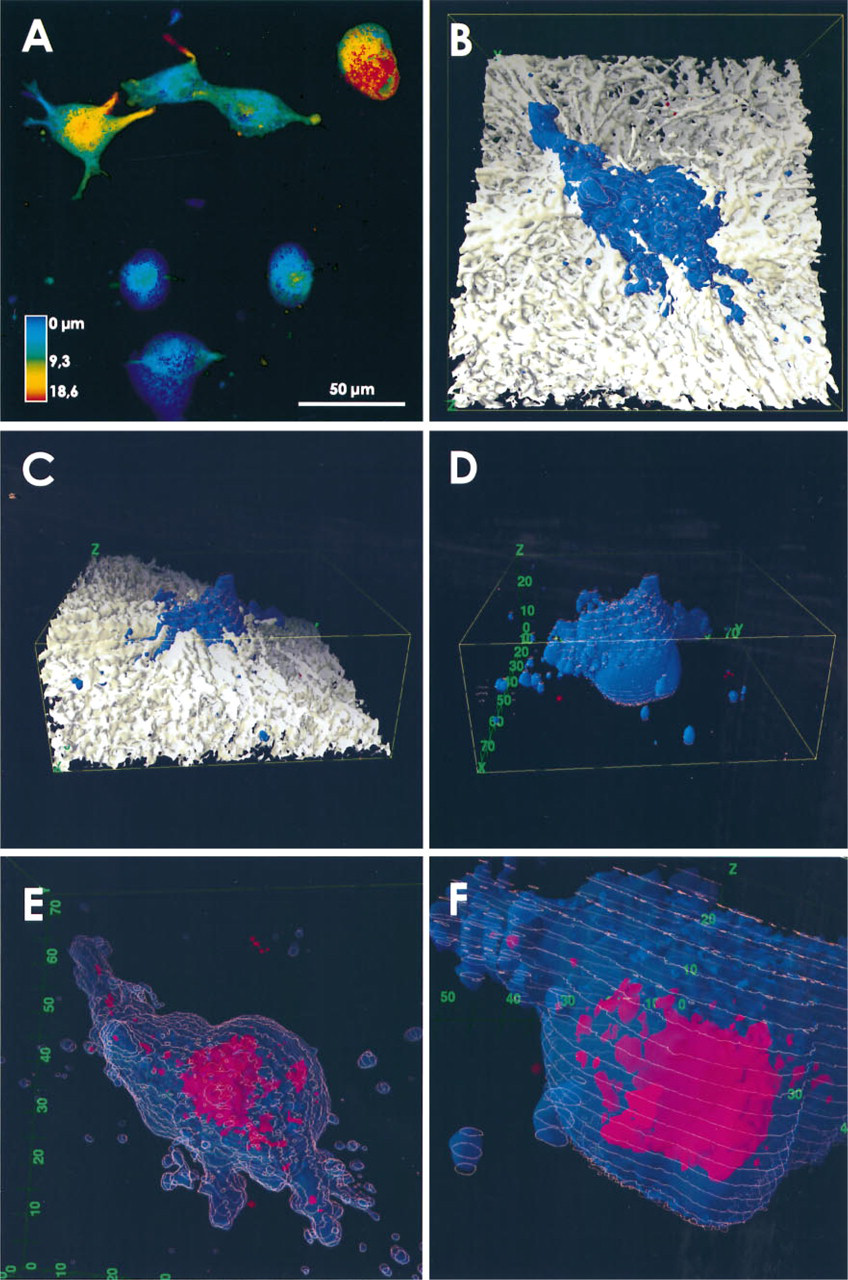
SB-3 tumor cells penetrating into a collagen matrix. Cells were stained by DiOC6(3) and immunolabeled by anti-cathepsin B antibody detected by Cy-3-labeled anti-antibodies. (
Discussion
Confocal laser scanning microscopy is now a well-established method for obtaining optical sections of cells (Brakenhoff et al. 1989; Masters and Farmer 1993). This accurate and nondestructive procedure renders a series of consecutive images with a sufficent number of equally thick sections to allow a faithful 3D reconstitution of the imaged volume.
In the present work we took an in vitro approach to study human lung cancer cells SB-3 and LCLC103H penetrating collagen in a 3D model. Such experimental methods are applied to study the invasive behavior of tumor cells (Albini et al. 1987; Thompson et al. 1991). The cells were chosen for our studies for the following reasons: (a) they represent different tumor cell types; (b) their size is in a proper range for investigation of the morphology and the distribution of intracellular compartments with the light microscope; (c) they are characterized in their abilities to penetrate extracellular matrix (Erdel et al. 1992; and own unpublished results); and (d) the cathepsin B distribution is well known in 2D images (Sylven et al. 1974; Erdel et al. 1990; Honn et al. 1994; Spiess et al. 1994). We established procedures that allow simultaneous visualization of the collagen matrix, the cell morphology, and the 3D distribution of intracellular organelles. For the last aspect, we focused on distribution of cathepsin B, a protease that is believed to participate in the proteolytic cascade facilitating invasiveness of cells, particularly tumor cells (Mignatti and Rifkin 1993). The collagen matrix was recorded in the reflection mode, and the cell morphology and the distribution of cathepsin B were visualized by staining with different fluorescent dyes. Such specific staining has been difficult to achieve and to discriminate in reconstructions because of the overlap in absorption and emission of available dyes. Furthermore, because of this overlap it was not possible to visualize the sites of cathepsin B activity.
For the 3D reconstitution work, we used the software package AVS (Porwol et al. 1996; Sheehan et al. 1996). This approach is convenient because of the high flexibility provided by the programming environment. In addition to the reconstruction of three-dimensionality, it allows simultaneous or alternative, complete or reduced, translucent or opaque representation of the different sets of the data. We found not only a better understanding of the complex spatial arrangement of cell morphology and intracellular compartments but also an increase in sensitivity. Signals that escaped perception in individual sections became obvious in the reconstructions. This is best visualized in an animated video presentation. However, limitations in resolution and reconstruction may have led to the loss of fine fibrillar elements. Therefore, the gel might be denser, as represented in our images.
The reconstructions render a complete image of the in vitro situation at a defined moment in time. Interaction of the cell with the gel matrix becomes obvious by the rearrangement of gel fibers from an originally random pattern to a cell-oriented pattern in the close vicinity of the cell, but the general organization of the gel was not changed by these activities. The cells developed pseudopodia stretching in vertical and horizontal directions into the gels and on their surfaces. Vesicles enclosed in the gel but several micrometers away from the cell body also indicate cellular activity. We assume that the gel collapsed after the retraction of pseudopodia. Loss or shedding of cellular material is a well-known phenomenon (Taylor and Black 1986; DiMilla et al. 1993); we observed it frequently for different tumor cells and fibroblastoid cells moving on 2D gels (unpublished results). Such vesicles have been shown to contain matrix metalloprotease activity (Dolo et al. 1994). The horizontally oriented pseudopodia were similar to those of cells studied in 2D systems (Albrecht–Buehler 1977; McCarthy and Furcht, 1984). The penetrating LCLC103H cells remained in the typical flat morphology characteristic of 2D systems. The SB-3 cells developed, in addition to a flat part that was spread over the gel, a bell-shaped body that contained cell organelles, including the nucleus. From these observations, it appears that individual cells can move on a broad front into the gels, not necessarily following a pseudopodium. It is not clear whether this is due to the lack of a gradient along which the cells intend to move or whether it is a natural behavior.
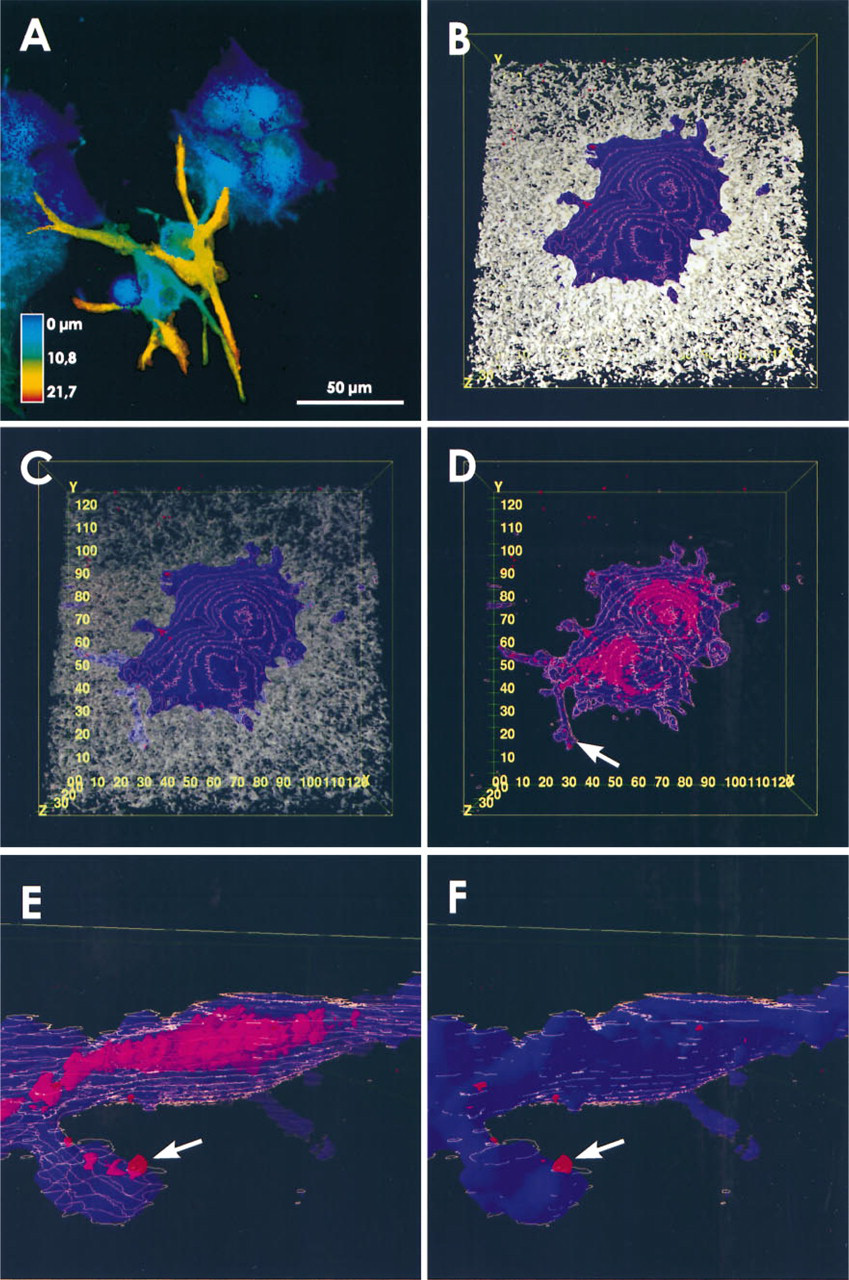
LCLC103H tumor cells penetrating into collagen gels. The staining of cells and the color representations are as described in the legend for Figure 1. (
The main goal of our investigations concerned the localization of cathepsin B. The antibody we used for identification binds to the proform and the mature form of the enzyme. Therefore, we imaged all organelles, specifically those parts of them that are involved in synthesis, processing, trafficking, and functions of cathepsin B. Endoplasmic reticulum and the Golgi complex showed a perinuclear localization with limited extension. They were so closely apposed to the nucleus that the shape of the nucleus itself was perceptible as a negative image. The 3D reconstruction delineates the morphologies of these organelles in a resolution beyond that of classical light microscopy. They appear densely packed as layers of lacunae that dissolve at the distal part of the complex in vesicular structures. The localization of cathepsin B-containing structures, presumably vesicles, in the cytoplasm and associated with the plasma membrane confirms earlier findings concerning such localization in these and other cells (Sylven et al. 1974; Sloane et al. 1987; Erdel et al. 1990; Honn et al. 1994; Rozhin et al. 1994; Spiess et al. 1994). Of particular interest is the concentration of enzyme-containing vesicles in pseudopodia, although not all pseudopodia exhibit this feature. At a site of close and intense interaction of the cell and the matrix, we observed intracellular and a clearly demonstrated epicellular cathepsin B. Only the 3D reconstitution procedure allowed such a definitive demonstration. This observation is very suggestive of the participation of cathepsin B in the penetrative activity of the cells. Localization experiments in 2D systems revealed that procathepsin B, which is believed to be inactive, is confined to the perinuclear area in these cells. Therefore, the pseudopodial fraction is likely to be mature, active cathepsin B. We are not able to judge how far and for what length of time this fraction is associated with the plasma membrane. Constitutive secretion of active cathepsin B is very limited in these cells (Trefz et al. 1990; Ulbricht et al. 1996). However, 12(S)-HETE-stimulated secretion may liberate larger amounts of active enzyme in these or other cells (Honn et al. 1994; Ulbricht et al. 1996); a matrix-induced release is not yet known.
The final conclusion of our work addresses its future prospects. The extremely sensitive instrumentation, the construction of a broad range of physically distinctive dyes, and the development of specific antibodies to cell constituents will now easily extend our comprehension of the spatial relationships of cell structure and function.
An animated video sequence of these results is available on request.
Footnotes
Acknowledgements
Supported by grant Ca58 of the German-Israeli cooperation DKFZ-NCRD and the Klinisch-Biomedizinischer Forschungsverbund of the Bundesministerium für Bildung, Wissenschaft, Forschung und Technologie, Bonn, Germany (ES, ARS). Financial support by the Deutsche Forschungsgemeinschaft, Bonn, under grant Ac 37/9–1 is gratefully acknowledged (TP, HA).
We thank Dennis Strand (Deutsches Krebsforschungszentrum, Heidelberg) for critically revising the manuscript. A-RS and ES gratefully acknowledge the introduction to and continuous support in confocal microscopy by Herbert Spring (same institution).