
Abstract
Because the neuronal membrane properties and firing characteristics are crucially affected by the depolarization-activated K+ channel (Kv) subunits, data about the Kv distribution may provide useful information regarding the functionality of the neurons situated in the cochlear nucleus (CN). Using immunohistochemistry in free-floating slices, the distribution of seven Kv subunits was described in the rat CN. Positive labeling was observed for Kv1.1, 1.2, 1.6, 3.1, 3.4, 4.2, and 4.3 subunits. Giant and octopus neurons showed particularly strong immunopositivity for Kv3.1; octopus neurons showed intense Kv1.1- and 1.2-specific reactions also. In the latter case, an age-dependent change of the expression pattern was also documented; although both young and older animals produced definite labeling for Kv1.2, the intensity of the reaction increased in older animals and was accompanied with the translocation of the Kv1.2 subunits to the cell surface membrane. The granule cell layer exhibited strong Kv4.2-specific immunopositivity, and markedly Kv4.2-positive glomerular synapses were also seen. It was found that neither giant nor pyramidal cells were uniform in terms of their Kv expression patterns. Our data provide new information about the Kv expression of the CN and also suggest potential functional heterogeneity of the giant and pyramidal cells.
T
To understand the function of the CN, it is essential to know how the various cell types contribute to its overall task. Thus far, numerous authors have provided valuable information about the morphological and functional properties of the individual CN neurons, revealing that the behavior and firing characteristics of the projection cells of the CN are markedly different. The bushy neurons (Brawer et al. 1974) of the VCN produce rapidly adapting (type II) response pattern [i.e., they fire a single action potential at the start of suprathreshold electrical stimulation (Manis and Marx 1991; Schwarz and Puil 1997; Doughty et al. 1998)]. They can, therefore, precisely recognize the onset of the acoustic stimulation, which is a function that is indispensable for the sound source localization. Moreover, the specific membrane properties of the bushy cells enable them to “recognize” the fine structure of sounds, allowing them to encode the phase of low-frequency sounds and performing amplitude modulation of high-frequency sounds. Octopus cells are found in the pVCN only (Harrison and Irving 1966; Osen 1969a), each of them receiving synaptic inputs from numerous (at least 60) auditory axons (Osen 1969b; Oertel et al. 2000). Octopus cells fire action potentials only if the activity of these synapses develops within a very narrow time interval (Golding et al. 1995); thus, they are regarded as coincidence detectors of the CN (Oertel et al. 2000).
In the DCN, the pyramidal (fusiform) neurons (Lorente de No 1981; Webster and Trune 1982) can produce variable activity patterns (termed onset, chopper, and build-up) depending on the strength of the incoming stimuli and on the membrane potential just before the stimulation (Kane 1974; Kanold and Manis 1999). These neurons receive inputs through different pathways; thus, they may play an integrative role. It has also been shown that pyramidal cells detect spectral notches that are the cues for monoaural (vertical) sound source localization (Reiss and Young 2005). As for the other projection cells of the DCN [giant and Purkinje-like cells (Kane et al. 1981; Rossi and Borsello 1993; Zhang and Oertel 1993; Hurd and Feldman 1994)], very little is known about their firing properties; thus far, no obvious function has been attributed to them.
Although the CN projection cells are able to produce markedly different firing patterns in response to the same acoustic stimuli, the exact explanation of their firing behavior is still poorly understood. Generally, the neuronal response pattern is most effectively determined by the organization and activity of the synaptic inputs and by their intrinsic membrane properties. The membrane characteristics are, on the other hand, crucially affected by the presence, distribution, and subunit composition of the various voltage-gated K+ channels, which have pivotal roles in determining the excitability, membrane time constant, and the major features of the action potential firing pattern. The depolarization-activated K+ channels fall into three major categories (for reviews, see Coetzee et al. 1999; Rudy and Mcbain 2001; Dodson and Forsythe 2004), each having different molecular composition, electrophysiological properties, and functional relevance. The molecular assembly of the low voltage–activated (LVA), dendrotoxin-sensitive channels requires the presence of K+ channel (Kv)1.1, 1.2, or 1.6 subunits; whereas the assembly of rapidly inactivating, transient K+ channels requires Kv1.4, 4.2, 4.3, or 3.4 subunits. Finally, the molecular composition of the members of the high voltage–activated (HVA), non- or very slowly inactivating, delayed-rectifier channels is rather variable, containing a number of possible subunits (e.g., Kv3.1 or 3.2).
Individual representatives of each major K+ current type have been described in the various portions of the auditory pathway, including the CN (Rusznák et al. 1997; Rothman and Manis 2003; Pál et al. 2004; Cao et al. 2007). Because the various K+ currents have different roles in determining the electrophysiological characteristics of the individual neuron types, it is important to identify the subunits contributing to the assembly of the functional K+ channels and to establish their distribution. Although numerous studies are available regarding the presence of the various Kv channel subunits in the CN at either the mRNA or protein level, several problems hinder the interpretation of the experimental data. Among others, expression of the Kv subunits showed remarkable age and species dependence, making the direct comparison of the available data complicated. An additional problem is that the identification of the cell types in functional and histochemical experiments is often difficult and may not be unambiguously achieved. Although these problems could be solved by a comprehensive study investigating the expression patterns of a large number of Kv subunits using the same species and age, preferably with the combined application of other methods helping cell identification, such a study has not been completed thus far.
The aim of this study was, therefore, to describe the expression patterns of seven Kv subunits in the adult rat CN. To ensure precise cell identification, several methods, including retrograde labeling, confocal microscopy, and double immunolabeling, were used. The data presented here indicate that the investigated cells of the CN possess several types of Kv subunits. The Kv4.2 and Kv3.1 expressions of the granule and most of the giant cells, respectively, were so prominent that they might be considered as good markers for assisting cell identification in future studies. Moreover, strongly Kv4.2-positive glomerular synapses were shown in the cochlear granule cell region. Finally, octopus and bushy cells were strongly Kv1.2 positive, and definite age-dependent changes could be noted in the distribution pattern of this subunit.
Materials and Methods
Animal Care
The experiments were conducted on young (11–17 day) and older (at least 25 days, but usually 1–3 months old) Wistar rats (both sexes) using a protocol that was authorized by the Committee of Animal Research of the University of Debrecen and was in accordance with the appropriate international and Hungarian laws. The animals were bred in the departmental animal house, and they lived in an environment with natural day-night cycles. Food and water were available ad libitum. During the experimental procedures, the animals were subjected to the smallest possible pain and discomfort.
Immunolabeling
The preparation technique used was essentially the same as described earlier (Pál et al. 2005; Pór et al. 2005). All dissection steps were carried out in ice-cold low-Na+ artificial cerebrospinal fluid (ACSF) containing (in mM) 220 sucrose, 2.5 KCl, 10 glucose, 26 NaHCO3, 1.25 NaH2PO4, 2 CaCl2, 1 MgCl2, 3 myo-inositol, 0.5 ascorbic acid, and 2 Na-pyruvate (the pH was set to 7.2; the osmolarity was 320 mOsm; all chemicals were supplied by Sigma-Aldrich, St. Louis, MO, unless indicated otherwise).
After the decapitation of the animal, the brain was quickly removed; the brain stem (containing the CN) was prepared and placed into a 4% paraformaldehyde solution for 4 hr (4C). After this, the fixed tissue was washed (three times for 10 min) in 0.1 M phosphate buffer (PB; 0.1 M Na2HPO4 × 2 H2O and 0.1 M NaH2PO4 × H2O; pH = 7.4). A vibrating microtome (Campden Instruments; Loughborough, UK or Microm International; Walldorf, Germany) was used to cut 50- to 60-μm-thick, parasagittal slices that were rinsed first in PB for 10 min and then three times in Tris-buffered saline solution (TBS; 8 mM Tris-base; 42 mM Trizma HCl; 150 mM NaCl; pH = 7.4) for 10 min at room temperature.
The immunolabelings were carried out on free-floating slices using a protocol described earlier in detail (Pocsai et al. 2007). Both single and double labeling techniques were used; in the latter cases, the Kv-specific reactions were combined with glial fibrillar acidic protein (GFAP; an astrocyte-specific marker) or synaptophysin labeling. Because synaptophysin is an established molecular marker for the presynaptic vesicle membrane, synaptic terminals making contact with the various cells could be visualized, producing a firm outline of some of the neurons (e.g., bushy cells), helping to determine their precise identification. Moreover, combined application of the Kv- and synaptophysin-specific immunolabelings could also be used to raise the possibility of potential presynaptic localization of the Kv subunits.
In all cases, blocking and permeabilization were achieved using TBS supplemented with 0.1% Triton X-100 and 10% normal horse or goat serum (depending on the type of secondary antibody applied) for 1 hr at 4C. Samples were incubated with the primary antibodies diluted in TBS containing 1% normal horse or goat serum and 0.1% Triton X-100 (either overnight at room temperature or for 48 hr at 4C). Types, dilutions, and sources of the primary antibodies are listed in Table 1.
When the incubation with the primary antibodies was terminated, the slices were rinsed in TBS (three times for 15 min) and incubated with the appropriate fluorochrome-conjugated secondary antibody (3 hr at room temperature or 24 hr at 4C; Table 1) diluted in TBS containing 1% horse or goat serum and 0.1% Triton X-100 and washed in TBS again (three times for 10 min). At the end of the procedure, the slices were mounted using a 4′,6-diamidino-2-phenylindole (DAPI)-containing mounting medium (Vector Laboratories; Burlingame, CA). DAPI was used for the specific labeling of the cell nuclei that allowed more precise morphological identification of the various structures (cell bodies or selected parts of the CN, such as the granule cell layer).
Characteristics of the primary and secondary antibodies
In cases of double labelings, the appropriate Kv-specific antibody and the other antibody (anti-GFAP or anti-synaptophysin) were applied simultaneously. Before the application of the primary antibodies, blocking and permeabilization were achieved using TBS supplemented with 10% normal bovine serum and 0.1% Triton X-100 (1 hr, 4C). The primary and secondary antibodies were diluted in TBS containing 1% bovine serum and 0.1% Triton X-100; otherwise, the major steps of the immunoreactions were the same as described above.
The data presented in this work were obtained from 36 animals (5 young and 31 older rats from both sexes); young animals were exclusively used for the study of the age dependence of the Kv1.2 subunit expression. When the same Kv-specific antibody was used, no appreciable difference was observed in the distribution pattern of the immunopositivity in the “old” group, regardless of the actual age of the animal. In all cases, both cochlear nuclei were prepared and sliced, providing 8–10 (young animals) or 10–20 (older animals) cochlear slices. In the majority of the cases, all slices were used for testing the distribution of the same subunit, but in eight instances, the slices were distributed among several (two to seven) tubes containing different Kv-specific primary antibodies. The number of animals used for the study of the individual antibodies was as follows: 7 (Kv1.1); 11 (Kv1.2; 5 young and 6 older animals); 6 (Kv1.6); 9 (Kv3.1b); 11 (Kv3.4); 9 (Kv4.2); and 11 (Kv4.3).
Retrograde Labeling
Retrograde labeling of certain projection neurons of the CN was achieved in six animals, according to a protocol described earlier (Pocsai et al. 2007). In these experiments, the aim was to label all projection neurons of the DCN that targeted the inferior colliculus. For this purpose, tetramethylrhodamine-dextran crystals (lysine fixable, molecular mass = 3000; Molecular Probes, Eugene, OR; referred to as rhodamine hereafter) were applied into incisions severing the dorsal acoustic stria or into sagittal incisions made on the ventral surface of the brain stem at the level of the trapezoid body. To avoid photobleaching of the retrograde tracer, all steps of the labeling procedure were performed in a dark room.
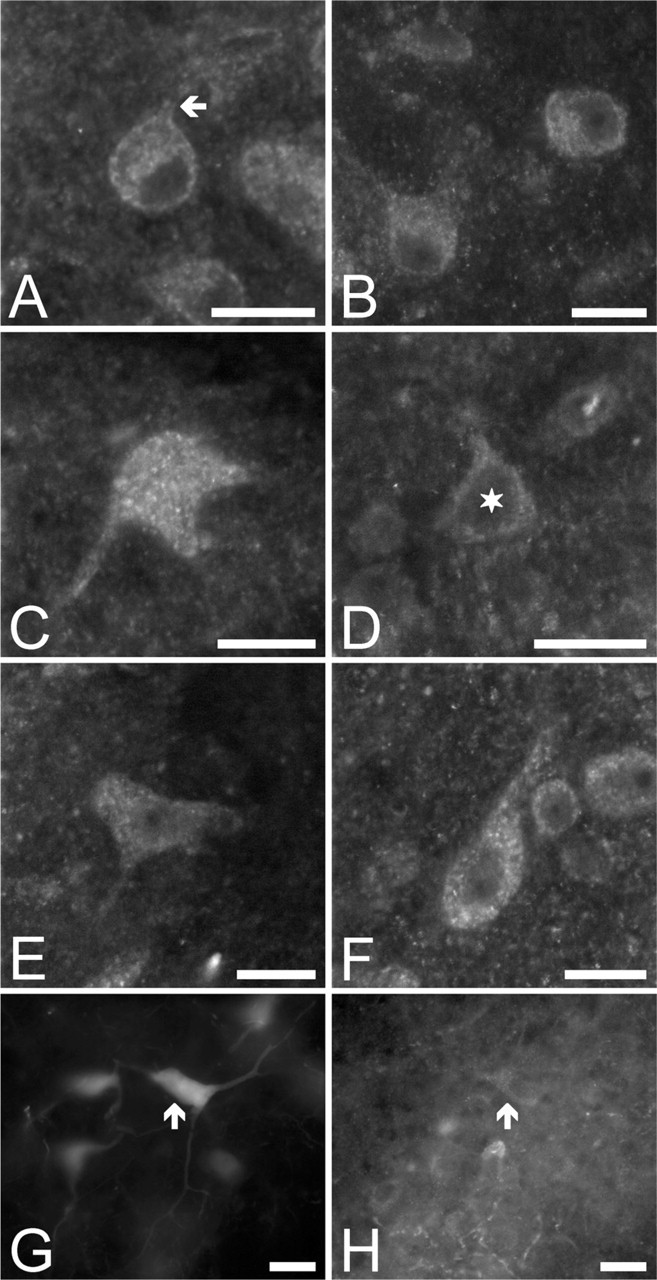
The application of the rhodamine was immediately followed by the incubation of the brain stem in normal ACSF (its composition was similar to that of the low-Na+ ACSF except that it contained 125 mM NaCl instead of sucrose), which was continuously oxygenated; the length of the incubation period was 8–12 hr. At the end of the procedure, the preparation was transferred into 4% paraformaldehyde solution and kept at 4C for 12 hr. After this, the brain stem was rinsed in PB (three times), and 50- to 60-μm-thick sagittal slices were cut, which subsequently underwent the immunolabeling procedure as described above. An example of a free-floating slice containing rhodamine-filled projection cells is shown in Figure 1. This and similar sections allowed more precise assessment of the distribution and morphology of the pyramidal and giant cells and ensured more reliable cell identification. Moreover, when rhodamine filling was used in combination with immunohistochemistry, the distributions of the Kv-specific immunopositivities presented by the rhodamine-labeled cells could be more easily determined.
Microscopy
The basic assessment and visualization of the immunoreactions and the retrograde labeling were achieved using a conventional fluorescence microscope (Eclipse 600W; Nikon, Tokyo, Japan), where the images were acquired using Spot RT v3.5 software. However, in the majority of the study, a laser scanning confocal microscope (LSM 510 microscope; Zeiss, Oberkochen, Germany) was used. In these instances, the FITC-conjugated secondary antibodies were detected using a 488-nm argon laser for the excitation; the emission was recorded using a BP 505-530 filter. For the excitation of Texas red–conjugated secondary antibodies, a 543-nm helium/neon laser was used, and the emitted light was recorded by passing the light beam through an LP 560 filter. For the visualization of the DAPI, a diode laser was used (excitation wavelength: 405 nm), whereas the emission was recorded between 420 and 490 nm using an LP420 filter. The size of the individual images varied according to the area of interest, but it was usually either 2048 × 2048 or 1024 × 1024 pixels. Low-magnification images were acquired using ×10 or ×20 objectives, whereas high-magnification images were obtained by a ×40 oil- or a ×63 water-immersion objective. Besides acquiring single optical sections, Z-stack images were also produced in a number of cases. The thickness of the individual optical sections varied between 0.8 and 2 μm. Both the image acquisition and the reconstruction of the Z-stack images were performed using the Zeiss LSM Image Browser program. In some cases, the digital images were corrected for brightness and contrast, but no other forms of image processing were carried out. The final illustrations were created using Photoshop 7.0 (Adobe Systems Incorporated; San Jose, CA).
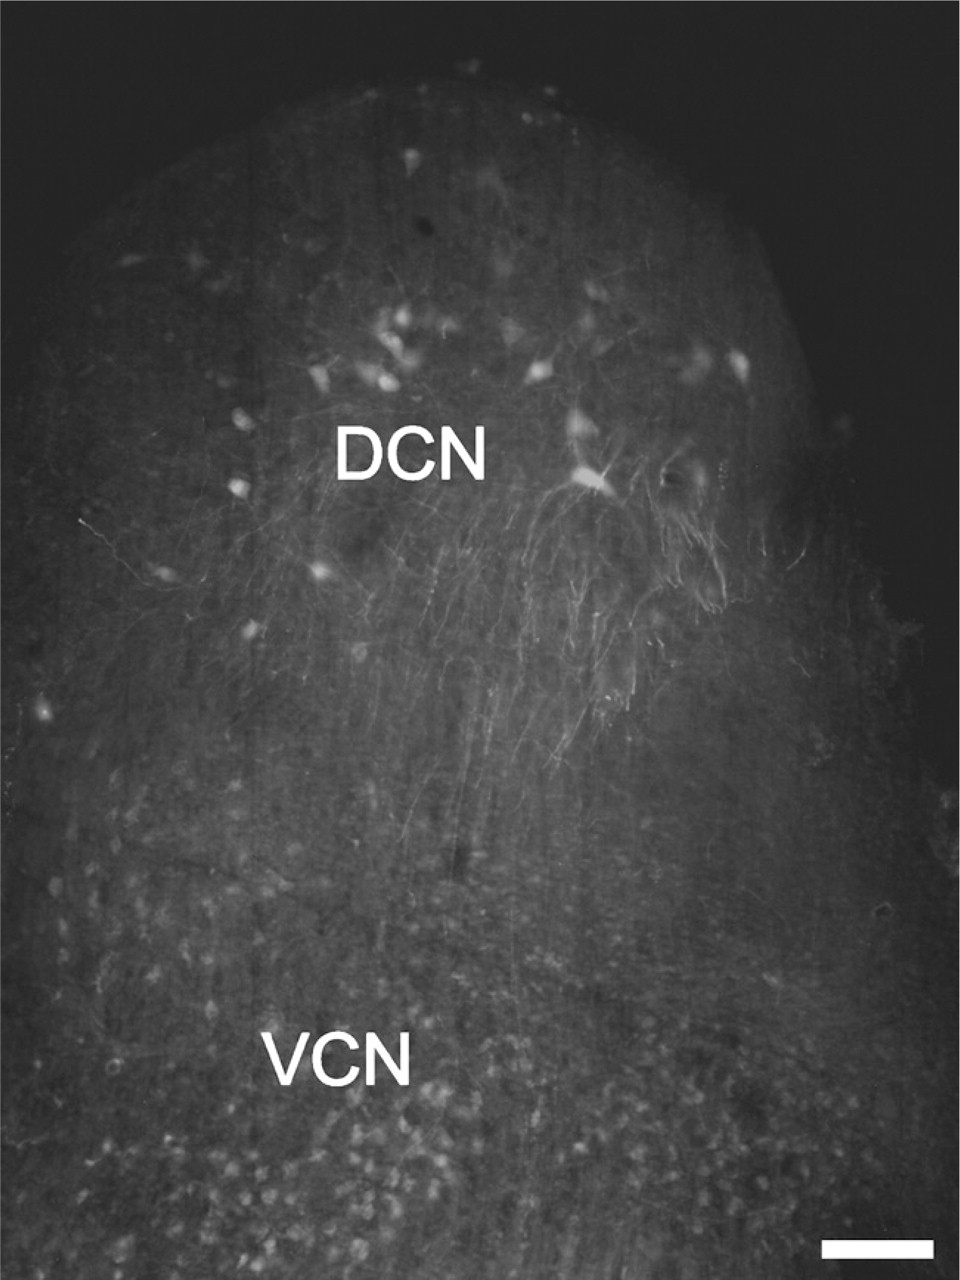
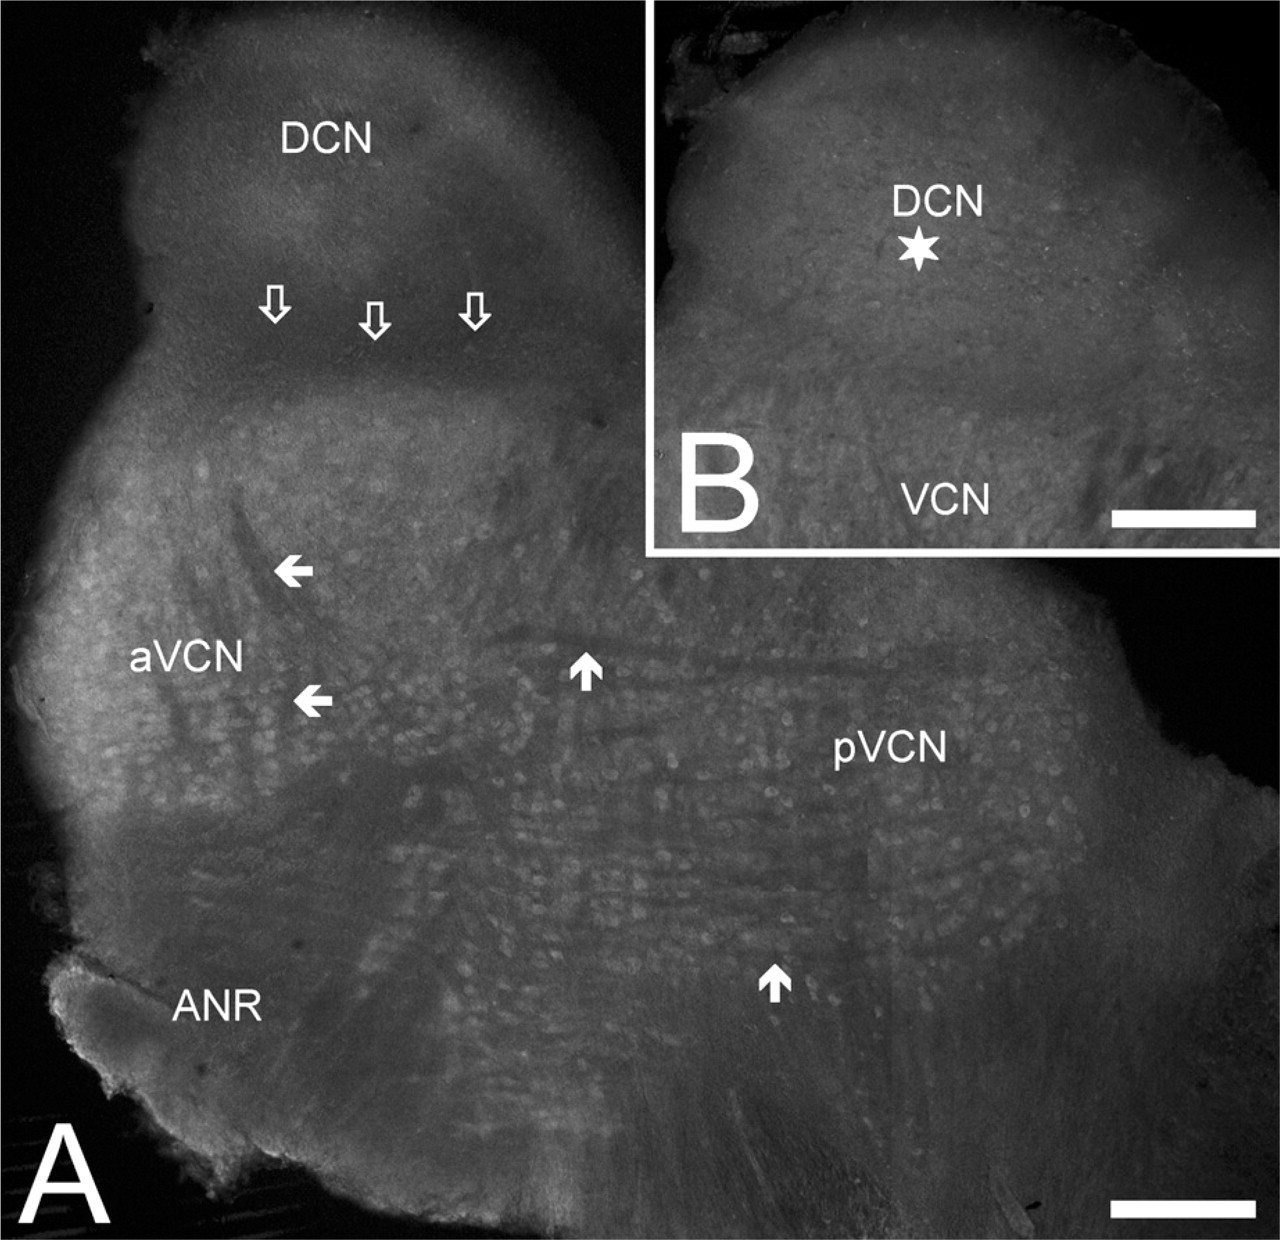
Rhodamine-labeled neurons in the cochlear nucleus (CN). To backfill the projection neurons of the dorsal cochlear nucleus (DCN), rhodamine was applied to a sagittal incision made on the ventral surface of the brain stem. The cells were visualized using conventional fluorescence microscopy. VCN, ventral cochlear nucleus. Bar = 100 μm.
Cell Identification
Because the expression of the various Kv subunits was studied in a morphologically and functionally heterogeneous group of cells, an identification protocol was used that ensured the correct and reliable determination of the neuron types. Granule cells could be easily identified, because they were the most numerous and smallest neurons of the CN. The small (5–8 μm), usually spherical cell body, the thin, often bifurcating or branching processes, and the typical localization (either the most superficial layer of the CN or a belt-like region separating the ventral and dorsal CN) made their identification straightforward. Bushy cells were sought in the VCN, near the entry point of the acoustic nerve, where they often formed columns or smaller groups. Although multipolar cells are also present in the VCN, they are known to be situated farther away from this region; thus, it was unlikely that bushy cells were mistaken for them. Additionally, synaptophysin labeling also helped the identification of the bushy cells, because their spherical or slightly elongated somata were clearly and distinctly marked by the synaptophysin-positive nerve terminals. All cells identified as bushy ones were carefully studied during the confocal analysis, and it was ensured that no multiple processes emerged from the cell body over the entire depth of the given neuron. Octopus cells were looked for in the pVCN, close to the DCN. These neurons usually formed groups, where the individual cells possessed somewhat elongated cell bodies from which numerous processes emerged, usually proceeding in the same direction. Identification of the octopus cells was also aided by the synaptophysin-specific immunolabeling, because the outlines of both the cell bodies and the processes could be well visualized.
The correct and reliable identification of the giant and pyramidal cells proved to be the most challenging. In these cases, even the synaptophysin labeling had only limited value, because the density of the synaptophysin-positive terminals was so high in the DCN that it did not circumscribe the individual cells but rather filled up the entire space between the neuronal cell bodies. In some cases, the cell bodies of the giant and pyramidal cells could be noted as synaptophysin-negative, empty areas within the dense synaptophysin-positive DCN. In fact, if the sectioning plane was suitable, the shape and size of these neuronal cell bodies could be well assessed, and occasionally, this information was enough for positive identification. However, rhodamine labeling was also used in a number of cases to enhance correct identification of the pyramidal and giant cells.
Regardless of the method applied, the distinction between giant and pyramidal cells was made after carefully considering their size, shape, localization within the nucleus, and arrangement of the visible processes. Giant neurons were usually situated in the deeper layers of the DCN or in the VCN, close to the VCN/DCN border; they had polygonal somata with multiple processes. The size of their cell bodies (>25 μm) also helped with their correct identification. Cells showing the same morphological clues were also observed after using rhodamine labeling. Pyramidal neurons, on the other hand, were less numerous and more difficult to observe; most of them had a triangular cell body, with the largest diameter being <25 μm.
Although no specific measures were applied to separate putative giant cells from commissural cells, the size of the cells identified as giant cells in this study made it unlikely that they were confused with commissural cells. It has been shown that the most common types of commissural inhibitory cells (termed COM1 and COM3) were 18–28 (average: 23 μm) and 15–20 μm (average: 18 μm), respectively. Occasionally a “giant” type of commissural cell (COM2) could also be observed, showing a diameter of 28–33 μm, but the occurrence of this cell type was very low (Alibardi 2000, 2006). It must be noted, however, that, although the techniques and precautions applied in this study made it unlikely that commissural cells were mistakenly identified as giant cells, they could not eliminate such misidentifications completely.
In all cases, it was carefully considered whether the morphological features of the cells provided enough information for their unequivocal identification. Cells whose type could not be unambiguously determined were omitted from the analysis, and no further efforts were made to correctly identify them. One possible reason for such exclusion was when the sectioning plane ran through the cell body, so that precise identification of these severed neurons could not be performed. In the case of rhodamine filling, cells were excluded from the analysis if the processes were not visible or the orientation of the cell body was such that it hindered the proper assessment of the number and origin of the appendages.
Validation of the Immunohistochemistry Data
All antibodies used in this study were commercially available products (details and specifics of the primary and secondary antibodies are summarized in Table 1). In the case of the polyclonal antibodies, all staining was abolished when the primary antibodies were preincubated with their immunizing peptides. Positive control experiments were also employed, using either cerebellar or CN sections. Because the presence and expression of some Kv subunits were already reported on certain cell types of the CN (at mRNA, protein, or functional levels), these cell types could be used as positive controls. The presented data were collected over a period of 3 years, and the immunolabeling patterns were consistent and reproducible, even if different lots of the antibodies were used. As part of the validation procedure, each antibody was tested in Western blot experiments, using whole brain preparations. In these instances, the immunopositive bands appeared at the expected molecular mass, and no signs of nonspecific binding or cross-reactivity could be observed.
Although the previously described control experiments all indicated that the antibodies recognized the correct Kv subunits, it was also carefully considered whether cross-reaction occurred between the individual antibodies and other Kv subunits. Because the labeling patterns provided by the various antibodies produced distinctly different results, it was unlikely that they recognized the same proteins. This finding was in perfect agreement with the results of Adamson et al. (2002), who showed the lack of cross-reactivity even between the antibodies specific for the most closely related Kv1 subunits (Kv1.1, 1.2, and 1.3).
As an additional way to verify the presented data, antibodies specific for some of the tested Kv subunits (Kv3.1b, 3.4, 4.2, and 4.3) were purchased from two different sources (see Table 1 for details), and the distribution of the immunopositivities was compared. These experiments always resulted in the same labeling patterns. Although the individual antibodies recognizing a given Kv subunit were targeted against the same epitopes, these experiments could not be regarded as ideal controls; together with the results of the other control experiments, they also confirmed the validity of the presented data.
Results
Distribution of the Kv4.2-specific Immunopositivity in the CN
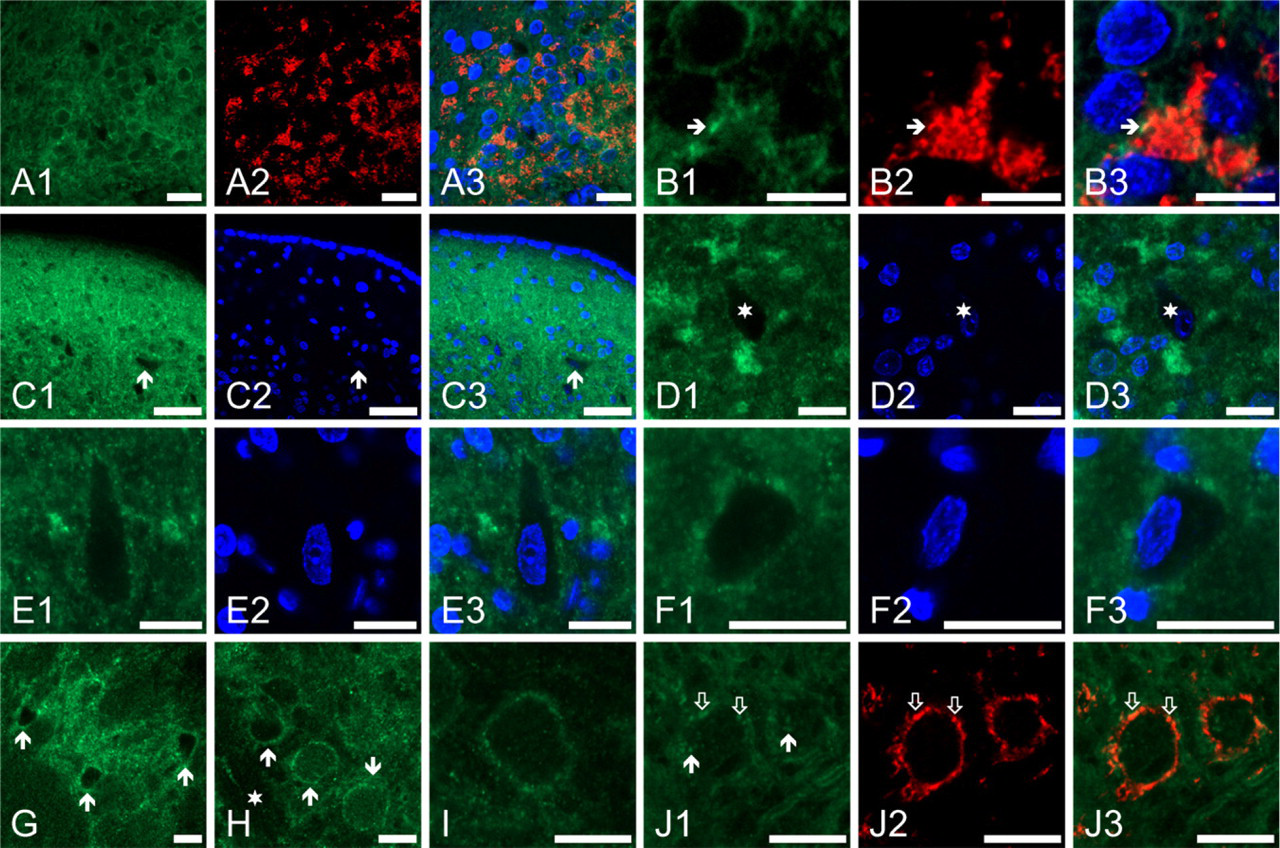
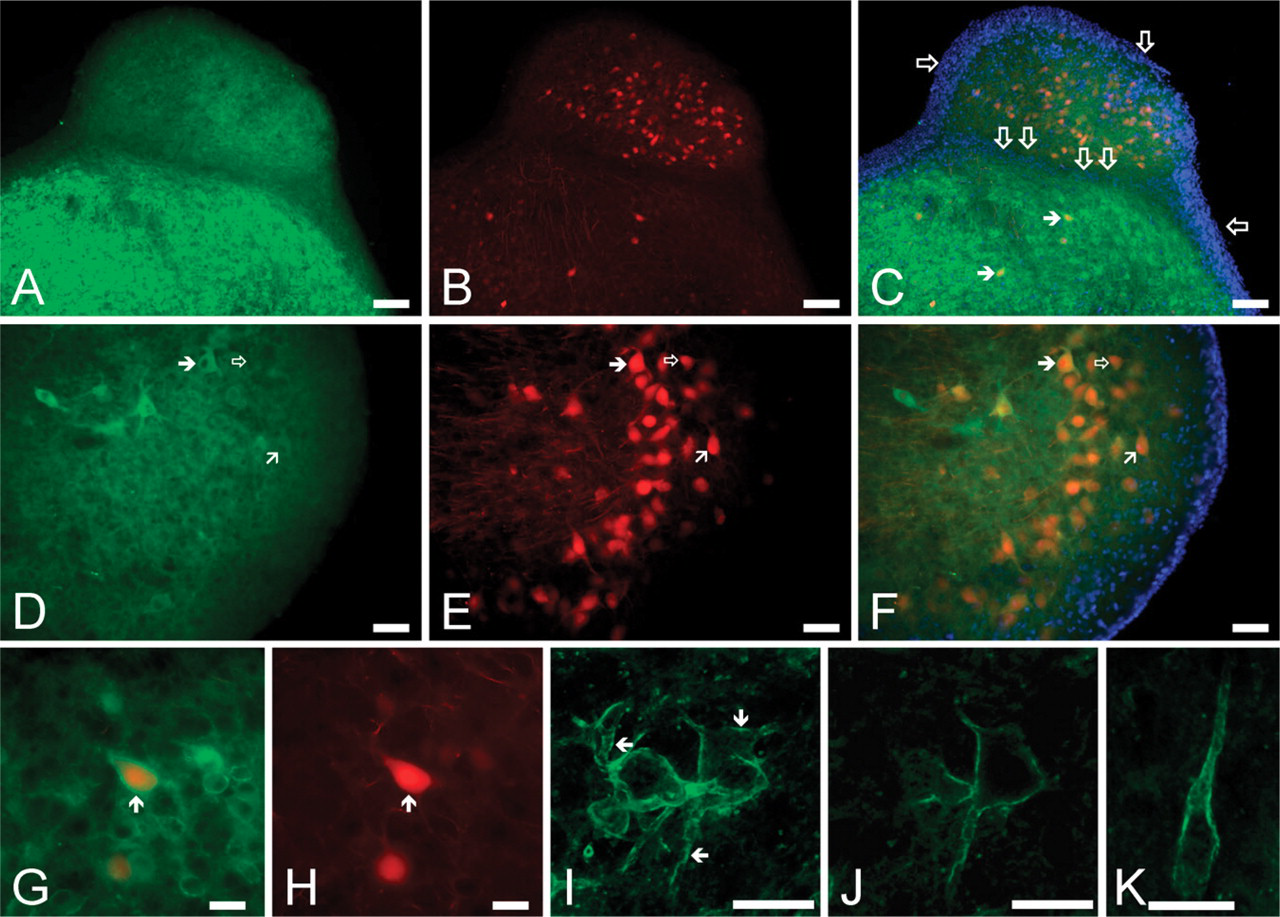
The presence and distribution of the Kv4.2-specific immunopositivity was studied using two antibodies, purchased from two different sources. As Figures 2A and 2B show, strong Kv4.2-specific immunopositivity was observed in the CN, whose distribution was the same irrespective of the primary antibody applied. Figures 2C–2F provide a more detailed view of the dorsal (Figures 2C and 2D) and ventral (Figures 2E and 2F) parts of the CN. Recognition of the various parts of the nucleus was aided by simultaneously performed synaptophysin-specific labelings (Figures 2D and 2F). Although both the DCN and VCN showed Kv4.2-specific positivity, the DCN showed stronger immunolabeling. In the DCN, the strongest reaction was present in the granule cell region (Figure 2C, filled arrows) and in some areas of the deep part of the DCN (examples are indicated by empty arrows in Figure 2C).
Prominent labeling of the aVCN could also be observed, and outlines of individual cells could be seen (such a region is marked with a star in Figures 2E and 2F). Higher-magnification images of the aVCN (Figure 2G) showed a characteristic necklace-like organization of spherical cells that corresponded to the globular bushy cells. The Kv4.2 labeling was not restricted to the cell bodies of the bushy neurons, but it was clearly present on the surface of the processes as well (Figure 2H). Because the Kv4.2 expression of this cell type has been documented earlier (Pál et al. 2005), their labeling could be regarded as a positive control for these experiments. Kv4.2 expression of the cochlear axons was insignificant [compare the neurons and either the areas between the cell rows or the entry point of the acoustic nerve root (marked area in Figures 2E and 2F)].
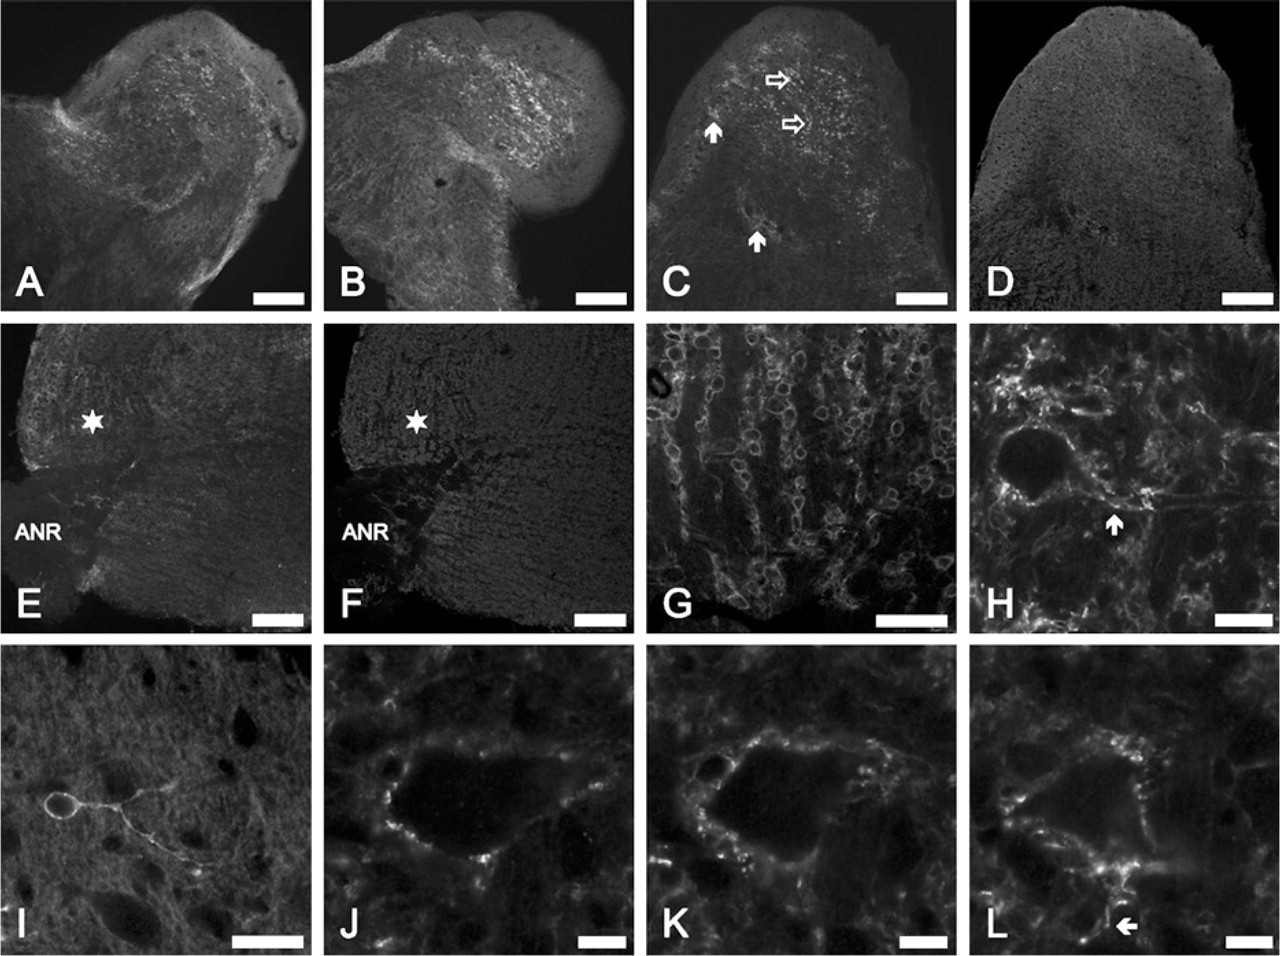
Distribution of the Kv4.2-specific immunopositivity in the CN. (
Higher-magnification images showed that small neurons situated in the deep parts of the DCN also exhibited strong Kv4.2-specific labeling (an example is shown in Figure 2I). In the presented case, the size of the cell body was 6 × 10 μm, whereas its thin, bifurcating process thickened as it ran away from the cell body and showed a clearly beaded appearance. On the basis of their morphology, this and similar cells were recognized as cochlear granule neurons (Oertel and Wu 1989). Kv4.2-positive giant cells were difficult to find, but they could be noted in some cases. Figures 2J–2L show sections (each with a thickness of 1 μm) taken from the same cell (dimensions of the cell body: 28 × 50 μm), whose contour showed strong Kv4.2-specific immunolabeling. Moreover, the section presented in Figure 2L shows a Kv4.2-positive process emerging from the cell body (arrow).
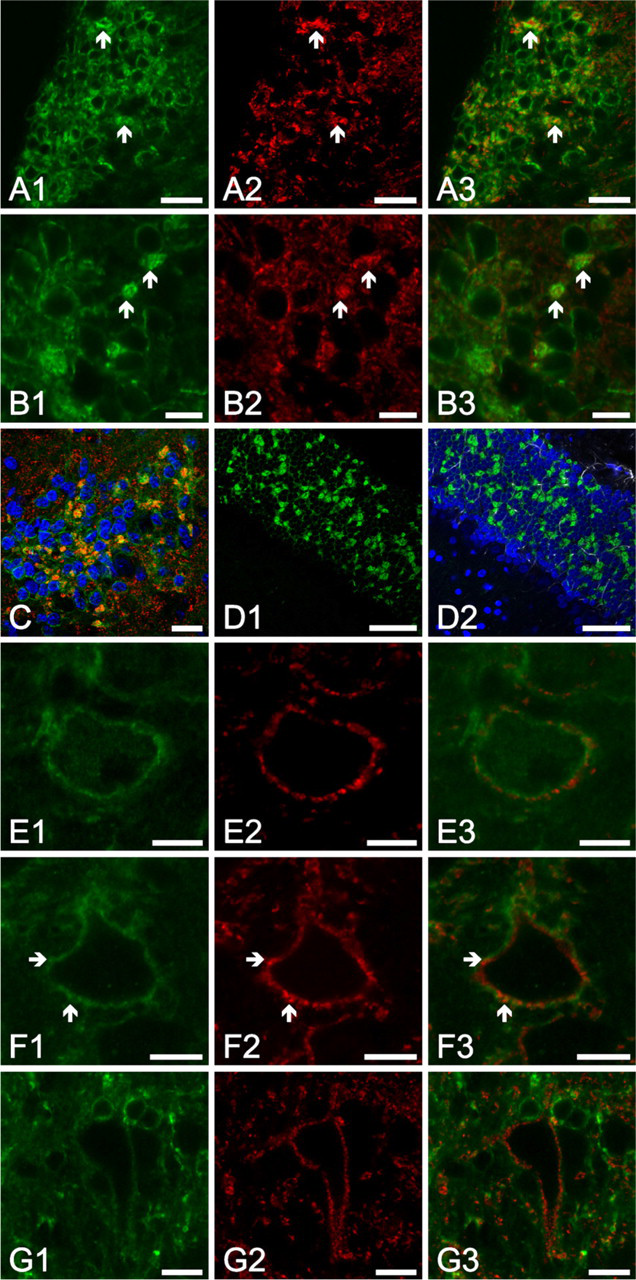
Figure 3A1 shows a high-magnification image showing the distribution of the Kv4.2 positivity in the granule cell region of the CN. The Kv4.2-specific immunoreaction was not only present in the cell surface membrane of the granule cells, but it could also be seen between the individual neurons, forming nearly spherical, strongly Kv4.2-positive structures with an average diameter of 7 × 2 (SD) μm (on the basis of 22 randomly selected structures). To establish the morphological basis of these structures, double labeling experiments were conducted, where the Kv4.2-specific reaction was complemented with the application of synaptophysin- or GFAP-specific markers. The result of the synaptophysin-specific labeling of the area presented in Figure 3A1 is shown in Figure 3A2, along with the overlay image (Figure 3A3). It is obvious that the intensely Kv4.2-positive structures in the granule cell region were also strongly positive for synaptophysin (some examples are marked with arrows). The colocalization of the Kv4.2- and synaptophysin-specific immunolabelings could even more easily assessed using higher magnifications (Figures 3B1–B3, arrows indicate regions with particularly prominent colocalization). The distribution of the Kv4.2- and synaptophysin-positive structures is further shown in Figure 2C, where the nuclei of the granule cells are also visualized using DAPI staining. It was concluded that the Kv4.2-positive structures observed in the granule cell region resembled the morphology of glomerular synapses that have been described in the cerebellum (Shibata et al. 2000; Shibasaki et al. 2004; Strassle et al. 2005) and in the CN (Alibardi 2004). At the same time, the glial expression of the Kv4.2 subunits was excluded because no colocalization of the GFAP- and Kv4.2-specific immunolabelings was observed (Figures 3D1–D2).
Figures 3E1–3F3 are high-magnification images taken from the octopus cell region. As seen, the Kv4.2-specific immunopositivity showed somewhat patchy distribution, suggesting clustering of the channel protein. Moreover, some of the Kv4.2-positive dots showed colocalization with the synaptophysin positive synaptic terminals (some of them are indicated by arrows), raising the possibility of presynaptically localized Kv4.2 channels.
As Figures 3G1–3G3 show, some of the fusiform (pyramidal) cells also showed Kv4.2-specific immunopositivity. When the Kv4.2 expression of rhodamine-labeled pyramidal cells was studied, three of the four clearly labeled and positively identified pyramidal cells presented Kv4.2-specific immunolabeling, whereas Kv4.2-specific labeling could be noted in one of five retrogradely labeled giant neurons (data not shown).
Distribution of the Kv4.3-specific Immunopositivity in the CN
Both DCN and VCN showed Kv4.3-specific immunopositivity. Figure 4A shows the distribution of the Kv4.3-specific immunolabeling in the deep part of the DCN, showing strongly positive neuronal cell bodies (arrows) within the positively labeled neuropil. The superficial regions of the DCN were also clearly positive, although the distribution of the Kv4.3-specific immunopositivity was different (Figure 4B): in this area, several strongly positive, small cells could be observed (a few examples are marked with arrows), situated in a meshwork formed by a large number of Kv4.3-positive processes. Figure 4C shows strongly Kv4.3-positive cells (arrows) and neuronal processes at higher magnification. Although the precise classification of these cells could not be performed, they might have corresponded to granule cells or other interneurons of the CN. The ependymal layer covering the surface of the DCN showed no appreciable Kv4.3 immunopositivity (this region is marked with a star in Figures 4C and 4D).
When the projection neurons of the CN were studied, the strong immunopositivity of the bushy cells was evident, which affected both the surface of the cell body (Figure 4E) and the processes (marked with arrow in Figure 4F). Figure 4G was taken from the aVCN, near the entry point of the acoustic nerve, and it shows a cluster of three Kv4.3-positive bushy cells (marked with stars). The strong immunolabeling of the cell surface membrane (including that of the processes) was evident in all three neurons. Kv4.3-positive cross-sections of several other processes could also be shown (arrows). Interestingly, intense Kv4.3-like immunopositivity was seen intracellularly as well, showing rough, granular distribution and usually concentrating near the cell nucleus. Although the intracellular Kv4.3 immunopositivity might have simply represented K+ channel subunits currently synthesized or stored, the presented distribution pattern raised the possibility of a nonspecific reaction between the primary antibody and certain intracellular proteins. However, this unexpected distribution of the Kv4.3 immunopositivity was a stable and consistently reproducible phenomenon, and all possible verification techniques suggested that it reflected the true distribution of the Kv4.3 subunits. Nevertheless, this phenomenon was not studied further.
Distribution of the Kv4.2-specific immunopositivity in the CN. (
Distribution of the Kv4.3-specific immunopositivity in the CN. (
Strong Kv4.3-specific immunopositivity could also be noted in the case of the octopus (data not shown) and giant neurons (Figure 4H, arrows indicate two processes with strong immunopositivity on the surface). When the Kv4.3-specific immunoreaction was combined with rhodamine labeling, all unambiguously identified giant cells (n=8) showed positivity. Convincing identification of one pyramidal cell could also be achieved, which was Kv4.3 positive as well.
Although the Kv4.2- and Kv4.3-specific immunolabelings indicated the expression and presence of these subunits, it could not differentiate between homotetrameric or Kv4.2/Kv4.3-heterotetrameric channel formations. Because Kv subunits belonging to the same major family can combine with each other (i.e., subunits belonging to the Kv3 or Kv1 family), this remark stands for the rest of the results also.
Distribution of the Kv3.4-specific Immunopositivity in the CN
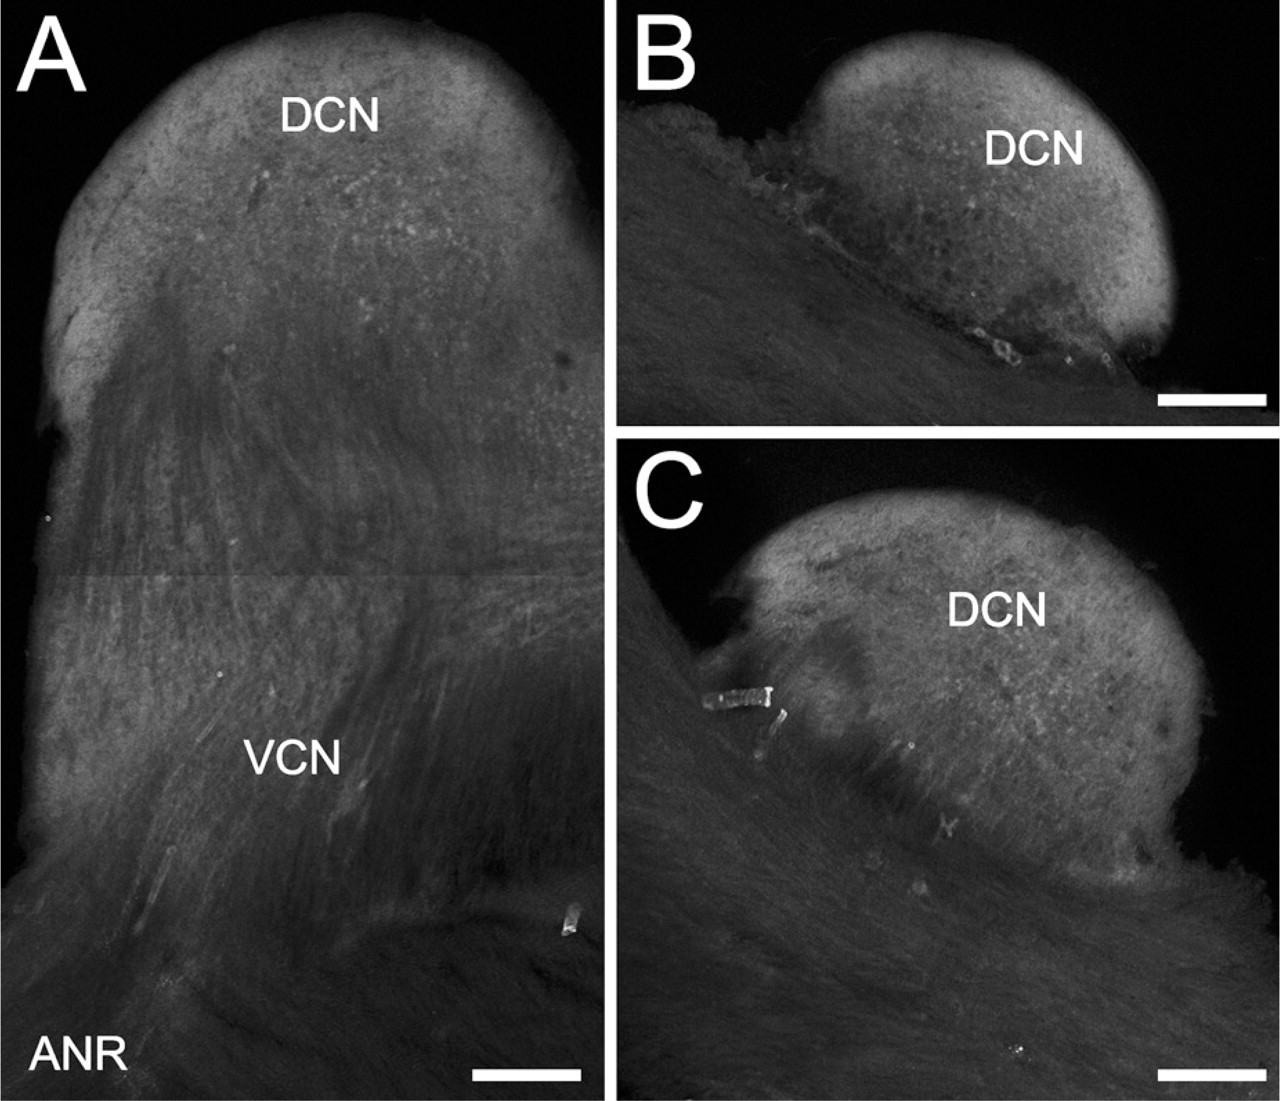
Besides the Kv4.2 and Kv4.3 subunits, Kv3.4 subunits may also contribute to the assembly of K+ channels producing transient current. As shown in Figure 5, Kv3.4 subunits were expressed in the CN. The low-magnification image presented in Figure 5A shows the distribution of the Kv3.4-specific immunopositivity in the entire CN. As seen, both the VCN and DCN showed labelings, but the entry point of the acoustic nerve, the intranuclear fascicles of the cochlear nerve, and the most superficial layer of the DCN were spared. In the deep part of the DCN, positively labeled neuronal cell bodies could be observed. Figures 5B and 5C are further sagittal sections of the CN shown in Figure 5A, but they were cut in more medial parts of the nucleus; thus, only the DCN situated on top of the rest of the brain stem is visible. In these and similar sections, the strongly Kv3.4-positive DCN was in sharp contrast with the faintly labeled brain stem, suggesting that Kv3.4 subunits are more strongly expressed in the CN than in the nearby regions.
Figure 6 provides an overview of the distribution of the Kv3.4-specific immunopositivity of the CN at higher magnification. Figures 6A1–6A3 show the Kv3.4- and the synaptophysin-specific immunopositivities of the granule cell region of the DCN. Both the surface membrane of the granule cells and the glomerular synapses showed Kv3.4 positivity, although the intensity of the labeling was less pronounced than that of the Kv4.2 immunoreaction. Nevertheless, colocalization of the Kv3.4- and synaptophysin-specific labelings could also be observed (Figures 6B1–6B3; arrow), suggesting that this channel subunit is also involved in the shaping of the electrical properties of the glomerular synapses.
Low-magnification view of the distribution of the Kv3.4-specific immunopositivity in the CN. (
High-magnification view of the distribution of the Kv3.4-specific immunopositivity in the CN. (
Strong Kv3.4 immunopositivity could be observed in the more superficial layer of the DCN, with particularly intense labeling of the neuropil (Figures 6C1–6C3), whereas the cell bodies of the individual cells appeared as Kv3.4-negative regions (an example is marked with an arrow). The labeling intensity of the neuropil was less pronounced in the deeper regions of the DCN; thus, the Kv3.4-specific immunopositivity of the individual cells could be more easily judged. Figures 6D1–6D3 show the Kv3.4-positive cell body (marked with a star) of a pyramidal neuron (the dimensions of the cell body were 14 × 27 μm), whereas Figures 6E1–6E3 show the large (14 × 50 μm), elongated, Kv3.4-positive, polygonal cell body of a giant cell. It is worth noting that, regardless of the cell type studied, the Kv3.4-specific labeling of the cell membrane had punctate distribution. When the Kv3.4-specific immunoreaction was combined with retrograde labeling, one unambiguously identified, Kv3.4-positive pyramidal cell could be noted, whereas the outlines of rhodamine-filled giant cells did not show appreciably stronger immunopositivity than that of the neuropil (n=3).
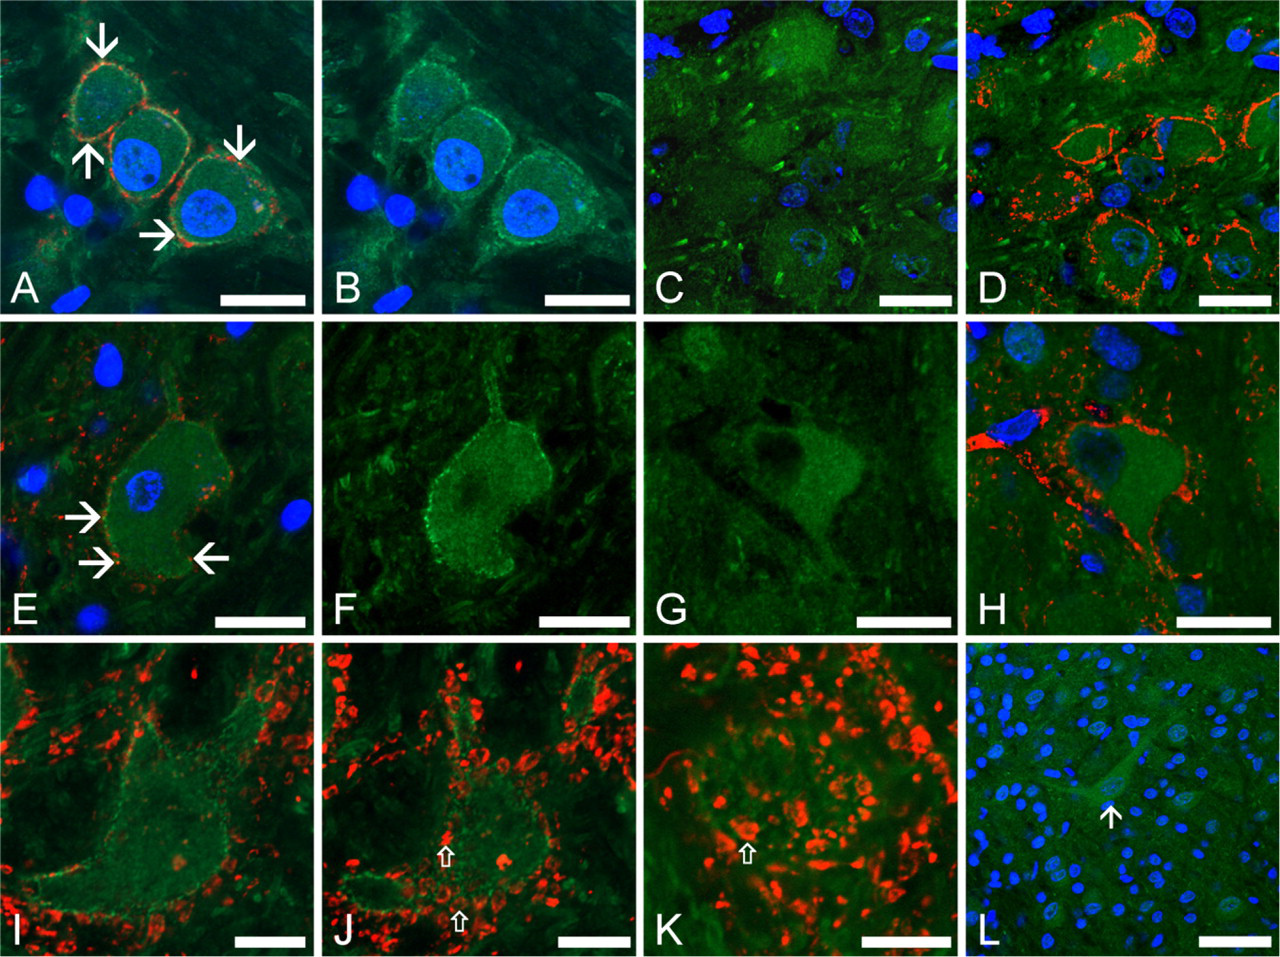
In the VCN, octopus cells showed intense Kv3.4 immunopositivity. Figures 6F1–6F3 show an octopus cell (note the characteristic, highly eccentric nucleus of the cell), whereas Figure 6G shows a cluster of octopus cells, where the contours of the cell bodies are strongly positive (arrows). The cells here appear to be embedded in a strongly Kv3.4-positive meshwork that might have corresponded to the processes of the presented and other octopus neurons. Figure 6H shows several strongly Kv3.4-positive bushy cell bodies (filled arrows), along with the lack of the immunopositivity in the nearby acoustic nerve fibers (star). The high-magnification image shown in Figure 6I illustrates the punctate distribution of the Kv3.4-specific immunopositivity on the surface of the soma of a bushy neuron. The punctate nature of the Kv3.4 labeling is present in Figures 6J1–6J3 also, showing two bushy cells. Because an optical plane near the surface of the cells was selected, some of the immunopositive dots are present on the surface of the cells (examples are marked with filled arrows). Some of the Kv3.4-positive areas on the cell surface showed colocalization with the synaptophysin-specific labeling (empty arrows), suggesting that Kv3.4 subunits may be present presynaptically as well.
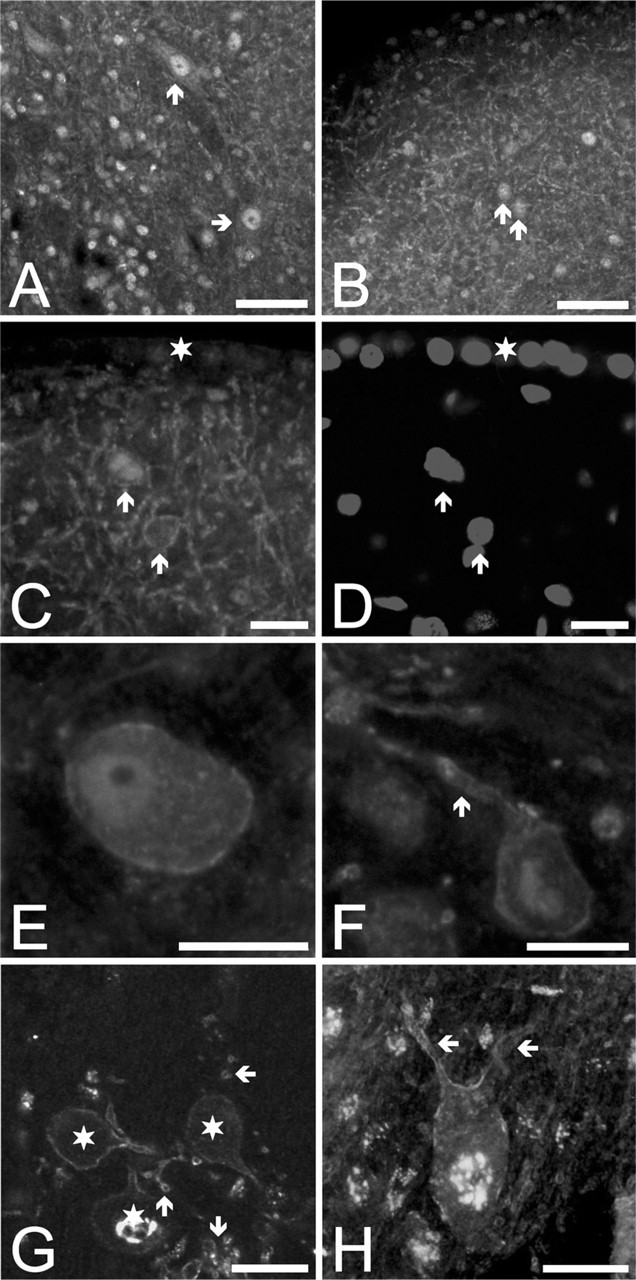
Distribution of the Kv1.2-specific Immunopositivity in the CN
It has been described earlier that some cells of the CN possess an LVA K+ current corresponding to a dendrotoxin-sensitive component (Golding et al. 1995, 1999; Rothman and Manis 2003; Cao et al. 2007), whose genesis is known to be associated with ionic channels containing Kv1.1, 1.2, and 1.6 subunits. The study of the distribution of the Kv1.2 subunits was particularly interesting, because a controversy was present in the literature concerning the ontogenetic alterations of the expression pattern of this subunit in the CN (Caminos et al. 2005; Bortone et al. 2006). In these experiments, specific emphasis was laid on contrasting the Kv1.2-specific labeling patterns of young and older animals.
Figure 7 gives an overview of the data describing the presence and distribution of the Kv1.2-specific immunopositivity in both old and young rats. Generally, animals belonging to both age groups presented clear Kv1.2-specific immunopositivity, but marked differences could be noted in the expression patterns. As seen in Figures 7A and 7B, bushy cells of the old animals presented strong immunopositivity, which was particularly intense on the cell surface, providing a sharp outline of the cell body. The synaptophysin- and Kv1.2- specific double labelings (Figure 7A) indicated that, although presynaptic localization of the Kv1.2 labeling might be possible (arrows indicate colocalization of the Kv1.2- and synaptophysin-specific immunopositivities); the majority of the Kv1.2 immunopositive patches showed no simultaneous synaptophysin positivity.
The bushy cells of young rats proved to be Kv1.2 positive as well (Figures 7C and 7D), but the intensity of the immunoreaction was less prominent. Moreover, in these cases, the immunolabeling appeared to be primarily intracellular, and the previously demonstrated marked cell surface labeling was entirely missing. This observation suggested that, although the Kv1.2 proteins were expressed in the bushy cells of young animals also, they were not yet available in the cell surface membrane.
Exactly the same conclusions could be reached when the octopus cells were studied (Figures 7E–7H). These neurons presented such a strong Kv1.2-specific immunopositivity that their groups could be easily identified in the pVCN. In old animals, the cell surface showed particularly intense, patchy immunolabeling, and some of these immunopositive patches showed clear colocalization with the synaptophysin-positive areas (Figure 7E, arrows). In younger rats, the Kv1.2-specific labeling was also present, but it did not produce such a sharp outline of the cell as in the older animals (Figures 7G and 7H). Figures 7I–7K show the distinctly patchy distribution of the Kv1.2-specific immunopositivity presented by the octopus neurons showing a different cell at higher magnification. Figure 7I shows the morphological features of a typical octopus cell, whose outline is clearly marked. The presence and distribution of the synaptic terminals making contact with the octopus cell are also seen, some of them showing colocalization with the Kv1.2-positive patches. Similar observations could be made using the image shown in Figure 7J that was taken 3 μm above the one shown in Figure 7I. In this view, a more superficial plane of the cell is presented that allows the visualization of several synaptic boutons covering the soma of the octopus cell and its processes. When studying the relation between the Kv1.2-specific immunopositivity and the synaptophysin-positive boutons, higher-magnification views were also applied, and an example is shown in Figure 7K. It is clear that the Kv1.2-positive patches were often situated in close proximity of or around the synaptic terminals (a few examples are indicated by empty arrows in Figures 7J and 7K).
It was also established that the granule cell layer and the cochlear glomeruli did not present noteworthy Kv1.2 positivity. The majority of the reliably identified pyramidal neurons of the DCN were found to be Kv1.2 positive (six of seven rhodamine-filled pyramidal cells), and Kv1.2 positivity could also be established in several giant cells (24 of 34 cells). Figure 7L shows a typical giant cell seen in the DCN of a young animal. It is worth noting that, in young animals, the Kv1.2 immunopositivity affected mostly the cell bodies and the proximal processes, and the immunopositivity of these structures was more pronounced than that of the surrounding region of the DCN. Consequently, the cell bodies of the individual cells could be easily noted. In the adult animals, however, the Kv1.2-specific labeling of the neuropil of the DCN was so pronounced that the individual cells could not be distinguished, unless retrograde rhodamine filling was used before the Kv1.2-specific immunolabeling.
Kv1.2 expression pattern of the CN. (
Distributions of the Kv1.6- and Kv1.1-specific Immunopositivities in the CN
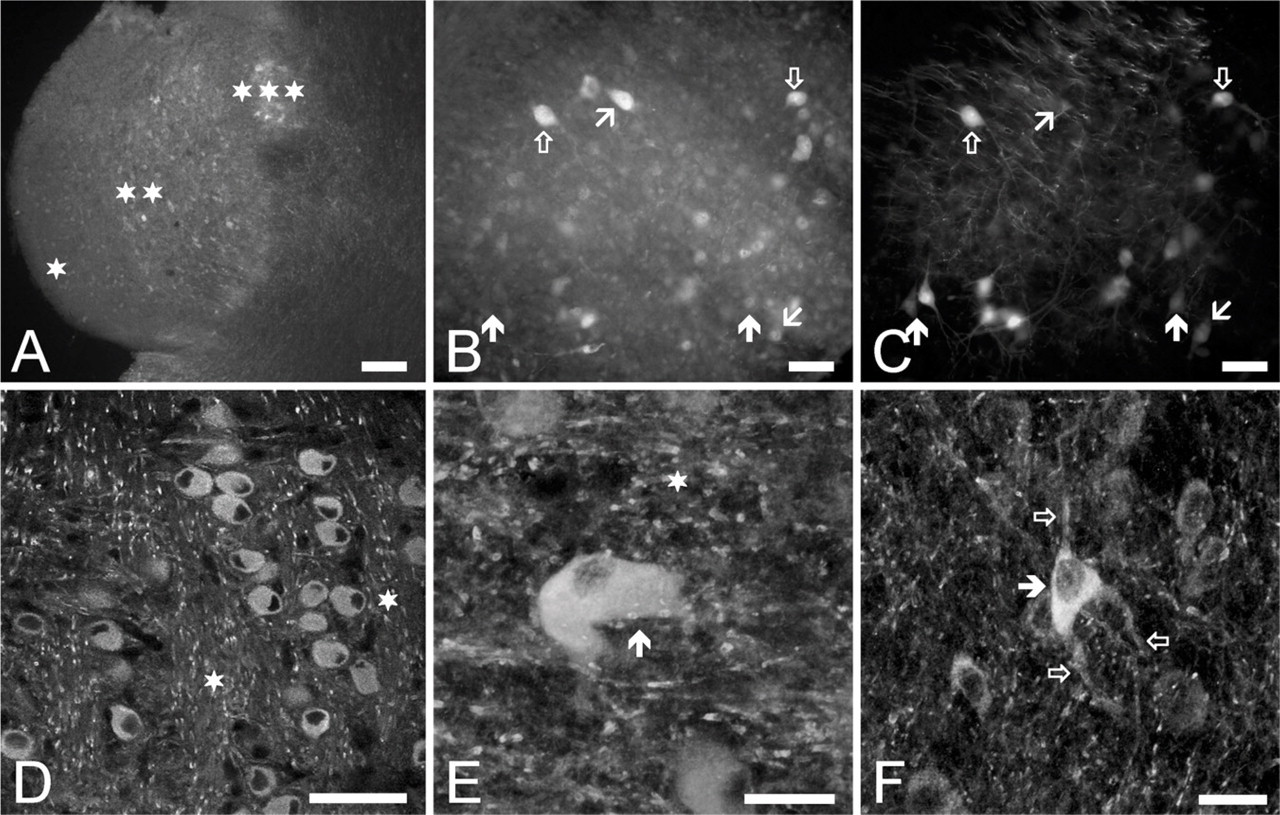
Figure 8 presents the distribution of the Kv1.6-specific immunoreaction at low magnification. Figure 8A shows a sagittal section of an entire CN, where both the DCN and the VCN are visible. As seen, the Kv1.6-specific immunopositivity was more pronounced in the ventral part of the CN than in the DCN. It must also be noted that, although the cell bodies situated in the VCN were clearly positive, the acoustic nerve fibers (a few examples are indicated by filled arrows) showed no or negligible immunopositivity. In the DCN, the central part of the nucleus showed prominent labeling, whereas neither the most superficial parts nor the layer separating the VCN and the DCN was strongly positive for Kv1.6 (empty arrows). Figure 8B shows a different, more medially located section from the same CN, where individual Kv1.6-positive cells could be observed in the core region of the DCN (star).
Figure 9 provides an overview of the Kv1.6 expression pattern at higher magnification. Bushy cells were Kv1.6 positive (Figure 9A) that affected both their cell bodies and the initial segments of their processes (arrow). Octopus cells were also strongly positive. Figure 9B shows a cluster of three octopus neurons in the pVCN, whereas Figure 9C shows a single cell at higher magnification. The section was selected in such a way that the surface of the cell is depicted. The characteristic, elongated cell body (largest diameter: 25 μm) and the processes that initiate from the same side of the soma are all characteristic features of the octopus cells. As seen, the Kv1.6-specific immunopositivity showed punctate distribution on the cell body, and these subunits appeared to be expressed in the initial segments of the processes as well. Figure 9D shows a Kv1.6-positive pyramidal cell (note the triangular cell body whose dimensions were 15 × 18 μm, marked with a star), whereas Figures 9E and 9F show two giant cells. Although the cell shown in Figure 9E had a polygonal, whereas the one shown in Figure 9F had an elongated, more fusiform cell body, their dimensions (16 × 39 and 16 × 34 μm, respectively) and localization (both situated in the deepest parts of the DCN) ensured their proper identification.
Low-magnification view of the distribution of the Kv1.6-specific immunopositivity in the CN. (
Another typical example of the giant cells is shown in Figures 9G and 9H, where a rhodamine-filled giant cell showed weak but definitely present Kv1.6 immunopositivity (arrow). Considering all experiments, Kv1.6 expression was noted in eight positively identified giant cells, whereas four rhodamine-filled giant neurons did not show appreciable Kv1.6 positivity. As for the pyramidal neurons, six cells appeared to be Kv1.6 positive and two cells showed no Kv1.6 expression.
Figure 10 gives excerpts of the results of the experiments aimed at the detection of Kv1.1 distribution in the CN. As seen in Figure 10A, strong Kv1.1 positivity could be noticed in several areas, including the second (fusiform) layer of the DCN, where the pyramidal cells are situated (single star), the deep layers of the DCN, hosting mainly giant cells (double stars), and the octopus cell region of the VCN (triple stars). As seen, octopus neurons presented the most powerful Kv1.1 positivity. The Kv1.1 immunopositivity of the granule cells was insignificant.
High-magnification view of the distribution of the Kv1.6-specific immunopositivity in the CN. (
Distribution of the Kv1.1-specific immunopositivity in the CN. (
Figures 10B and 10C present the result of Kv1.1-specific immunolabeling of rhodamine-filled projection cells of the DCN, as seen at higher magnification, showing the heterogeneity of the DCN neurons in terms of their Kv1.1 expression. Although Kv1.1-positive pyramidal and giant cells were clearly visible, only partial overlap could be observed between the Kv1.1-specific immunopositivity and the rhodamine labeling. The presence of the Kv1.1-positive cells that showed no rhodamine labeling (oblique arrow pointing up) could be interpreted as immunostaining of projection cells whose axons were not severed during the rhodamine application. Besides these neurons, clearly rhodamine-filled, but only weakly Kv1.1-positive or Kv1.1-negative cells (such pyramidal cells are indicated by filled arrows pointing up), could also be observed, whereas other pyramidal cells showed moderate (oblique arrow pointing down) or even strong Kv1.1 immunopositivity (cell marked with empty arrow pointing down). Similar to the previously introduced data, this heterogeneity could not be readily explained, unless it was assumed that neither the pyramidal nor the giant cells formed homogeneous populations. This suggestion is further substantiated by the results of all similar experiments, where 29 giant and 9 pyramidal cells could be labeled by applying rhodamine. Of these cells, only 18 giant (an example is shown in Figures 10B and 10C, marked with empty arrow pointing up) and 6 pyramidal neurons showed Kv1.1 positivity.
Figures 10D–10F show confocal images taken from the CN and show the Kv1.1-specific distribution pattern of bushy (Figure 10D), octopus (Figure 10E, arrow), and pyramidal cells (Figure 10F, filled arrow). Besides the positivity of the presented cells, intense, patchy labeling of the acoustic nerve fibers (see the areas marked with stars) and neuronal processes of the individual cells were also prominent findings (e.g., empty arrows in Figure 10F).
Distribution of the Kv3.1-specific immunopositivity in the CN. (
Distribution of the Kv3.1-specific Immunopositivity in the CN
The low-magnification image shown in Figure 11A shows the distribution of the Kv3.1b-specific immunopositivity of the CN. Although both the DCN and the VCN showed definite labeling, the intensity of the immunoreaction was appreciably stronger in the VCN than in the DCN. The result of the rhodamine labeling of the same preparation is shown in Figure 11B, where the backfilled projection cells are clearly visible. The backfilled neurons situated in the DCN were recognized as pyramidal and giant neurons; distinctions between the individual cells could be made on the basis of their localization, size, and shape at higher magnification (see Figure 11G). Applying the same criteria, the rhodamine-labeled cells in the VCN were also identified as giant cells. Figure 11C is the overlay image of Figures 11A and 11B; in this panel, the result of DAPI labeling is also presented. The densely packed nuclei of the granule cells made the identification of the granule cell regions easy; single empty arrows indicate the granule cell layer covering the surface of the CN; double empty arrows, on the other hand, indicate the granule cell layer separating the ventral and dorsal parts of the CN. As presented in Figure 11C, the Kv3.1b positivity of the cell surface of the individual neurons could be easily observed in the VCN, some of them showing simultaneous rhodamine labeling as well (filled arrows). The projection neurons of the DCN were also positive for Kv3.1b, although their labeling intensity was less pronounced than that of the cells found in the VCN. It could also be established that the Kv3.1 positivity of the granule cells was low compared with the projection cells of either the DCN or the VCN.
Figures 11D–11F show higher-magnification images of the DCN obtained from a different preparation, where several rhodamine-filled giant and pyramidal cells were present. Considering all similar experiments, most rhodamine-filled giant cells (27 of 33) appeared to be Kv3.1 positive (an example is indicated by a filled arrow pointing to the right in Figures 11D–11F). Pyramidal cells behaved in a similar fashion; of the 15 positively identified pyramidal cells, 3 appeared to possess negligible Kv3.1-specific immunopositivity (such a cell is marked with an empty arrow in Figures 11D–11F), whereas 12 pyramidal cells were Kv3.1 positive (one example is marked with oblique arrow). The Kv3.1 immunopositivity of the giant cells was generally stronger than that of the pyramidal neurons. Another typical rhodamine-filled and strongly Kv3.1b-positive giant cell is shown in Figures 11G and 11H (arrow; the presented panels are high-magnification images of one of the cells presented in Figure 11C). It is worth noting that, in the proximity of the giant cell, several smaller (14–17 μm in diameter), spherical cells were also present, showing strong Kv3.1-specific reaction. Because these cells were not labeled with rhodamine, they most likely corresponded to cochlear interneurons, whose further classification was not attempted.
In the VCN, both bushy and octopus neurons showed intense Kv3.1b-specific reaction. Figure 11I is a vertical composite image showing a group of octopus cells (one of the sections used for the production of the composite image is presented in Figure 11J). The surface membrane of the octopus cells showed prominent immunolabeling, which affected both the cell bodies and the processes. It was also a prominent feature that the Kv3.1-specific immunopositivity was not homogeneous but it showed clear clustering (see the areas marked with arrows for good examples). The intense Kv3.1-specific immunolabeling and the clustering of the immunopositivity were clearly present in the neuronal processes of the octopus cells also (Figure 11K).
Discussion
The most important aim of this study was to provide a comprehensive description of the Kv subunit expression of positively identified neurons of the CN. Although the presence and distribution pattern of certain Kv channel proteins have been established before, this is the first study using experimental animals of the same species and age to describe the precise, cell-specific distribution of seven different Kv subunits. Besides detecting the presence or absence of certain subunits, thus allowing the prediction of the membrane properties of the individual cell types, it was shown that some Kv subunits are preferentially expressed by certain CN neurons, and they may serve as cell-specific markers in the identification of these cells. Octopus cells, for example, exhibited particularly strong Kv1.1 and Kv1.2 expressions, most of the giant cells were strongly Kv3.1 positive, whereas Kv4.2 expression was the most significant in the granule cells. Moreover, this study shows Kv4.2 positivity in the glomerular synapses of the CN, resembling the same structures in the cerebellum and further supporting the view about the common origin and close morphological similarity between the CN and the cerebellum. Last, but not least, on the basis of the heterogeneity concerning their Kv expression patterns, it is suggested that neither the pyramidal nor the giant neurons form homogenous cell populations; thus, it cannot be ruled out that functional/morphological subgroups exist within these cell classes.
Kv Subunit Expression Pattern of the CN Neurons
The firing properties of the major types of CN neurons show remarkable differences, possibly as the consequence of the diversity of their voltage-gated K+ currents. Interestingly, however, as this study shows, most of the CN neurons seem to express all major types of the voltage-gated K+ currents, including the transient, the delayed rectifier, and the LVA components.
The expression of certain Kv subunits of the CN neurons has been studied before; Tables 2–4 are intended to present a synopsis of the most important results of some earlier studies. These tables also accommodate the data of this study, providing a convenient way to compare them with the already published results accomplished on positively identified CN neurons. In some of the earlier studies, however, the precise classification of the individual cell types was not attempted, making the interpretation of the data less straightforward; in these instances, the results were indicated as being relevant to the VCN or DCN in general. As for the intensity of the labelings, the “this study” term reflects subjective decisions, when the intensity of the immunopositivity shown by the individual cell types was compared with the background labeling of the sections and/or to the immunopositivity of other cells within the nucleus. Although this method does not allow the assessment of the absolute intensity of the immunoreactions, it was appropriate for the recognition of strong immunopositivity presented by the individual types of neurons and for the comparison of the immunopositivities of the different classes of cells. It must also be noted that different laboratories have often studied the presence of the various Kv subunits at different levels [mRNA (Sequier et al. 1990; Fitzakerley et al. 2000; Grigg et al. 2000); protein (Wang et al. 1994; Rosenberger et al. 2003; Caminos et al. 2005); or functional measurements using subunit-specific channel blockers (Bal and Oertel 2001; Dodson et al. 2003; Pál et al. 2004)], which is also indicated in Tables 2–4.
Expression of Kv subunits in the cochlear nucleus: DTX-sensitive, LVA subunits
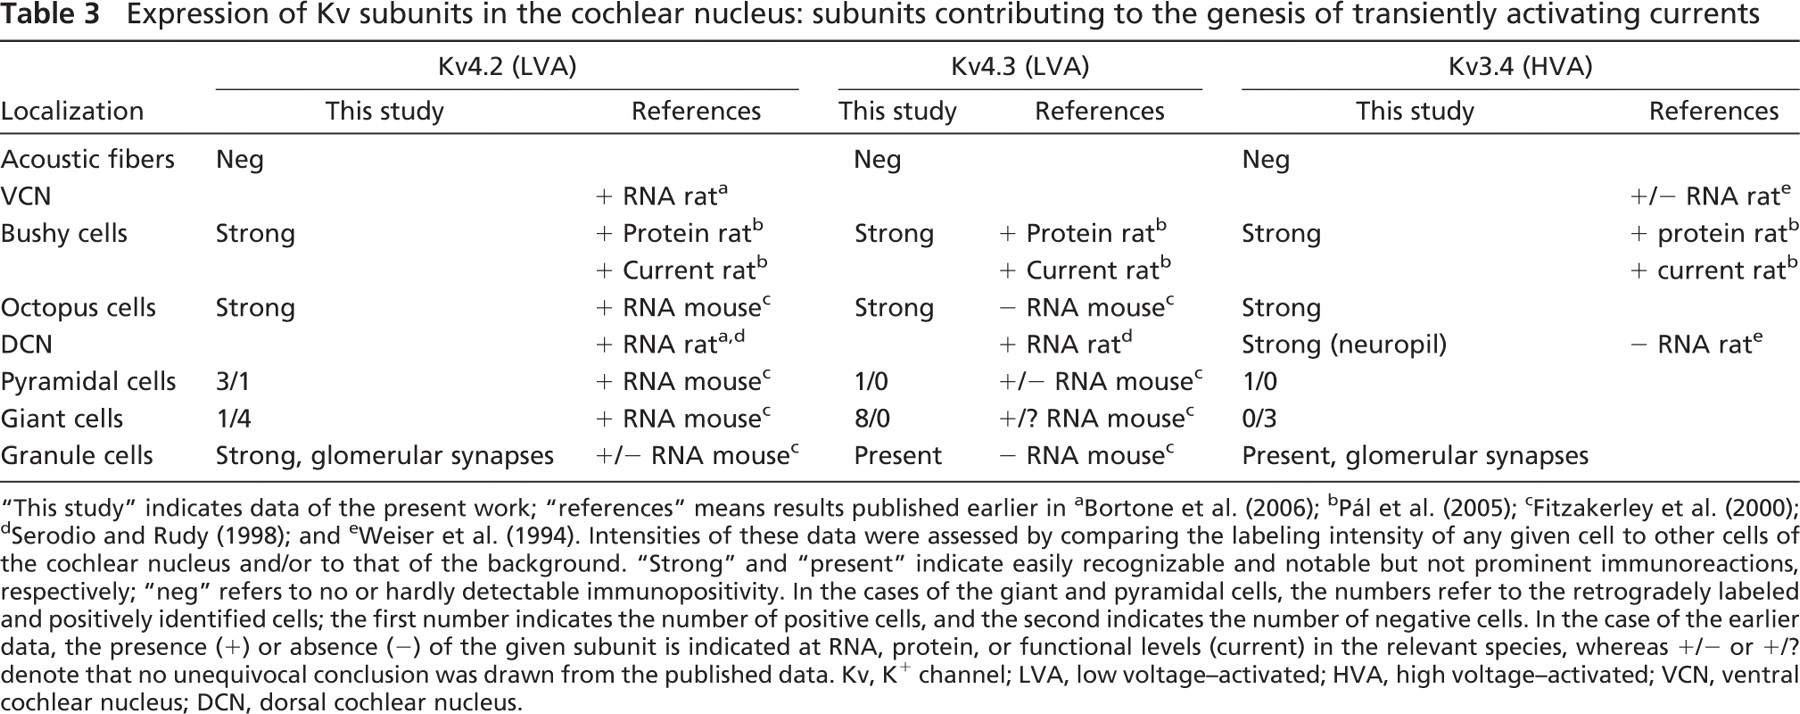
Expression of Kv subunits in the cochlear nucleus: subunits contributing to the genesis of transiently activating currents
Expression of Kv3.1 subunit in the cochlear nucleus
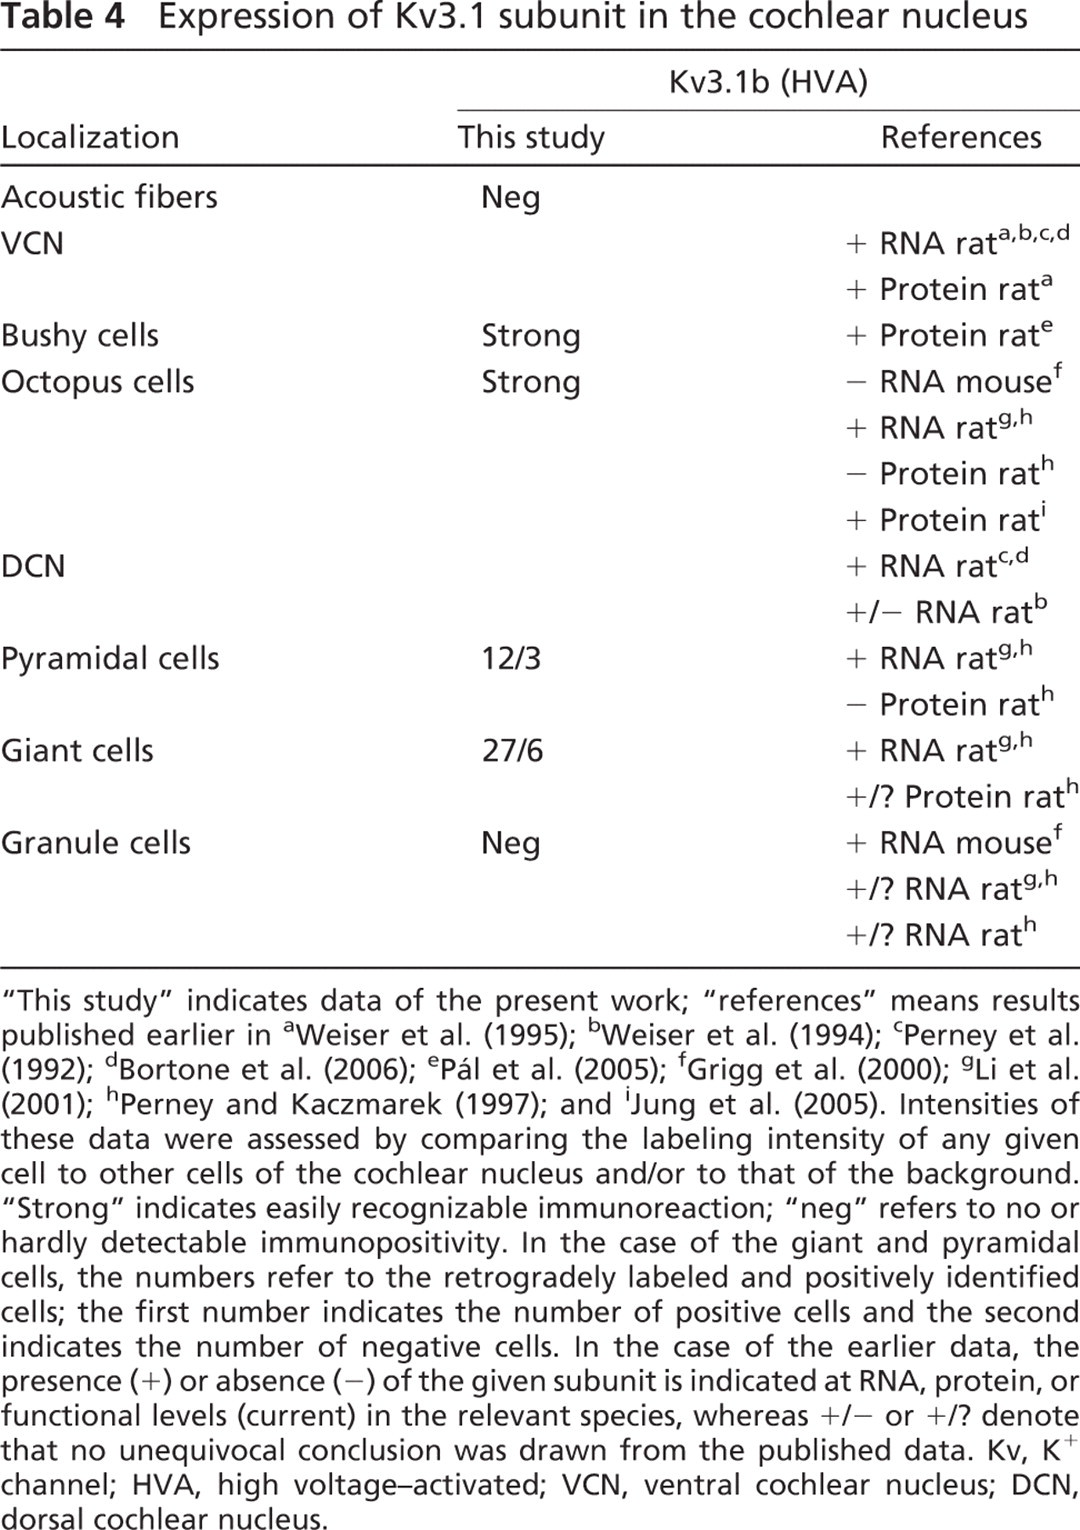
Table 2 summarizes the results of experiments aimed at the detection of the dendrotoxin-sensitive LVA channel subunits. As seen, the expression of the Kv1.1 subunit has been well documented in several species and in various cell types, especially in the VCN (Sequier et al. 1990; Wang et al. 1994; Grigg et al. 2000; Bal and Oertel 2001; Dodson et al. 2003; Rosenberger et al. 2003; Caminos et al. 2005; Jung et al. 2005; Pál et al. 2005; Bortone et al. 2006). In the DCN, however, the situation is somewhat less clear; although the general presence of Kv1.1 protein has been noted (Sequier et al. 1990; Wang et al. 1994), cell-specific labeling was reported in the bat only (Rosenberger et al. 2003). Consequently, the results shown in this study are the first showing the heterogeneity of the giant and pyramidal cells in terms of their Kv1.1 expression patterns. Thus far, only limited data are available about the presence of Kv1.2 and Kv1.6 subunits in the CN. Nevertheless, Kv1.2 expression was noted in the VCN (Wang et al. 1994), and it was shown that both bushy (Pál et al. 2004; Caminos et al. 2005; Bortone et al. 2006) and octopus neurons (Grigg et al. 2000; Bal and Oertel 2001) possessed this subunit. In contrast to the VCN, the potential Kv1.2 expression of the DCN was reported at the mRNA level only (Caminos et al. 2005). Results of this study indicate that Kv1.2 subunits are expressed by both pyramidal and giant neurons of the CN.
In a recent study, when investigating developmental changes occurring in the Kv1.1 and Kv1.2 expression of the rat CN, an age-dependent increase was noted in the expression intensity at mRNA and protein levels. The increase was present from birth up to the 25th postnatal day, and it was followed by a moderate decline to the adult values (Bortone et al. 2006). In a different work (Caminos et al. 2005), however, focusing on Kv1.1 and Kv1.2 expression of the VCN (including bushy cells), a continuous and gradual decline of the expression levels was reported. This reduction started at about the 14th postnatal day and resulted in very low expression levels in adult animals. Moreover, it was noted that the Kv1.2 subunits disappeared from the cell bodies, and at the same time, a continuous increase of the Kv1.2 expression was observed in the acoustic nerve fibers, reaching rather intense levels by the 21st postnatal day. These findings implied that, not only the intensity, but the localization of the Kv1.2 expression might also change during postnatal development.
In this study, the expression of the Kv1.2 subunit was noted in the CN isolated from either young or old animals, (resembling the data presented by Bortone et al. 2006) the intensity of the Kv1.2-specific immunopositivity increased, and it involved the neuropil of the DCN as well. It is very important to note that a characteristic translocation of the Kv1.2 subunits was shown in this study, especially in the case of the octopus and bushy cells. Compared with the young animals, where the Kv1.2 immunopositivity was present intracellularly only, in older animals, the immunopositivity was not only stronger intracellularly, but a pronounced cell surface labeling could also be observed. This observation suggests that, not only the amount of the channel protein might change accompanying the maturation of the auditory pathway, but the density of the functional K+ channels containing Kv1.2 subunits might also increase in the cell surface membrane. Although further work is needed to verify the functional significance of this finding, it is a tempting possibility that the increased density of the Kv1.2 channels of the cell membrane might have roles in the maturation process of the auditory system.
Table 3 shows the results of numerous previous studies concerning the presence and distribution of Kv subunits contributing to the assembly of K+ channels producing transient (inactivating) current. Besides the data presented in Table 3, it should also be mentioned that mRNA encoding a subunit belonging to the Kv4 family has been described in the rat (Drewe et al. 1992). Although the exact type of subunit was not specified, it is unlikely that the mRNA found encoded Kv4.1 proteins, because specific studies indicated the lack of this mRNA in both the rat (Serodio and Rudy 1998) and mouse (Fitzakerley et al. 2000).
Because most of the previous attempts tried to identify the K+ channel subunits producing transient currents at the mRNA level, the data presented here are particularly important because they prove that Kv4.2, Kv4.3, and Kv3.4 proteins are present in the CN. It is worth mentioning that, although glomerular synapses have been shown in the DCN (Kane 1974; Alibardi 2004), this study is the first to show strong Kv4.2 and moderate Kv3.4 expression in these structures.
The most significant Kv subunit contributing to the genesis of delayed rectifier K+ current in the CN is the Kv3.1 (Table 4). In fact, the majority of the authors agreed that Kv3.1-specific mRNA is present in the CN, although the overall picture is more complex when trying to find the Kv3.1 subunits at the protein level. The often confusing data may be the consequence of development-related issues (Bortone et al. 2006): the changes in the amount of the mRNA necessarily precede the modifications occurring at the protein level, causing some apparent discrepancies in the experimental data yielded at the mRNA and protein levels, respectively. Nevertheless, these findings of strong Kv3.1 expression of the bushy cells are in agreement with our previous data (Pál et al. 2005). The intense Kv3.1 expression of the octopus cells is also a noteworthy result of this study. As for the DCN, both the pyramidal and the giant neurons showed some variability of Kv3.1 expression, and this non-uniform occurrence of immunopositivity may explain why earlier studies did not always note definite Kv3.1 positivity of these cells.
Functional Implications
Despite the lack of direct studies of the activity of the CN neurons, some functional assumptions could be made on the basis of their Kv expression. In the case of pyramidal cells, the activity of various LVA K+ channel subunits (Kv1.1, 1.2, 1.6, 4.2, and 4.3) may contribute to the setting of their resting membrane potential that, in turn, plays a decisive role in determining their firing patterns (Kane 1974; Manis et al. 2003). The limited number of earlier papers suggested similar membrane properties and firing characteristics of the giant and pyramidal neurons (Zhang and Oertel 1993; Ding et al. 1999; Babalian et al. 2003), and this view was supported by these experiments indicating similar Kv expression patterns of these two cell types. However, in accordance with some earlier reports (Perney and Kaczmarek 1997; Fitzakerley et al. 2000; Rosenberger et al. 2003), both pyramidal and the giant neurons showed some variability, suggesting that there might be different subtypes within both groups presenting non-uniform functional properties.
Earlier electrophysiological experiments on granule cells showed the presence of a rapidly inactivating, LVA transient (A-type) and a slowly inactivating (delayed rectifier) current (Rusznák et al. 1997). Our present findings indicate that the transient current is mainly the consequence of the activation of K+ channels containing Kv4.2 subunits. Based on the similar distribution pattern of the Kv4.2 subunits in the CN and in the cerebellum (unpublished data), it is proposed that these subunits may have the same roles in the CN as described originally in the cerebellar glomerular synapses (Shibata et al. 2000; Shibasaki et al. 2004; Strassle et al. 2005). In the case of the bushy cells, this study showed the expression of Kv subunits whose presence can explain the K+ current components described earlier (Manis and Marx 1991; Dodson et al. 2003; Rothman and Manis 2003; Cao et al. 2007).
Functional studies have indicated that the coincidence detector role (Golding et al. 1995; Oertel et al. 2000) of the octopus cells is ensured by voltage-gated K+ channels representing all three major functional groups. These findings are clearly in accordance with this conclusion, because Kv subunits from all three functional classes could be detected. Definite, age-dependent translocation of the Kv1.2 subunits and significant expression of the Kv4.2 protein were also noted in the octopus neurons, and both phenomena may be related to developmental changes affecting the functions of these cells.
Footnotes
Acknowledgements
This work was supported by grants from the Hungarian Science Foundation (Hungarian Research Fund, T-046067, NK-61412) and from The Wellcome Trust (Collaborative Research Initiative Grant 075243/Z/04/Z).
We thank Dr. Beatrix Dienes for kind and professional help on some of the confocal microscopy sessions and Ibolya Varga for skilled technical assistance.