
Abstract
We studied the effects of two tissue protectants, polyvinyl alcohol (PVA) and agarose gel, on a kinetic parameter of lactate dehydrogenase LDH that is assumed to be related to the extent of diffusion of the enzyme out of tissue sections during its histochemical assay. The kinetics of the enzyme in mouse gastrocnemius (skeletal) muscle fibers and periportal hepatocytes were determined in unfixed sections incubated either on substrate (
Keywords
where v i is the observed initial velocity calculated from the absorbance increase between 0 and 10 sec, v (the apparent steady-state velocity) and °A are respectively the gradient and intercept on the absorbance axis of the linear regression of the absorbances on incubation time for times between 1 and 3 min, and a is a constant characteristic for a cell type (Nakae and Stoward 1993a, b, 1994a, b). We hypothesize that the diverse values of a are related to the extent to which the enzyme diffuses out of sections during incubation. We further hypothesize that the a values depend on the interactions of the enzyme with intracellular components because there is much evidence that LDH is not free in cells. Previous histochemical studies, for example, have shown that muscle LDH, as well as other glycolytic enzymes, is predominantly localized within the isotropic zones of myofibrils (e.g., Dölken et al. 1975, and references cited therein). Many biochemical studies have reported that some glycolytic enzymes, including LDH, interact with cytoskeletal proteins such as actin filaments (F-actin), tropomyosin, and troponin (e.g., Arnold and Pette 1968; Arnold et al. 1971; Clarke et al. 1985; Poglazov and Livanova 1986; Walsh and Knull 1987; Yasykova et al. 1990), microtubules, and tubulin (Karkhoff–Schweizer and Knull 1987; Walsh et al. 1989; Marmillot et al. 1994). This evidence suggests that some glycolytic enzymes exist in both the fluid phase and the solid phase of the cytoplasm and that changes in the equilibrium between the two phases may play a role in the regulation of glycolytic metabolism within cells (Wilson 1978).
The purpose of the present study was to obtain evidence to support our hypothesis that the parameter a is a constant related to the diffusion of LDH out of tissue sections and is a measure of the interactions of the enzyme with intracellular components. We studied the effects of two tissue protectants, polyvinyl alcohol (PVA) and agarose gel, on the constants a for the LDH reactions in situ in hepatocytes and skeletal muscle fibers. Both these protectants have been explicitly assumed in the past to prevent or limit the diffusion of soluble proteins out of tissue sections (Altman and Chayen 1965; Nolte and Pette 1972a, b; Van Noorden and Vogels 1989a; Van Noorden and Frederiks 1992). A real-time image analysis system (Nakae and Stoward 1995a) was used to determine the kinetics of LDH in individual cells in sections of mouse unfixed tissues incubated either on substrate (
Mouse liver and skeletal muscle both contain predominantly muscle-type (M) isozymes (e.g., Battellino and Blanco 1970). However, the cytoskeletal organizations in skeletal muscle fibers and hepatocytes differ, especially concerning F-actin and microtubules. In skeletal muscle fibers, repeated assemblies of the actin- and myosin-based contractile units of myofibrils dominate the sarcoplasm, and microtubules are present mostly longitudinally between myofibrils and beneath the sarcolemma and transversely in a lattice-like arrangement (Parysek et al. 1984; Kano et al. 1991; Boudriau et al. 1993). In hepatocytes, actin microfilaments are present throughout the cytoplasm, particularly beneath the plasma membranes around the bile canaliculi with a contractile function (Katsuma et al. 1988; Watanabe et al. 1991; Blankson et al. 1995). Microtubules are also present throughout the cytoplasm as fine lace-like threads radiating from the microtubule-organizing center (Parysek et al. 1984; Blank-son et al. 1995).
The initial nonlinearity of the LDH reaction in situ may also be due to inhibition of LDH by pyruvate, a product of lactate oxidation (Stambaugh and Post 1966). Therefore, the effect of pyruvate on the nonlinearity, i.e., the constant a, was examined as well.
Materials and Methods
Tissues
Five adult male ddY mice were sacrificed by cervical dislocation at approximately the same time of day (0945 hr) in January and February. Their gastrocnemius muscles and livers were removed. The livers were cut into pieces no larger than 5 mm3. These pieces and whole gastrocnemius muscles were embedded in Tissue-Tek II OCT compound (Miles Laboratories; Naperville, IL) and immediately quenched in liquid nitrogen. Serial sections of the tissues 4–14 μ thick were cut at −20C at a constant speed in a Bright cryostat (Cambridge, UK) to ensure constancy of intersection thickness (Butcher 1971; Altman 1982) and mounted on coverslips. They were stored at −20C for less than 6 hr before their histochemical assay. To prevent the mounted sections from detaching from the coverslips during incubation, the coverslips were previously coated with 1% bovine serum albumin (Sigma Chemical; St Louis, MO) in water at room temperature (RT) for 5 min, then dried at 60C for 3 hr, fixed with 2.5% aqueous glutaraldehyde (Nacalai Tesque; Kyoto, Japan) at RT for 3 min, rinsed in three changes of distilled water for 30 min, and finally dried again at 60C overnight (Ichikawa and Ajiki 1992).
Model Gel Sections Containing Purified LDH
Purified LDH isolated from rabbit skeletal muscle (Boehringer Mannheim; Mannheim, Germany) was mixed with the ingredients for preparing polyacrylamide gels. The final composition of the mixture was 0.855% LDH, 12% (w/v) acrylamide monomer (Nacalai Tesque) recrystallized from ethanol, 0.6% (w/v) N, N'-methylenebisacrylamide (Nacalai Tesque), 0.188% ammonium peroxodisulfate (Nacalai Tesque) (dissolved just before use), and 75 mM Tris-HCl buffer, pH 7.5. A drop of N, N, N', N'-tetramethylethylenediamine (Nacalai Tesque) was added to the mixture to polymerize it. The mixture was kept at 4C in glass tubes of 5-mm diameter for 5 hr until polymerization was complete. The gel columns were cut in 5-mm-long pieces. The pieces were rinsed at 4C in three changes of 80 mM Tris-HCl buffer, pH 7.5, over 30 min. The buffer solution was removed from the gel surface with filter paper and the gel pieces were embedded in Tissue-Tek II OCT compound and quenched in liquid nitrogen. Serial sections 4–10 μ thick were cut at constant speed and mounted on coverslips in the same way as for tissue sections.
Assay Media for LDH
Three kinds of incubation media were used for the histochemical assays: aqueous substrate media with and without 18% (w/v) PVA (hot-water soluble, weight-average molecular weight 70,000–100,000; Sigma) (Van Noorden and Vogels 1989a; Van Noorden and Frederiks 1992), and a substrate containing 0.8% low gelling temperature agarose (FMC Bio-Products, Rockland, ME) gel film. Their final composition, except for PVA and agarose, was the same: 0.0175–70 mM
Continuous Monitoring of LDH Activity
The time courses of the LDH reaction in tissue and polyacrylamide model sections were monitored with a real-time ARGUS-100 image analysis system (Hamamatsu Photonics; Hamamatsu, Japan) calibrated as described previously (Nakae and Stoward 1993a, 1994a, 1995a). A thermoregulated glass stage (Kitazato Supply; Shizuoka, Japan) was mounted on a Nikon Optiphoto microscope (Tokyo, Japan) fitted with a diode gun Plumbicon camera (Hamamatsu Photonics) connected to an ARGUS-100 image processor. An interference filter with a peak transmission of 584.3 nm (Δλ1/2 = 2.5 nm; Vacuum Optics; Tokyo, Japan) was placed in the light path of the microscope. This wavelength is the isobestic point of the principal final reaction products produced by the reduction of Nitro BT, a red monoformazan and a blue diformazan (Butcher 1978). The light source of the microscope was stabilized with regulated DC power supply (Takasago; Kawasaki, Japan).
The enzyme reaction was started on the stage of the microscope either by placing a gel substrate film attached to a coverslip on a tissue or model section mounted on a coverslip, or by pouring aqueous substrate medium, with or without 18% PVA, into the space between two coverslips separated by 0.7–0.9 mm, one of which had a section mounted on the under surface. Previously the temperature of the microscope stage and the media had been warmed to and stabilized at 37 ± 0.2C. The images of the section, viewed with a × 40 objective, were captured at 10-sec intervals in real time continuously from the start of incubation for 4.5 min. The 28 images obtained were integrated 16 times before storage. Each frame required 1/30 sec for capture. The absorbances of the final reaction products deposited in a circular or elliptical delimited area (17–2835 pixels) of the sarcoplasm of single skeletal muscle fibers in cross-sections of the lateral head of gastrocnemius, in a circular delimited area (45 pixels) of the cytoplasm of single periportal hepatocytes located 40–80 μ from interlobular veins, and in a circular delimited area (2617 pixels) of the model sections containing 0.855% LDH were determined from the stored images as a function of incubation time. A pixel corresponded to 0.25 μ2. The background absorbances of the tissue and model sections mounted on coverslips (background controls) were determined on gel films containing 0.8% agarose and 80 mM Tris-HCl buffer, pH 7.5 (37C). The absorbances of test samples were corrected for the background control and the background image of each incubation medium (shading correction). The background absorbance controls for mouse periportal hepatocytes in 4-, 7-, and 14-μ-thick sections and gastrocnemius muscle fibers in 4-μ-thick sections were taken as 0.0238, 0.0334, 0.0440, and 0.0149 respectively as determined previously (Nakae and Stoward 1993a, 1994a). The background controls (A b) of 0.855% LDH incorporated in polyacrylamide gel sections were found to be linearly related to the microtome setting (1 in μ) by the equation
The data obtained are plotted in Figures 5–7. Each experimental point in Figure 5 was the mean of three measurements in the same section, and in Figures 6 and 6, of 10 measurements.
Initial Reaction Velocity
The observed initial velocities (v i) of LDH reactions in which the activity (absorbance) increase was linear during the first 3 min (Figures 2a and 2b) were determined from the gradients of absorbance–incubation time plots over this time. The observed v i of LDH reactions in which the activity increased nonlinearly during the first minute of incubation (Figures 2c, 3, and 4) were calculated from the absorbance increases between 0 and 10 sec (Nakae and Stoward 1993a, 1994a).
Kinetic Parameter a
The parameter a (see Introduction) was calculated from plots of (v i - v) against °A as described elsewhere (Nakae and Stoward 1993a, b, 1994a, b).
Results
Localization of the LDH Activity
Formazan final reaction products were deposited in the cytoplasm of hepatocytes and skeletal muscle fibers in sections incubated by any of the three histochemical methods described (Figure 1). Three types of fibers, small (Type I), intermediate (Type IIA), and large (Type IIB) fibers (Brooke and Kaiser 1970), were discriminated in the gastrocnemius by respectively strong, intermediate, and weak LDH activity in the cytoplasm (Nakae and Stoward 1995b). Subsarcolemmal mitochondria, especially in the small fibers, showed very high LDH activity (Figure 1b), but these were excluded from the cytoplasmic activity measurements. The final reaction products in hepatocytes were more discretely localized with PVA media than with gel substrate films and aqueous assay media. However, for skeletal muscle fibers and pure LDH in the model sections, the localization was sharper with gel films and PVA media than with aqueous media. Whichever assay method was used, final reaction products were observed in the assay media after incubation with tissue and model sections for 4.5 min. The amount of the formazan present in PVA media was less than that in aqueous assay media, but, by eye, it was not comparable with the extent of the deposition in agarose substrate films, on which imprints of sections are apparent after incubation.
Time Course of the LDH Reaction
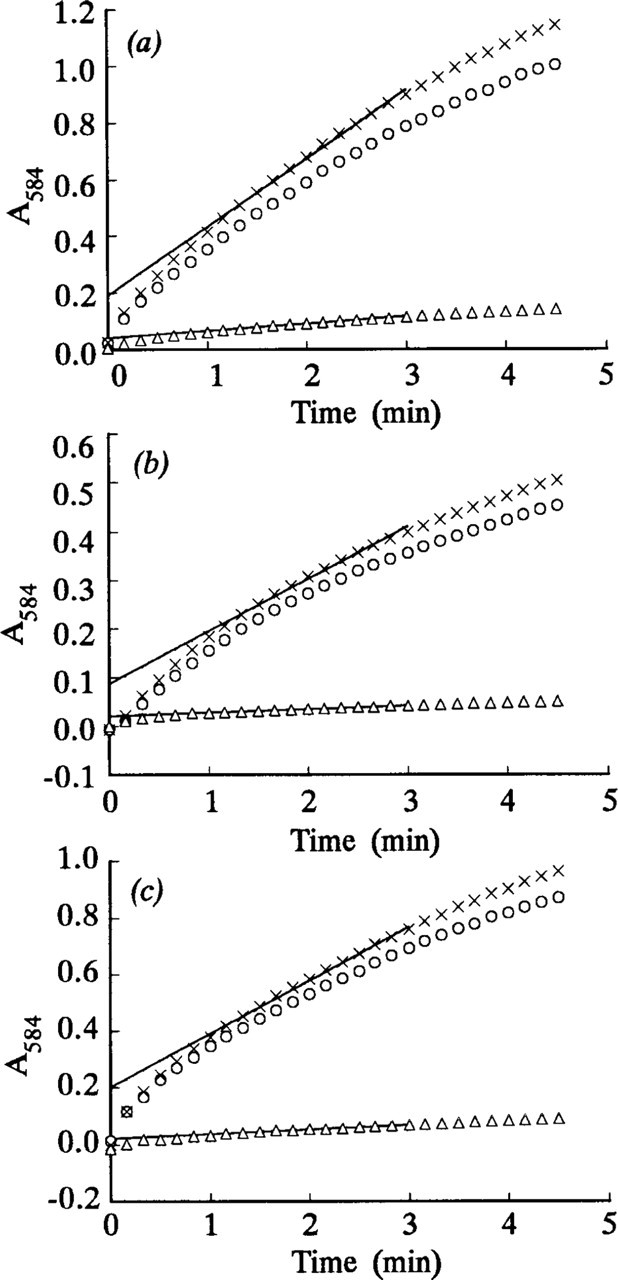
The absorbances of the formazan final reaction products deposited in model acrylamide gel sections containing 0.855% LDH increased linearly during at least the first 3 min of incubation both on the agarose gel films and in the PVA media (Figures 2a and 2b). In contrast, the LDH reaction in model gel sections incubated in aqueous media was nonlinear during the first minute of incubation but was linear for at least 2 min thereafter (the correlation coefficient r = 0.99–1.00, p>0.001, n = 13) (Figure 2c). The activity of pure LDH in the model sections without lactate (“nothing dehydrogenase” activity) was almost zero (Figures 2a–2c). Figure 3 shows the comparative time courses of the LDH reaction in mouse periportal hepatocytes in the sections incubated with the three assay media. They were all nonlinear during the first minute of incubation but linear in the next 2 min of incubation. Similar results were obtained for the LDH reaction in the three types of muscle fibers in the gastrocnemius (shown for small fibers in Figure 4). Even the intrinsic or corrected activity curves for LDH, obtained by subtracting the “nothing dehydrogenase” activity at each incubation time point from the corresponding LDH activity, showed similar nonlinear and linear phases (Figures 2–4). The LDH reaction in periportal hepatocytes and skeletal muscle fibers in the sections incubated with aqueous assay media containing 70 mM
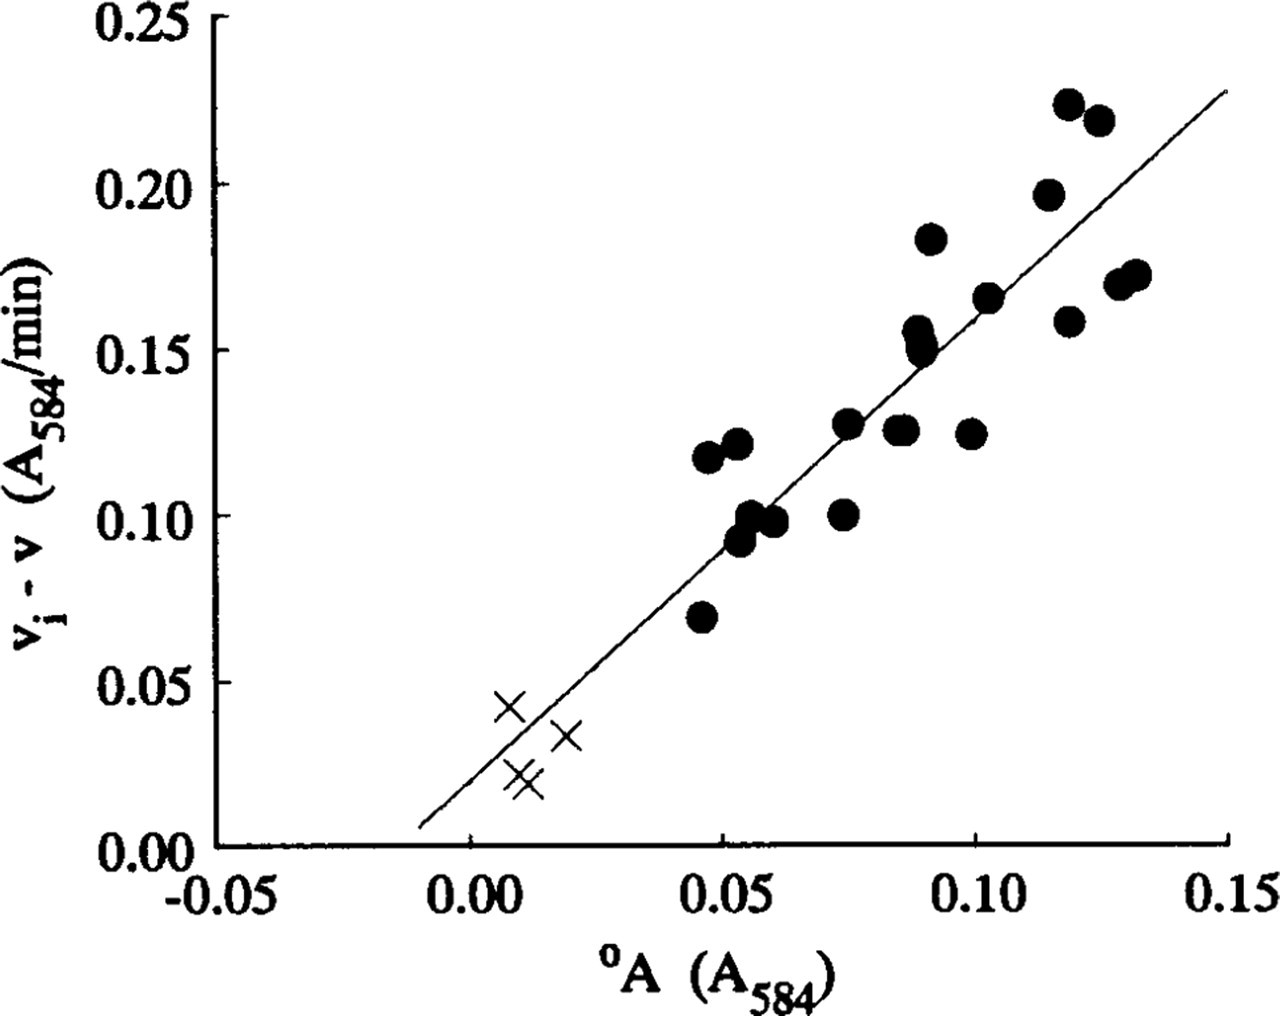
The steady-state velocities v and intercepts °A for the nonlinear LDH reaction were determined from, respectively, the gradients and intercepts of the linear regression best-fits (r = 0.99–1.00, p>0.001, n = 13) for the plots of A 584 of the final reaction products on incubation time for times between 1 and 3 min. A typical plot is shown in Figure 2c. Plots of (v i - v) on °A for all nonlinear uncorrected LDH and “nothing dehydrogenase” reactions were approximately linear. Their linear regression lines, of gradients a, passed through or near the origin and their correlation coefficients were highly significant (Figures 5–7). The plots of (v i - v) on °A for the LDH reaction in periportal hepatocytes in the sections incubated in aqueous substrate media in the presence and absence of pyruvate approximated to the same straight line (Figure 6). A similar result was obtained for three types of skeletal muscle fibers in gastrocnemius muscle. The a value for the linear reaction was zero because the initial velocity was equal to v. Table 1 shows the a values determined by the three assay methods for LDH in model and tissue sections. They were in the ranges 0–1.29, 1.38–2.04, and 1.16–1.50, respectively, for purified LDH in model acrylamide gel sections, LDH in periportal hepatocytes, and LDH in gastrocnemius muscle fibers.
Gray scale images (512 × 483 pixels) of mouse (
Plots of absorbance at 584 nm (A
584) of formazan final reaction products formed by 0.855% pure LDH incorporated into polyacrylamide gel sections, 7 μ thick, as a function of incubation time. The sections were incubated at 37C either (
Plots of absorbance at 584 nm (A
584) of the final reaction products formed by LDH in periportal hepatocytes in 4-μ-thick sections of mouse unfixed liver as a function of incubation time. Symbols and incubation conditions are as in Figure 2. The lines for × and Δ are the linear regression best-fits of A
584 on incubation times between 1 and 3 min (r = 1.00, p>0.001, n = 13). (
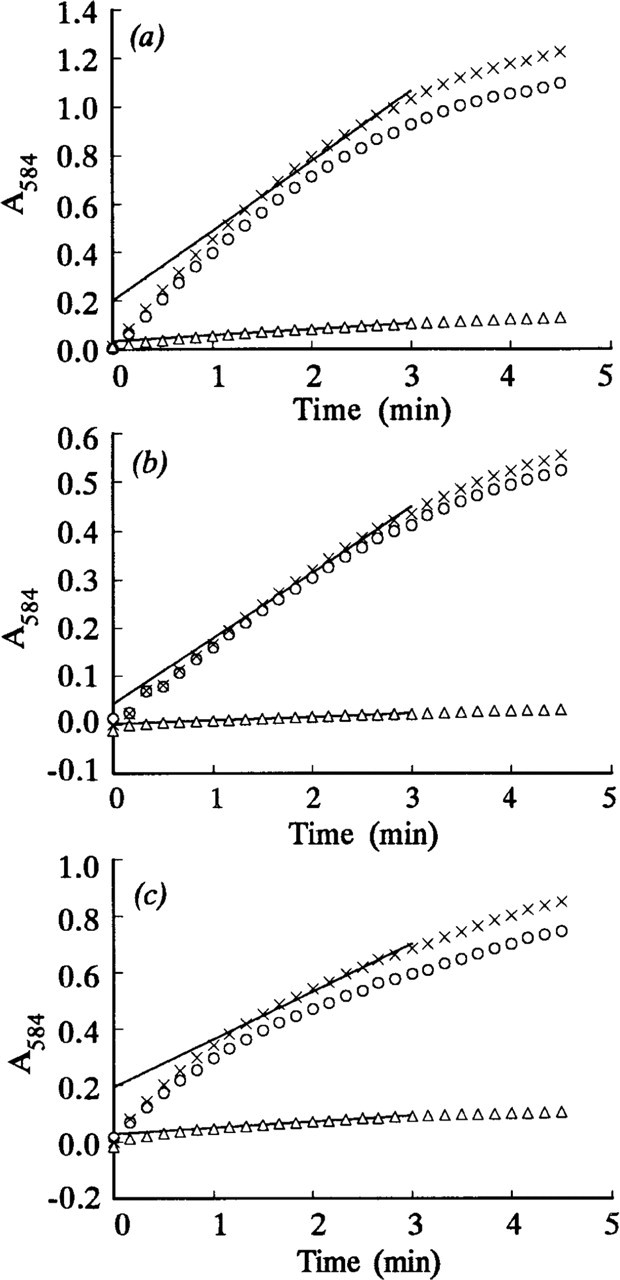
Plots of absorbance at 584 nm (A
584) of the final reaction products formed by LDH in small fibers in 4-μ-thick sections of mouse unfixed gastrocnemius as a function of incubation time. Symbols and incubation conditions are as in Figure 2. The lines are as in Figure 3. (
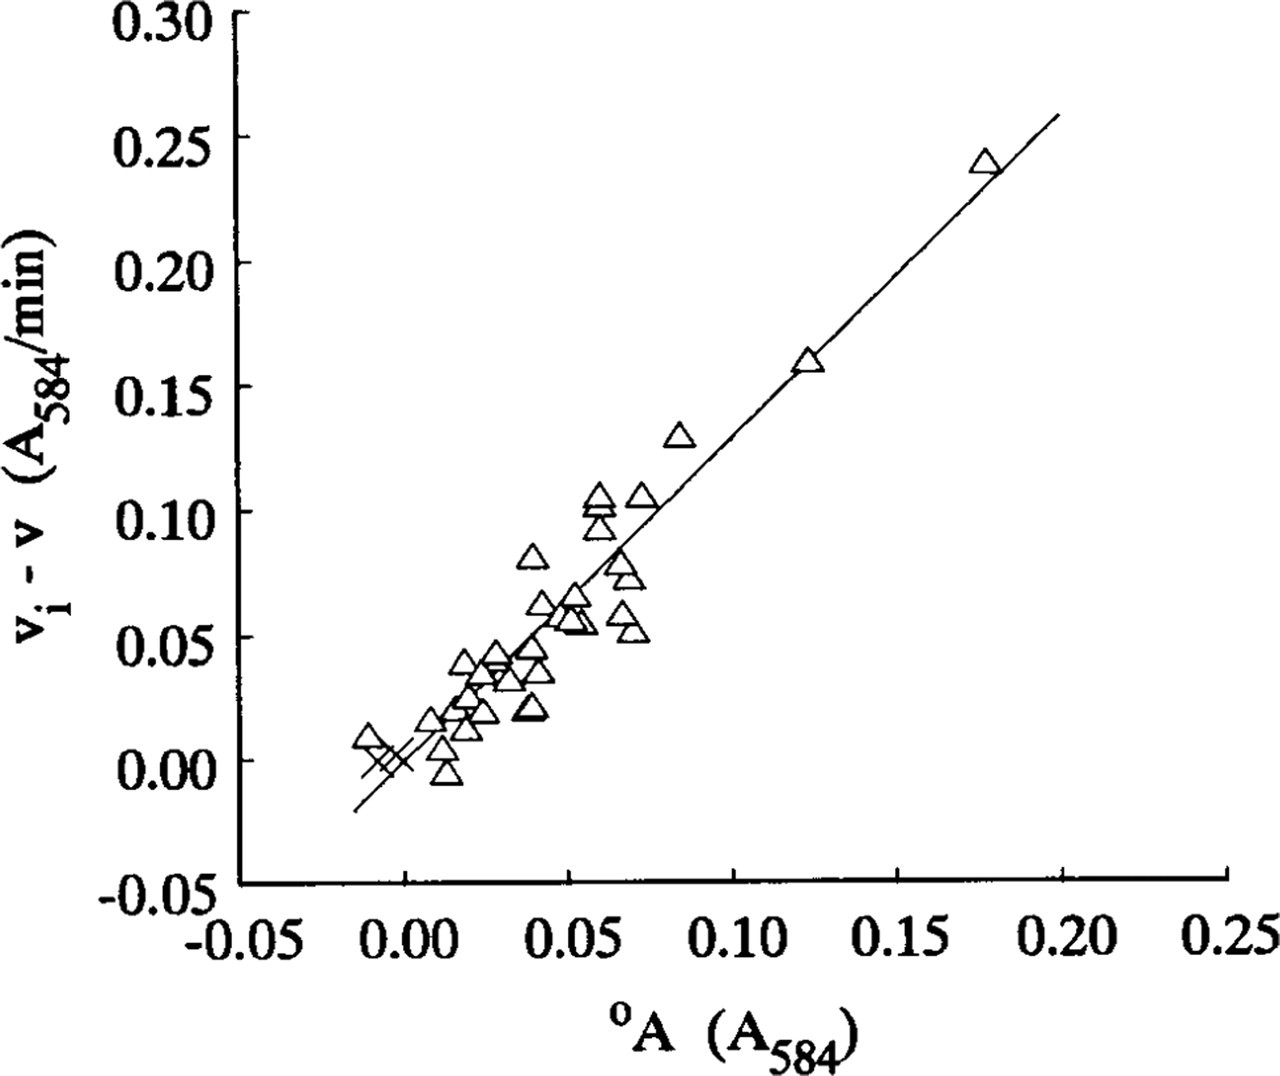
Regression of observed initial velocities minus steady-state velocities (v
i - v) on intercepts °A of LDH absorbance–incubation time plots for 0.855% pure LDH incorporated into polyacrylamide gel sections 4–10 μ thick. The sections were incubated at 37C in PVA-free aqueous media either containing 7–70 mM
v i Calculated from v, °A, and a
The initial velocities v i of the nonlinear LDH and “nothing dehydrogenase” reactions were calculated from the equation v i = v + a°A using the a values shown in Table 1 and v and °A values measured more precisely than the observed v i values, which included some errors in starting time of incubation and outfocus of the image at zero incubation time. Previously we found that this gave a more consistent measurement of v i than either curve fitting or tangent fitting at t = 0 of the absorbance–time plot (Jonker et al. 1995). Addition of 1–100 mM pyruvate to the PVA-free aqueous media containing 70 mM lactate reduced the initial velocities of LDH in periportal hepatocytes and skeletal muscle fibers to 53–12% and 65–2%, respectively.
The intrinsic LDH velocities (Table 1) were calculated by subtracting the initial velocities of “nothing dehydrogenase” activity from those of uncorrected LDH activity determined at a saturated lactate concentration (70 mM). For all the specimens investigated, the intrinsic LDH velocities determined on the substrate gel films and in the aqueous assay media were similar but were 1.8–3.1 times higher than those determined with PVA media.
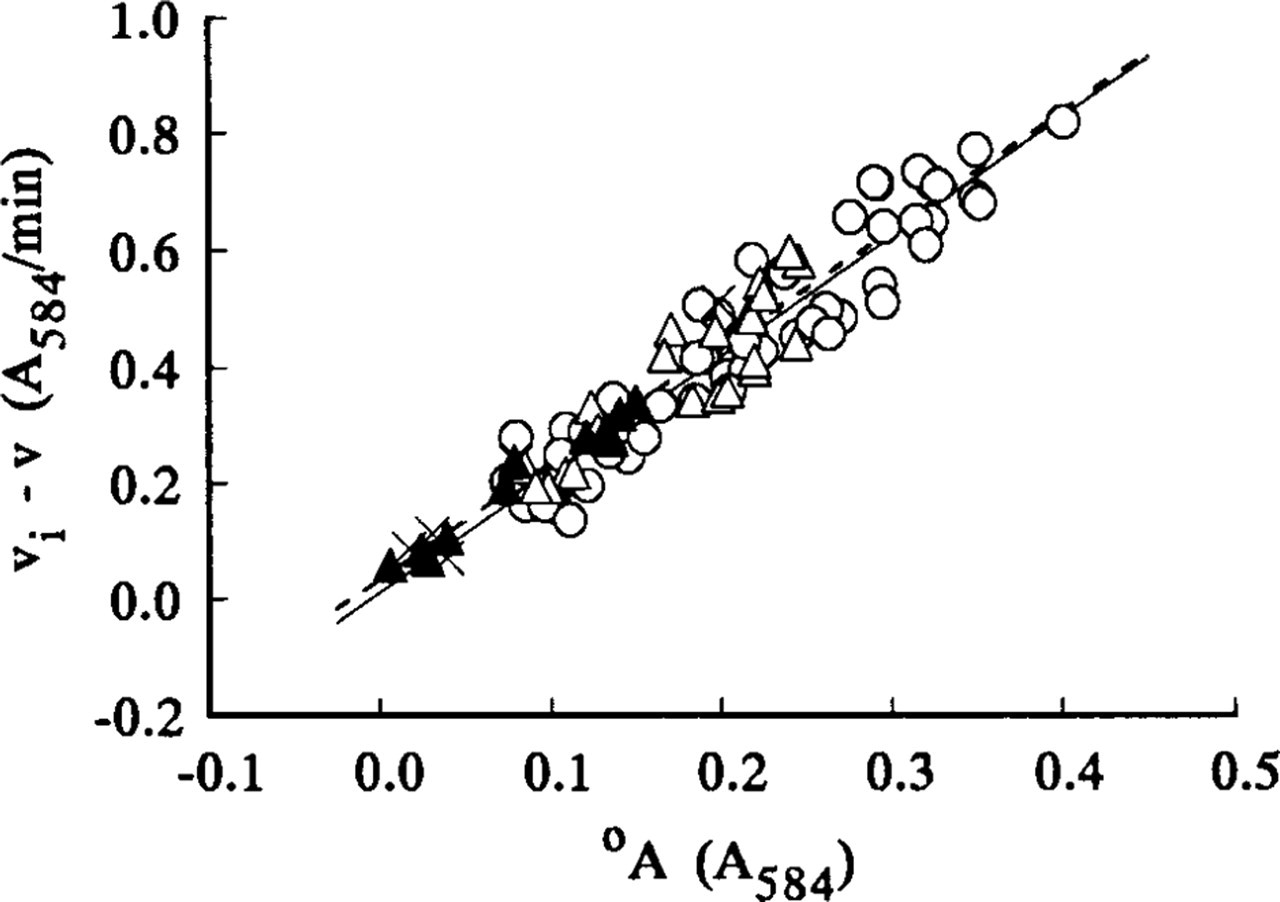
Regression of (v
i - v) on intercepts °A of LDH absor-bance-incubation time plots for periportal hepatocytes in 4–14-μ-thick sections. The sections were incubated at 37C either on gel substrate films (o) or in PVA-free aqueous media (Δ) containing 0.0175–70 mM
Regression of (v
i - v) on intercepts °A of LDH absor-bance-incubation time plots for periportal hepatocytes in 4-μ-thick sections. Sections were incubated in 18% PVA media either containing 7–70 mM
Discussion
The constants a in the equation v
i - v = a°A that have been determined previously from the linear regression plots of observed v
i minus v on °A for the LDH reaction in skeletal muscle fibers, hepatocytes, and cardiac muscle fibers in the sections incubated on gel substrate films were respectively 1.2, 2.2, and 1.5 (Nakae and Stoward 1994a). As we have suggested previously, these variable values of a may be related to the different composition of LDH isozymes in cells of different types. It has been known for many years that skeletal muscle and liver contain principally the M-type LDH isozyme but cardiac muscle the H-type (e.g., Battellino and Blanco 1970). However, there are two other interpretations for the observed initial nonlinearity of the intrinsic LDH reaction. One is product inhibition of LDH by pyruvate and the other is diffusion of some of the enzyme out of the sections during incubation (Nakae and Stoward 1993a). The following data obtained in the present study support the second interpretation. Pyruvate did not affect the a values in periportal hepatocytes and skeletal muscle fibers, although the activities were considerably reduced by it (Figure 6). The a values for LDH in skeletal muscle fibers in tissue sections and pure LDH in model acrylamide sections incubated on substrate gel films and in aqueous assay media differed (respectively 1.16
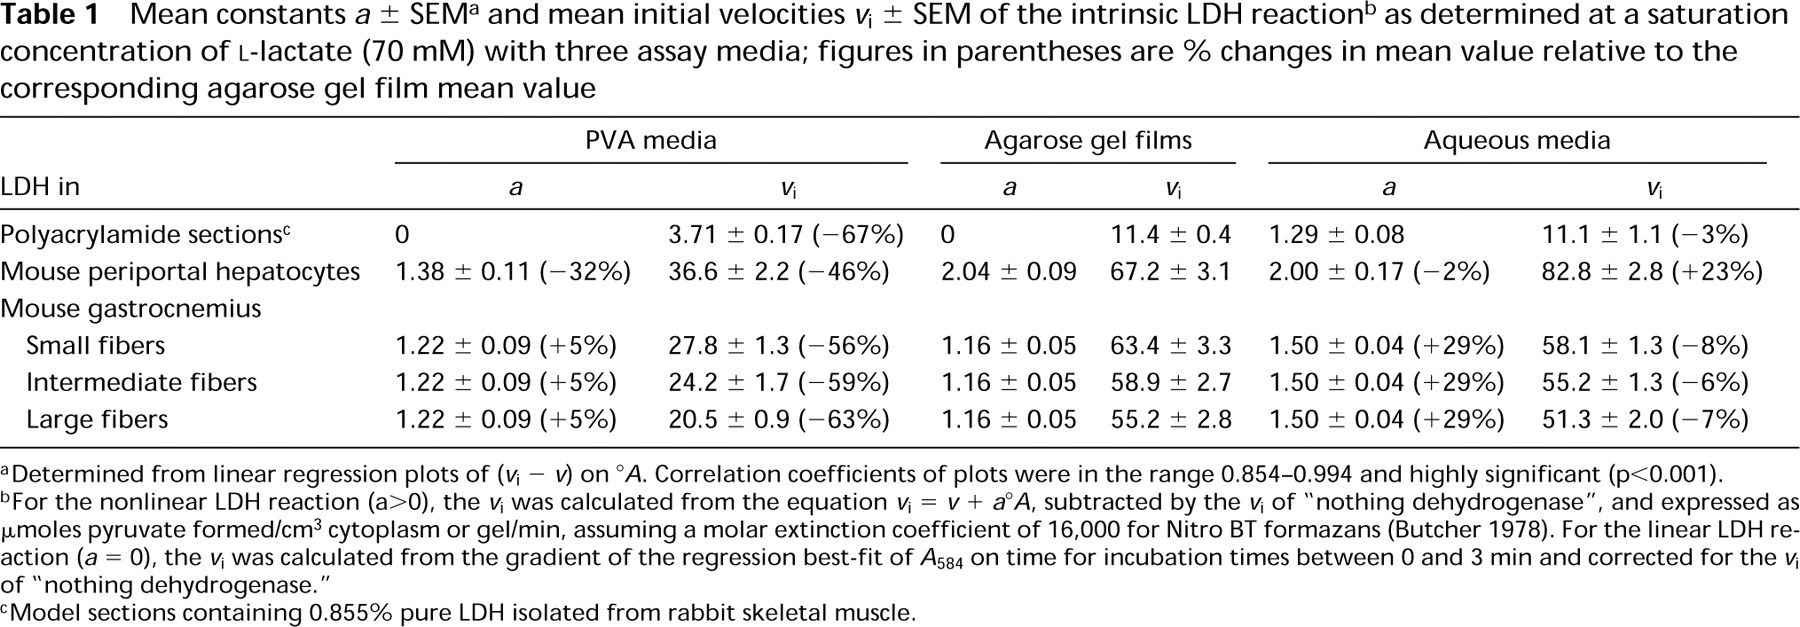
aDetermined from linear regression plots of (v i - v) on °A Correlation coefficients of plots were in the range 0.854–0.994 and highly significant (p>0.001).
bFor the nonlinear LDH reaction (a>0), the v i was calculated from the equation v i = v + a°A, subtracted by the v i of “nothing dehydrogenase”, and expressed as μoles pyruvate formed/cm3 cytoplasm or gel/min, assuming a molar extinction coefficient of 16,000 for Nitro BT formazans (Butcher 1978). For the linear LDH reaction (a = 0), the v i was calculated from the gradient of the regression best-fit of A 584 on time for incubation times between 0 and 3 min and corrected for the v i of “nothing dehydrogenase.”
cModel sections containing 0.855% pure LDH isolated from rabbit skeletal muscle.
The highest a value (2.0; Table 1) for LDH in periportal hepatocytes in sections incubated on substrate gel films or in aqueous assay media suggests that most of the enzyme in hepatocytes is present in a soluble form in the cytoplasm. However, diffusion of the enzyme out of liver sections can be limited by including 18% PVA in the incubation medium, causing the a value to be lower (1.38). In contrast, the reaction catalyzed by LDH incorporated into polyacrylamide gel sections incubated either on agarose gel films or in PVA media was linear for at least first 3 min of incubation and the a value was zero. This indicates that little or no diffusion of the enzyme out of the sections occurs during that time. In aqueous assay media, on the other hand, pure LDH does diffuse out of polyacrylamide sections (a = 1.29). The a values for the enzyme in three types of skeletal muscle fibers showed similar variations to those for pure LDH incorporated into polyacrylamide gel sections, although the muscle values are higher as a whole than those for the latter (Table 1). Moreover, the a values for skeletal muscle fibers determined with three assay media were lower than those for periportal hepatocytes. These data suggest that PVA is a more effective tissue protectant than agarose gel for LDH in hepatocytes but that both are equally effective for LDH in skeletal muscle fibers. They also indicate that more LDH diffuses from hepatocytes than from muscle fibers and that LDH in skeletal muscle fibers may be restricted or shielded by interactions with structural components or macromolecules in the sarcoplasm.
Several groups (e.g., Dölken et al. 1975) have demonstrated histochemically that LDH is predominantly localized within isotropic zones of the cross-striation in skeletal muscle fibers. Many reports of the interactions of the enzyme with F-actin in vitro have been published since Arnold and Pette (1968) first suggested it. The dissociation constants (K d) of the LDH–F-actin complex are very low, 8 nM (Poglazov and Livanova 1986) to 2.1 μ (Arnold et al. 1971). It is also known that purified LDH binds to intracellular proteins such as tubulin (K d = 1.0 μ), microtubules (K d = 3.5 μ) (Walsh et al. 1989), and troponin (K d = 0.73–2.3 μ; Yasykova et al. 1990). Skeletal muscle LDH has been observed to be localized in sarcoplasmic reticulum (e.g., Baba and Sharma 1971) and mitochondria (Baba and Sharma 1971; Lluis 1984; Szczçsna–Kaczmarek 1990). Mitochondria isolated from liver also contain LDH (e.g., Brandt et al. 1987). Furthermore, there is the possibility that differences in mitochondrial volume densities are responsible for the diverse a values for LDH in various cell types (Nakae and Stoward 1994a).
The initial velocities calculated from the equation v
i = v + a°A for 0.855% purified LDH in the model sections and LDH in periportal hepatocytes and skeletal muscle fibers in the presence of 18% PVA were found in our study to be respectively 33%, 44–54%, and 37–48% of those in the absence of PVA. This may be explained by the reduction in the catalytic center activity k
cat of LDH by the high viscosity of the PVA media. A less probable explanation is the inhibition of the activities by PVA itself because the Michaelis constants of LDH (against
The activities (velocities) of LDH in situ in the presence of PVA have been reported previously as 7.5 μoles pyruvate formed/cm3/min for mouse skeletal muscle (Altman 1978) and 4.4 units for rat liver (Altman 1978; Van Noorden and Vogels 1989b). These values are 12–37% of those we found in the present study. The substrate concentration of 10 mM used by Altman is much lower than the saturated concentration we used (70 mM; Nakae and Stoward 1993b, 1994b, 1997). Therefore, it is not unexpected that the velocities determined by him are lower than ours. The lower velocity reported by Van Noorden's group, who used a similar substrate concentration to ours, may be due either to differences in the conditions of assay (e.g., a lower temperature) and of microdensitometric measurements (e.g., a larger area size of measurements including cell nuclei and a different standardization of zero incubation time), or to biological differences.
In conclusion, we have found that the constant a in the equation v i = v + a°A is a useful indicator for revealing differences in the microenvironments of LDH in various types of cell. Further investigations are necessary, however, to identify which cytoskeletal protein is responsible for the diverse a values of LDH within cells.
Footnotes
Acknowledgements
We thank Professor Dr C.J.F. Van Noorden, University of Amsterdam, for his advice concerning grades of PVA.