
Abstract
We developed a quantitative histochemical assay for measurement of local glutamate concentrations in cryostat sections of rat liver. Deamination of glutamate by glutamate dehydrogenase (GDH) was coupled to the production of formazan and formazan precipitation was used for colorimetric visualization. The method was tested and validated with gelatin model sections with known glutamate concentrations. Calibration graphs showed linear relationships with high correlation coefficients (>96%) between glutamate concentrations or section thickness and absorbance values. The method was reproducible, with a constant percentage of 60 ± 5% of glutamate being converted in gelatin model sections containing glutamate concentrations of 2 mM and higher. Glutamate concentrations were estimated in periportal, intermediate, and pericentral zones of liver lobules that contain low, intermediate, and high GDH activity, respectively. In fed adult male rat livers, periportal zones contained the highest concentrations of glutamate (∼14 mM) and intermediate and pericentral zones ∼13 and 9 mM, respectively. On starvation, glutamate concentrations increased only in the small rim of pericentral cells that express glutamine synthetae, to ∼15 mM. In livers of fetal and newborn rats, glutamate was homogeneously distributed, with a concentration of ∼5 mM. In suckling rat liver, distribution of glutamate was still homogeneous but the concentration was increased to ∼8 mM. These glutamate distribution patterns were in agreement with those detected immunohistochemically.
Keywords
I
The aim of the present study was the development of a simple method for the localization and quantification of endogenous substrate concentrations in different zones of the liver lobule in cryostat sections at the light microscopic level. Glutamate was chosen as a model substrate because it is present in the liver in relatively high concentrations (Boon et al. 1991). Glutamate concentrations were determined by linking glutamate conversion by glutamate dehydrogenase (GDH) to the production of formazan, which is colored and water-insoluble, and by measuring local formazan production by image analysis (Chieco et al. 1994; Jonker et al. 1995). The choice of glutamate also allowed semiquantitative immunohistochemical validation of distribution patterns of cellular glutamate that were obtained with the histochemical technique, because antibodies against glutamate are available (Pow and Crook 1993). An inherent problem of cryopreservation of tissues for subsequent histochemical analysis is that tissue metabolism can be stopped rapidly but not instantaneously, as is customary for metabolite assays. For that reason, we also compared our data on the lobular distribution patterns of glutamate with the intracellular concentration of this amino acid in isolated periportal and pericentral hepatocytes.
Materials and Methods
Principle of the Detection Method
The reactions used to measure endogenous glutamate concentrations in unfixed liver cryostat sections are as follows:
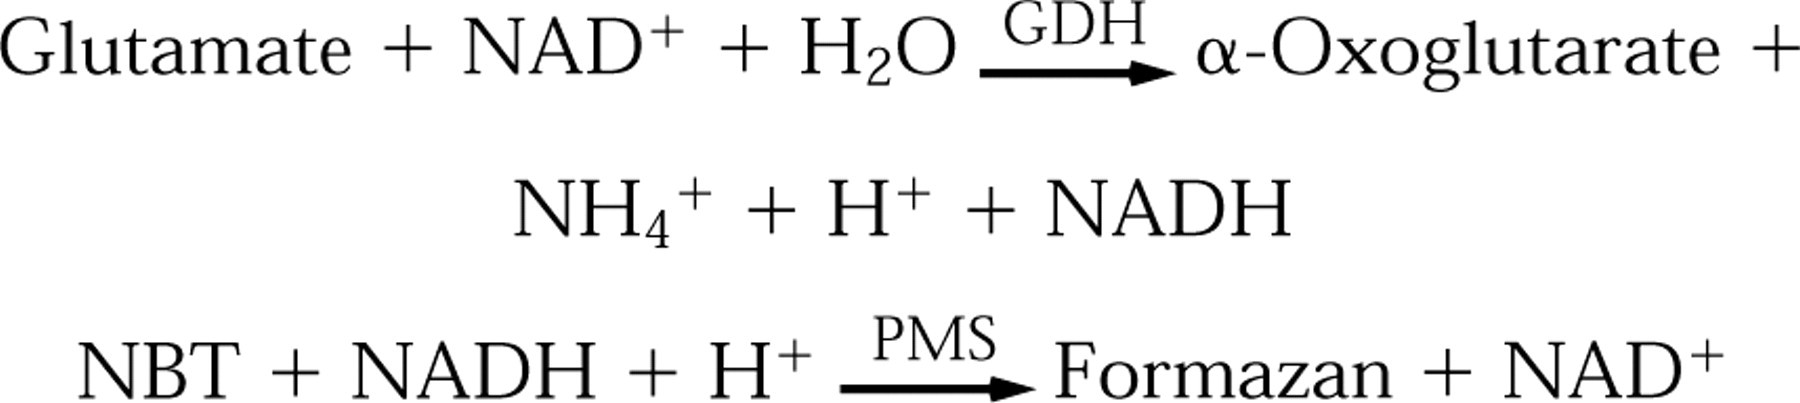
GDH (EC 1.4.1.2) converts glutamate into ammonia and α-oxoglutarate and simultaneously reduces NAD+ to NADH. NADH reduces nitroblue tetrazolium salt (NBT) to its formazan via the electron carrier phenazine methosulfate (PMS). The histochemical procedure is described in detail by Van Noorden and Frederiks (1992).
Glutamate Measurements in Gelatin Model Sections
For development and validation of the method, gelatin model sections were used (Koopdonk–Kool and Van Noorden 1995). For this purpose, plastic cups containing different concentrations of glutamate (Janssen Chimica; Beerse, Belgium) in 0.1 M Tris-Hepes buffer (pH 7.4, 7.7, or 8.0) and 8% (w/v) low gel strength gelatin (Fluka Chemie; Buchs, Switzerland) were frozen in liquid nitrogen and stored at −70C until further use. Gelatin model sections (thickness 5–16 μm) were cut on a cryostat (Adamas; Leerdam, the Netherlands) fitted with a rotary retracting microtome set at a low but constant speed to ensure constant section thickness (Butcher 1971; Van Noorden and Frederiks 1992). The glutamate-containing gelatin sections were cut at −25C, and picked up onto clean glass slides, and stored in the cryostat cabinet until further use.
A sandwich was made as described by Mueller–Klieser et al. (1988) by placing a second 20-μm thick section on top of the first glutamate-containing section. This second section consisted of 8% gelatin in 0.1 M Tris-Hepes buffer (pH 7.4, 7.7, or 8.0), 5 mM sodium azide (Merck; Darmstadt, Germany), 0.2 mM PMS (Serva; Heidelberg, Germany), 5 mM NBT (Serva), 5 mM EDTA (Merck), 4 mM NAD+ (Boehringer; Mannheim, Germany), 1.6 mM adenosine diphosphate (ADP; Boehringer), and 150 U GDH (from beef liver; Boehringer) per ml gelatin medium. Conversion of glutamate to α-oxoglutarate results in the release of two electrons, whereas four electrons are needed for complete reduction of NBT (Altman 1976; Seidler 1991). The pH of both substrate- and enzyme-containing gelatin solutions was carefully checked and set at the correct final pH before chilling the medium in liquid nitrogen. The sandwiches were stored in the cryostat cabinet until further use.
Incubations were performed at 37C in a moistened chamber for various time intervals to convert glutamate present in the first section. After incubation, sections were covered with a glycerin-gelatin mounting medium and a coverslip. Formazan production was measured immediately to avoid any nonspecific formazan production (Wenk and Seidler 1983), using either a scanning and integrating cytophotometer (M85a; Vickers, York, UK) or a cooled CCD camera (Photometrics; Tucson, AZ) (Jonker et al. 1995) mounted on a Zeiss Axiophot microscope.
Measurements with the Vickers M85a cytophotometer were performed at 585 nm with a x6.3 planachromatic objective (NA 0.20), a band-width setting of 65, a mask with an effective diameter of 190 μm, and a scanning spot with an effective diameter of 3.2 μm. The Photometrics cooled CCD camera was used with a x2.5 objective (NA 0.075). Sections were illuminated with white light from a stabilized power supply and filtered with an infrared blocking filter (Chieco et al. 1994) and a monochromatic filter of 585 nm, the isobestic wavelength of NBT formazan. The molar absorbance coefficient of NBT-formazan (k = 16,000 l.mol-1.cm-1 at 585 nm) (Butcher 1978) was used for the calculation of concentrations of formazan as a measure for glutamate concentrations.
For the assay of glutamate in tissue sections, the sandwich technique used for gelatin model sections was replaced by a method based on a polyvinyl alcohol (PVA)-containing incubation medium. The use of this liquid medium allows more rapid and uniform contact between tissue sections and incubation medium. Therefore, the validity of this method was tested by direct comparison with the sandwich technique using the gelatin model sections. Incubation medium for the glutamate concentration test reaction contained 10% PVA (weight average Mr 70,000–100,000; Sigma, St Louis, MO) in 0.1 M Tris-Hepes buffer (pH 8.0), 225 mM sodium chloride, 5 mM sodium azide, 5 mM EDTA, 2 mM ADP, 0.2 mM PMS, 4 mM NAD+, 5 mM NBT, and 150 U GDH per ml medium. The final pH was 8.0. To start the reaction, a metal spacer (0.5 mm) on a coverslip was filled with incubation medium and placed on top of the section. This ensured an even distribution of the medium over the entire section (Jonker et al. 1995). Incubations were performed in a moistened chamber at 37C. After 20 min of incubation, medium was removed by rinsing with running tapwater. Measurements were made as described above.
Glutamate Measurement in Rat Liver Cryostat Sections
Adult male rats with free access to food and water, adult male rats fasted for 24 hr, rat embryos at 3 days before birth, and rat neonates at 0 or 7 days after birth, all of the Wistar strain, were used for this study. Environmental temperature was kept at 21–22C and the relative humidity at 60%. Rats were exposed to a 12-hr light-dark cycle (light 0700–1900 hr). The liver was removed between 0900 and 1100 hr to avoid chronobiological variations. The rats were lightly anesthetized with CO2/O2 before decapitation, the abdominal cavity was opened, and the liver was removed within 30 sec. Fragments of the liver were placed in screw-capped aluminum vials (Sanbio; Uden, the Netherlands) and immediately frozen in liquid nitrogen. The frozen material was stored at −70C until further use. Serial sections (8 or 16 μm) were cut and sections were picked up individually onto clean glass slides and kept in the cryostat until further use. For each measurement, a set of three serial sections was used to perform the glutamate concentration test and control reaction and the GDH activity assay for topographical reference. PVA-containing media as described above were used for the test reaction to measure glutamate levels in sections. The glutamate-independent background formation of formazan (control reaction) was determined by including 30 mM α-oxoglutarate (Sigma), one of the products of the GDH reaction, in the reaction medium to inhibit deamination of glutamate completely (Kugler 1988; Jonker et al. 1995). Sections were mounted in glycerin-gelatin and cytophotometric “endpoint” measurements of formazan precipitation in test and control sections were performed using an image analysis system as described earlier (Jonker et al. 1995).
Localization of GDH activity was demonstrated using the medium described for the glutamate assay, except that GDH was omitted and 100 mM glutamate (pH 8.0) was added as substrate (Jonker et al. 1995). To relate tissue concentrations of glutamate to GDH activity patterns, areas of low (periportal zone), intermediate, and high (pericentral zone) GDH activity were delineated using a homemade kernel in the NIH image software program [written by Wayne Rasband (US National Institutes of Health) and available via Internet by anonymous ftp from zippy.nimh.nih.gov]. Differences in mean absorbance values (± SEM) of formazan precipitation were determined between corresponding areas of the glutamate test and control sections and were converted into glutamate concentrations.
Immunohistochemical Localization of Glutamate in Liver Tissue Sections
Local differences in glutamate concentrations, as measured with the histochemical method, were validated using immunohistochemistry on cryostat and paraffin-embedded sections of livers. Serial cryostat sections were picked up individually onto clean glass slides and fixed immediately. Two types of chemical fixation were applied to the sections: glutaraldehyde 2.5% (w/v)/formaldehyde 1% (w/v) or methanol/acetone/water [40:40:20 (v/v/v)]. Fixation lasted for 15 min at room temperature (RT). The first fixative crosslinks glutamate to proteins, whereas the second fixative precipitates glutamate. After fixation, sections were rinsed briefly in PBS, pH 7.4. The immunohistochemical detection of glutamate was performed with either a commercially available polyclonal antibody against glutamate (1:1,000; Sigma) or a polyclonal antibody against glutamate that was kindly provided by Dr. Pow (1:200,000; Pow and Crook 1993). Incubations with the primary antibody were performed overnight at RT. A series of primary antibodies against various enzymes [GDH; glutamine synthetae (GS); carbamoylphosphate synthetae (CPS)] were used for topographical reference. The indirect unconjugated peroxidase–antiperoxidase technique was used for visualizing antibody binding (Sternberger 1986).
Glutamate Measurement in Isolated Hepatocytes
Total hepatocyte populations were isolated from male Wistar rats (200–250 g) fasted for 20–24 hr, as described by Groen et al. (1982). Periportal and pericentral hepatocyte populations were isolated according to Lindros and Penttilä (1985). Incubation of hepatocytes (5–10 mg dry mass per ml) was carried out in closed 25-ml plastic counting vials. The maximal incubation volume was 2 ml to ensure adequate equilibration with the gas phase (95% O2 plus 5% CO2), which was refreshed every 30 min. Cells were incubated for 60 min at 37C in Krebs-Henseleit bicarbonate medium containing 2 mM octanoate, 1.3 mM Ca2+, and 10 mM Na-Hepes, pH 7.4. The final concentrations of amino acids present in the amino acid mixture used in the incubations were comparable to those found in the portal vein of fed rats [cf. Meijer et al. (1985) for composition], except that ornithine was used instead of arginine.
Intracellular amino acid concentrations were measured after separation of the cells from the incubation mixture by centrifugation through silicone oil (AR 200:20=3:2; Wacker Chemie, Munich, Germany) into a layer of sulfosalicylic acid (10%, m/v). To minimize corrections for amino acids present in the extracellular fluid adhering to the cells, hepatocytes were diluted fivefold with ice-cold Krebs–Henseleit bicarbonate medium before their centrifugation through silicone oil. The protein-free extract of the cells was brought to pH 2.2 with 1 M LiOH and was used to measure intracellular concentrations of amino acids. Amino acid concentrations were measured with an LKB Alpha Plus amino acid analyzer, using a lithium citrate buffer system. Carbamoylphosphate synthetae activity was measured according to Lund and Wiggins (1987). Glutamine synthetae activity was measured according to the method of Levintow (1954).
Definition of the Liver Architecture
Different architectural subunits have been described in the past (for overview see Lamers et al. 1989). In this study the concept of the metabolic lobule (Lamers et al. 1989) was used with a subdivision into periportal, intermediate, and pericentral zones that was based on differences in cellular GDH activity. Pericentral zones were subdivided into a GS-positive and a GS-negative compartment (Figure 1).
Results
Glutamate Concentration Measurements in Model Sections
Absorbance measurements in gelatin model sections showed that the maximal difference between formazan precipitation in test and control reactions was reached after 20 min of incubation and that this difference remained constant thereafter (data not shown). Absorbance measurements in gelatin model sections of various thicknesses containing different concentrations of glutamate that was converted at three different pHs are depicted in Figure 2. The amount of formazan produced at each concentration of glutamate tested increased with increasing pH (Figure 2A), with the highest conversion seen at pH 8.0 (inset in Figure 2A). Incubations at higher pH were not tested because of spontaneous formation of precipitates in the incubation medium (Altman 1976). Linear relationships with a high correlation coefficient (>0.96) were found between the amount of formazan produced and both glutamate concentration (Figure 2A and inset in Figure 2B) and section thickness (Figure 2B). The latter finding demonstrated that glutamate and GDH interacted without apparent diffusion problems in the gelatin model sections.
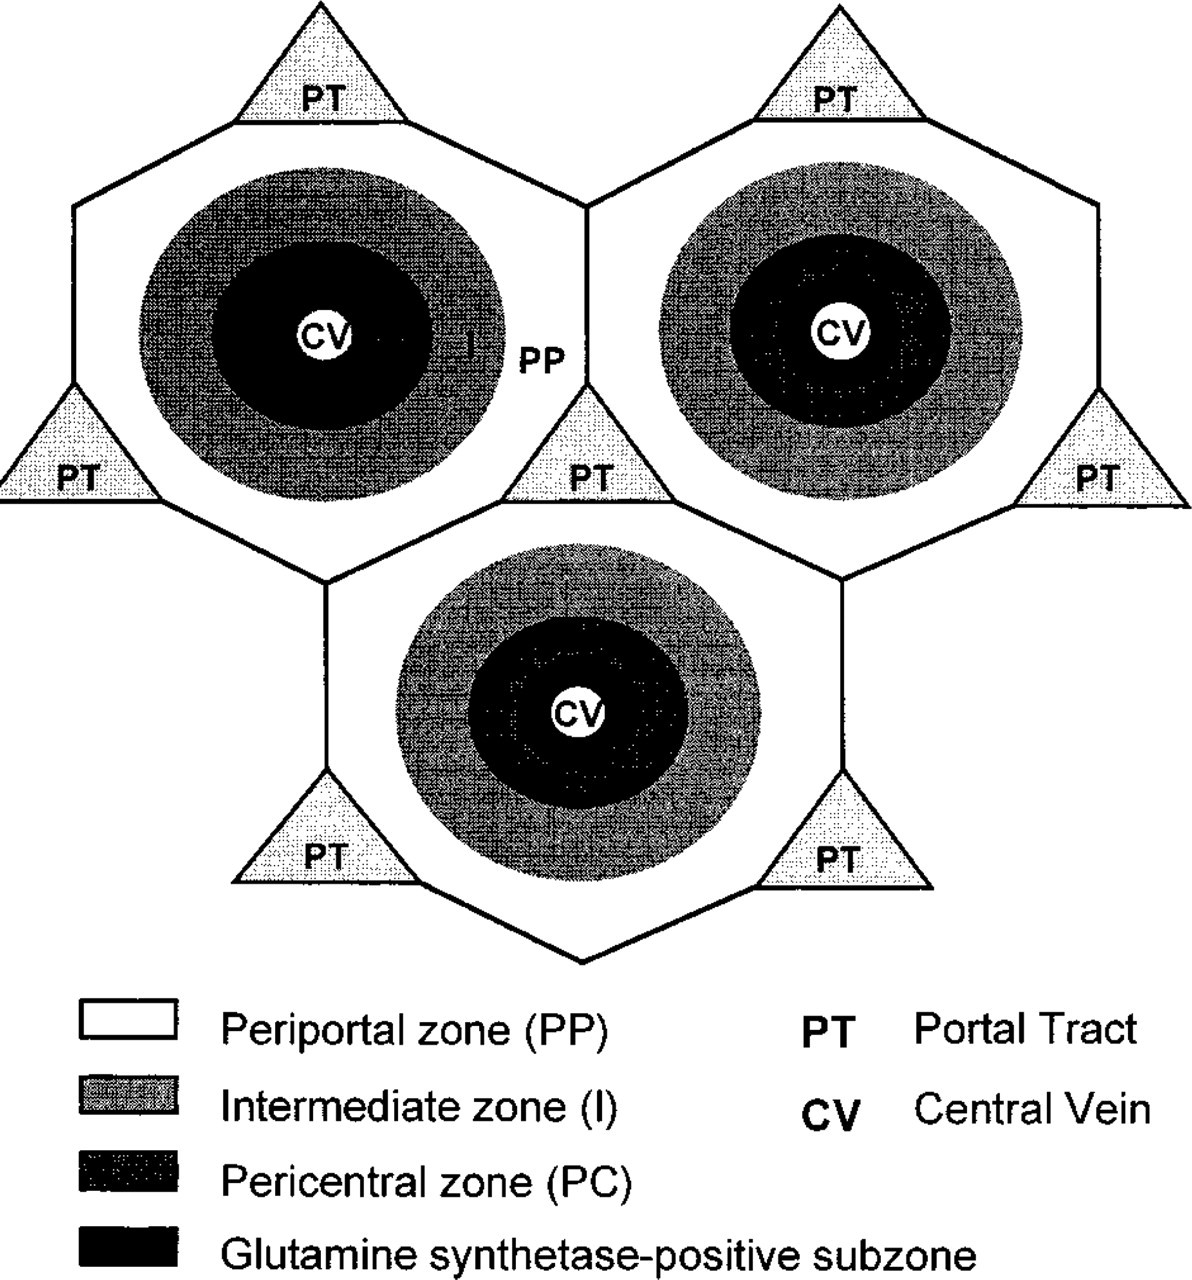
Schematic drawing of rat liver lobules according to the concept of Lamers et al. (1989). Low (white), intermediate (light gray), and high (dark gray) GDH activity is found in periportal (PP), intermediate (I), and pericentral (PC) zones. Within the pericentral zone, glutamine synthetae-positive cells (black) are hepatocytes adjacent to central veins.
Conversion of glutamate, as detected by formazan production at concentrations above 2 mM, was constant (60 ± 5%; Figure 3). On the basis of these results, it was concluded that the sensitivity of the method was 2 mM at pH 8.0 and that absorbance values had to be multiplied by a factor of 100/60 due to incomplete conversion of glutamate into α-oxoglutarate and NH4 +. Addition of 30 mM α-oxoglutarate, one of the reaction products, to either the gelatin-substrate section or the gelatin-enzyme section completely prevented formazan production (Figure 3). Addition of higher amounts of GDH to the gelatin medium (up to 500 U/ml) did not result in higher conversion rates than at 150 U/ml, the concentration of GDH that was routinely used.
Data obtained with the sandwich technique and data obtained with incubations using PVA-containing media were very similar. Again, 60% recovery of glutamate in gelatin sections was obtained in the range of 2–20 mM glutamate (data not shown).
Measurement of Glutamate Concentrations in Rat Liver Sections
To prevent conversion of endogenous substrates other than glutamate from contributing to formazan production, enzymes in the tissue sections had to be inactivated without simultaneously changing the distribution of glutamate itself. In biochemical assays, enzymes are usually inactivated by acid precipitation or heat in-activation. Because heat inactivation for a period of 10 min at 100C is sufficient for complete inactivation of enzymes in homogenates [see Dixon and Webb (1979) and references therein], we tried this approach first. GDH was indeed completely inactivated in liver homogenates after heat inactivation. However, we were unable to inactivate GDH completely in cryostat sections even after prolonged heating at high temperature (up to 200C; Figure 4). In these experiments, sections were attached to a thin coverglass (0.15 mm thick) and were heat-inactivated on an electric hotplate with oil between coverglass and the hotplate to facilitate heat conduction. Several other inactivation methods that would not disturb the tissue distribution of glutamate (
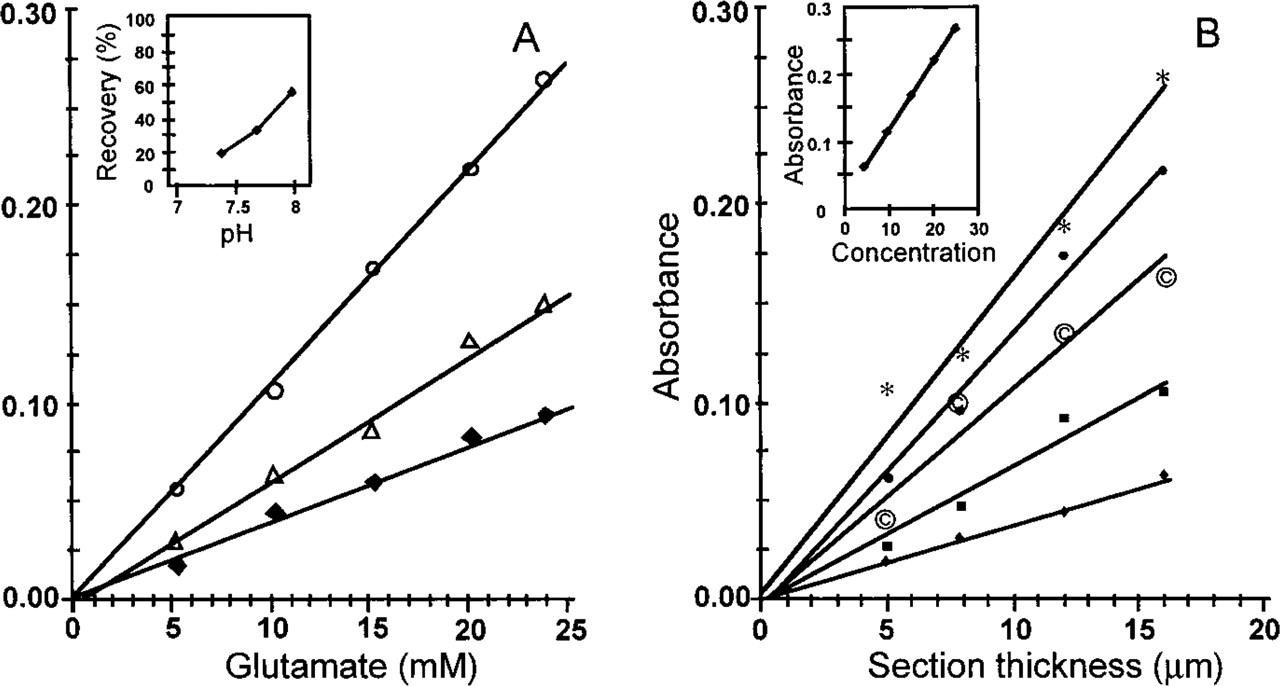
Relationships between formazan production and glutamate concentration, pH, and section thickness of cryostat gelatin model sections containing glutamate. Formazan production was measured as absorbance with a Vickers M85a scanning and integrating cytophotometer at 585 nm. In the first set of experiments, the pH of the gelatin-containing solutions and glutamate concentration was varied
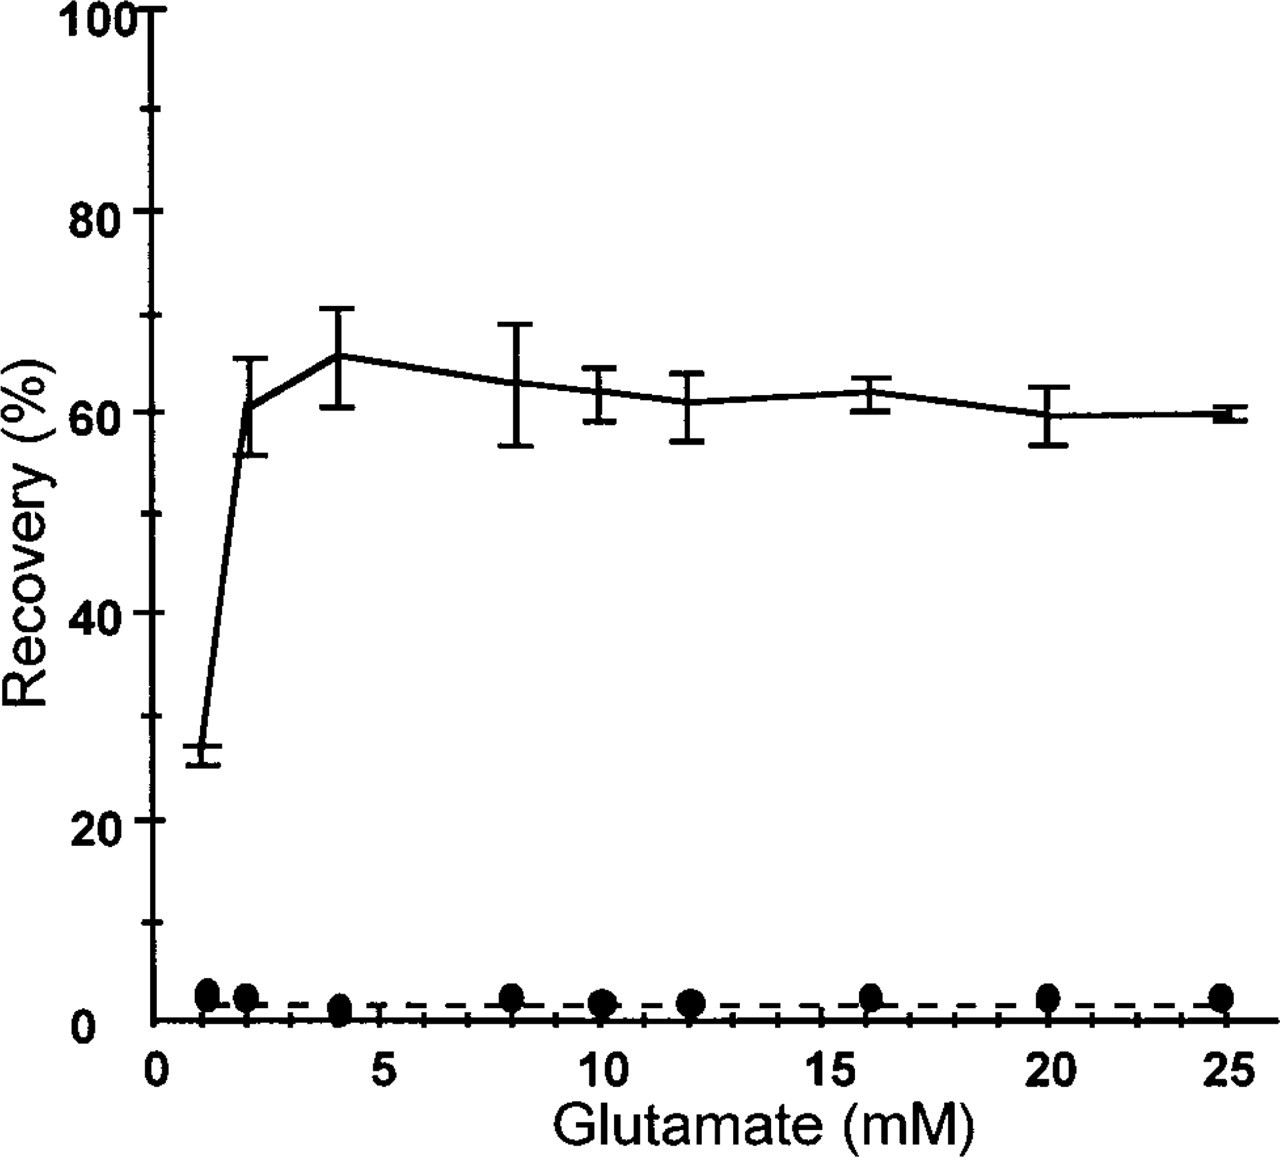
Conversion of glutamate as determined by formazan production at pH 8.0 in gelatin model sections (8 μm thick) expressed as percentage of the initial glutamate concentration (—). The results of three separate experiments (± SD) are shown. The calculated glutamate concentrations were corrected for background absorbance of sections without glutamate. Inhibition of formazan formation by the presence of 30 mM α-oxoglutarate in either the substrate or the GDH-containing section is shown as well (⊆–⊆).
Because these results indicated that it was not possible to inactivate endogenous enzymes in tissue sections completely, another approach was chosen to ensure the exclusive measurement of glutamate-dependent formazan production in cryostat tissue sections. Formazan production was strongly dependent on the addition of exogenous coenzyme (NAD+) (compare Figure 5, bars 1 and 2). Apparently, the level of endogenous NAD+ was too low to drive the reaction. Addition of GDH to the incubation medium did not significantly increase the amount of formazan produced (Figure 5, bar 3). On the basis of these results, it was concluded that endogenous GDH was responsible for conversion of glutamate in cryostat sections of livers. Absorbance values were reduced to background levels when 30 mM α-oxoglutarate was added to the incubation medium that contained NAD+ and GDH (Figure 5, bar 4; cf. Figure 3). This finding is in agreement with our previous observations that 30 mM α-oxoglutarate effectively inhibits GDH activity in liver (Jonker et al. 1995). Therefore, inhibition of glutamate deamination by α-oxoglutarate was chosen as the proper control to estimate background (i.e. glutamate-independent) formazan production.
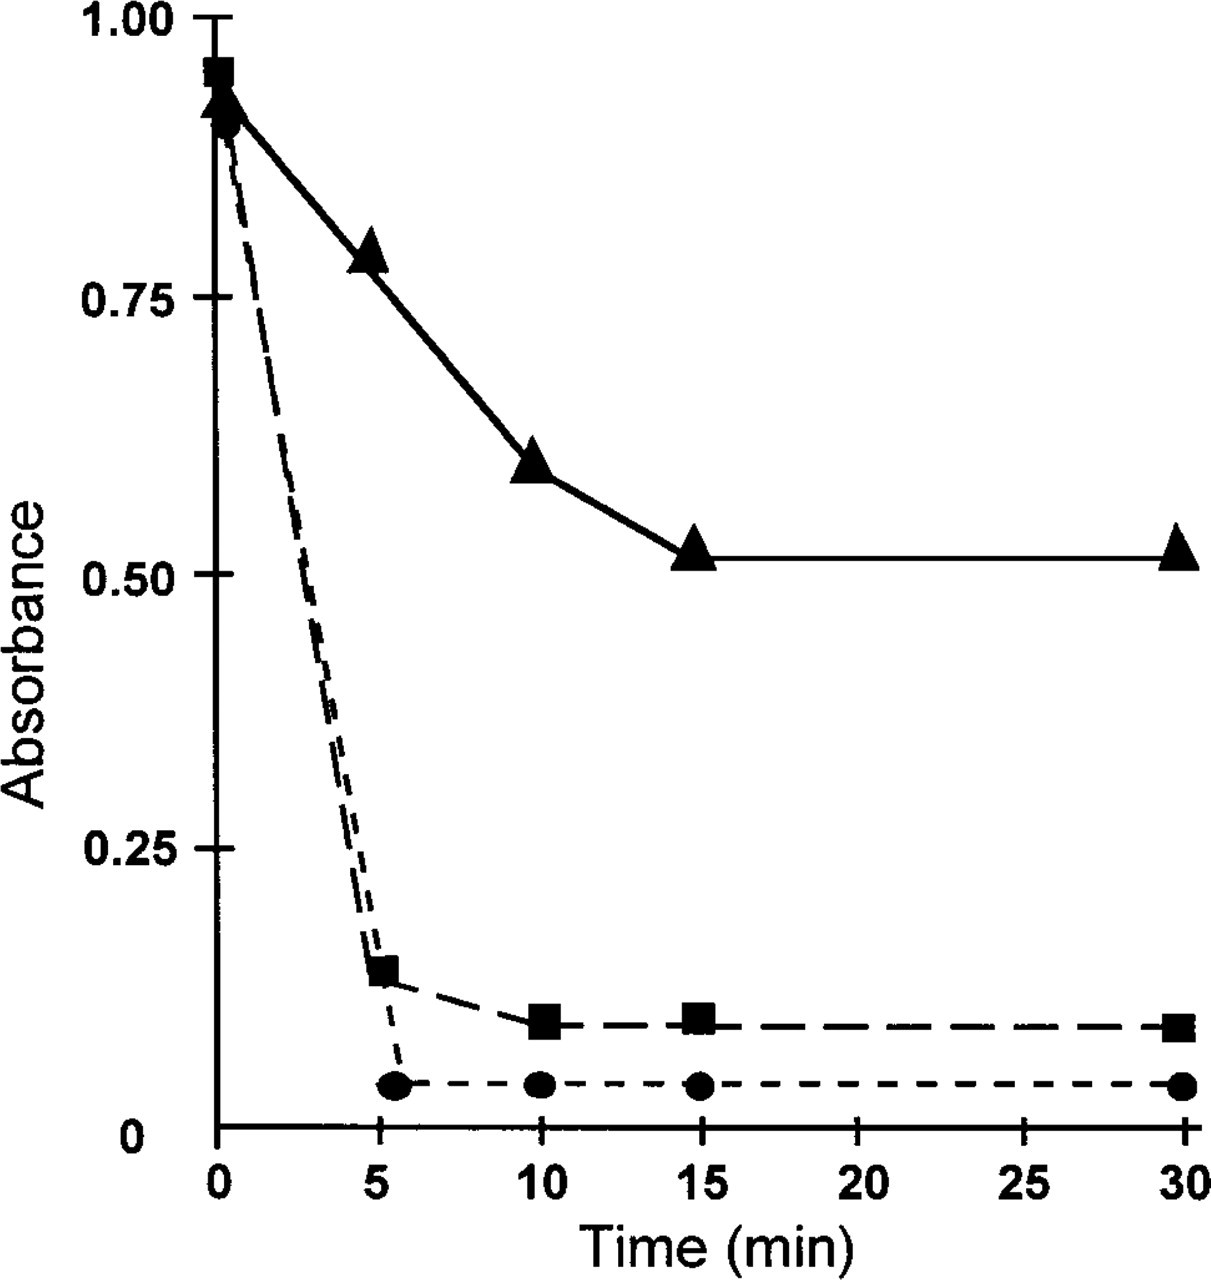
Effect of heat treatment on GDH activity in cryostat sections of rat liver. Eight sections (8 μm thick) were heat-inactivated at 100C (▴), 150C (⊆), or 200C (▄) for different periods of time. The amount of formazan produced in pericentral zones after 5 min of incubation at room temperature in the presence of 100 mM glutamate was measured at 585 nm using the Vickers M85a cytophotometer. GDH activity in periportal zones showed a similar behavior.
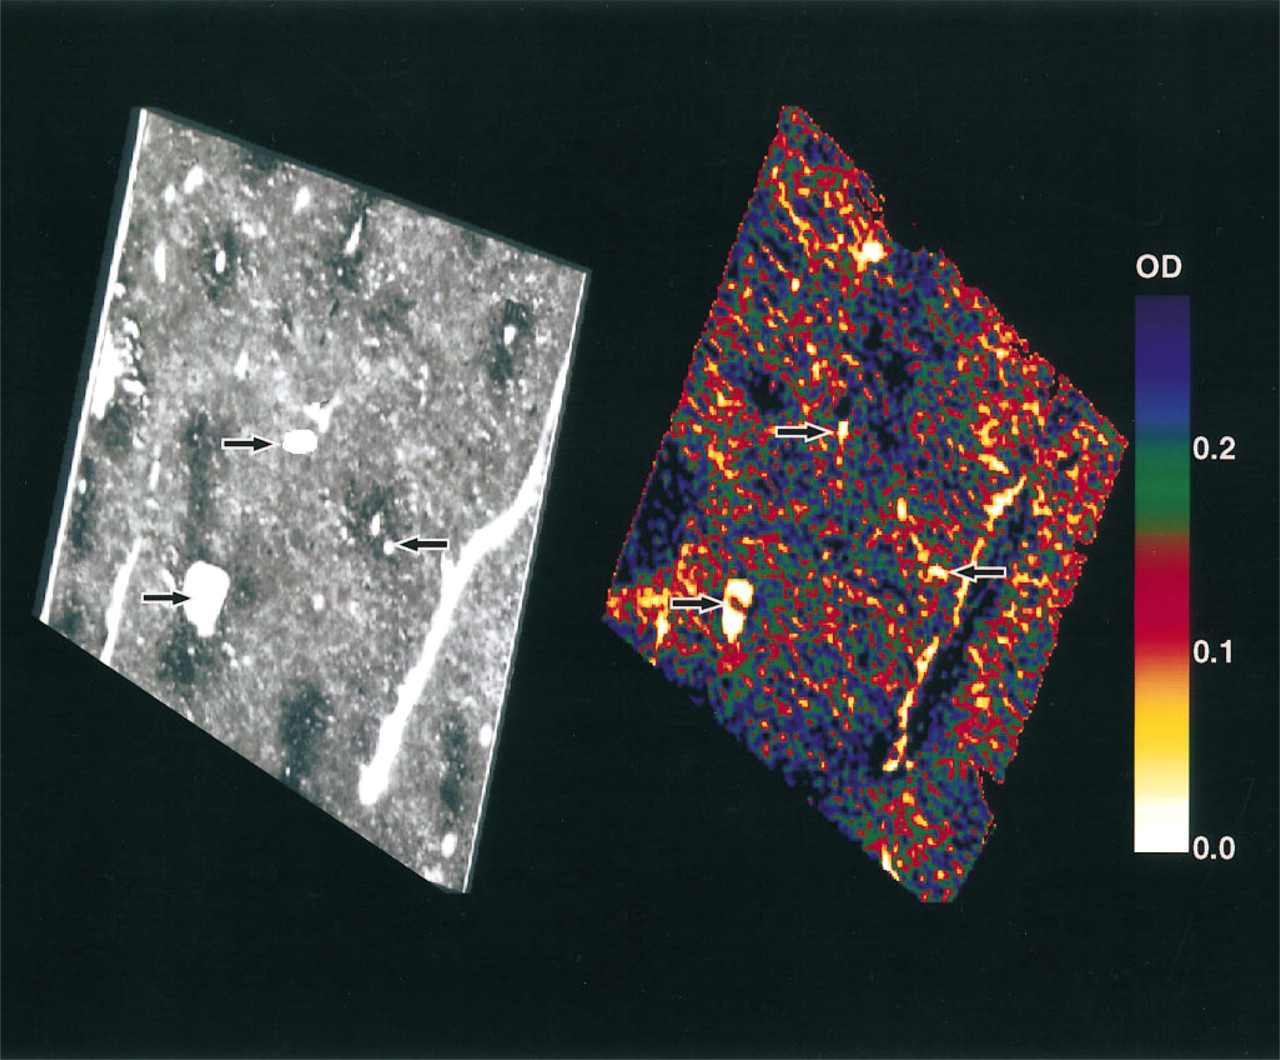
Test and control sections were topographically matched by affine transformation (Jonker et al. 1995). Subsequent subtraction of absorbance values of corresponding zones in serial test and control sections yielded a 2D pattern of substrate-dependent absorbance values and, hence, of glutamate concentrations (Figure 6). For visualization purposes, absorbance differences were transformed into false-color images (Figure 6B). Comparison of the false-color images (i.e., glutamate distribution patterns) with corresponding GDH activity patterns (Figure 6A) showed that highest glutamate concentrations were present in periportal zones of male rat liver. The enzyme-histochemically determined distribution patterns of glutamate were confirmed by immunohistochemical means (Figure 7).
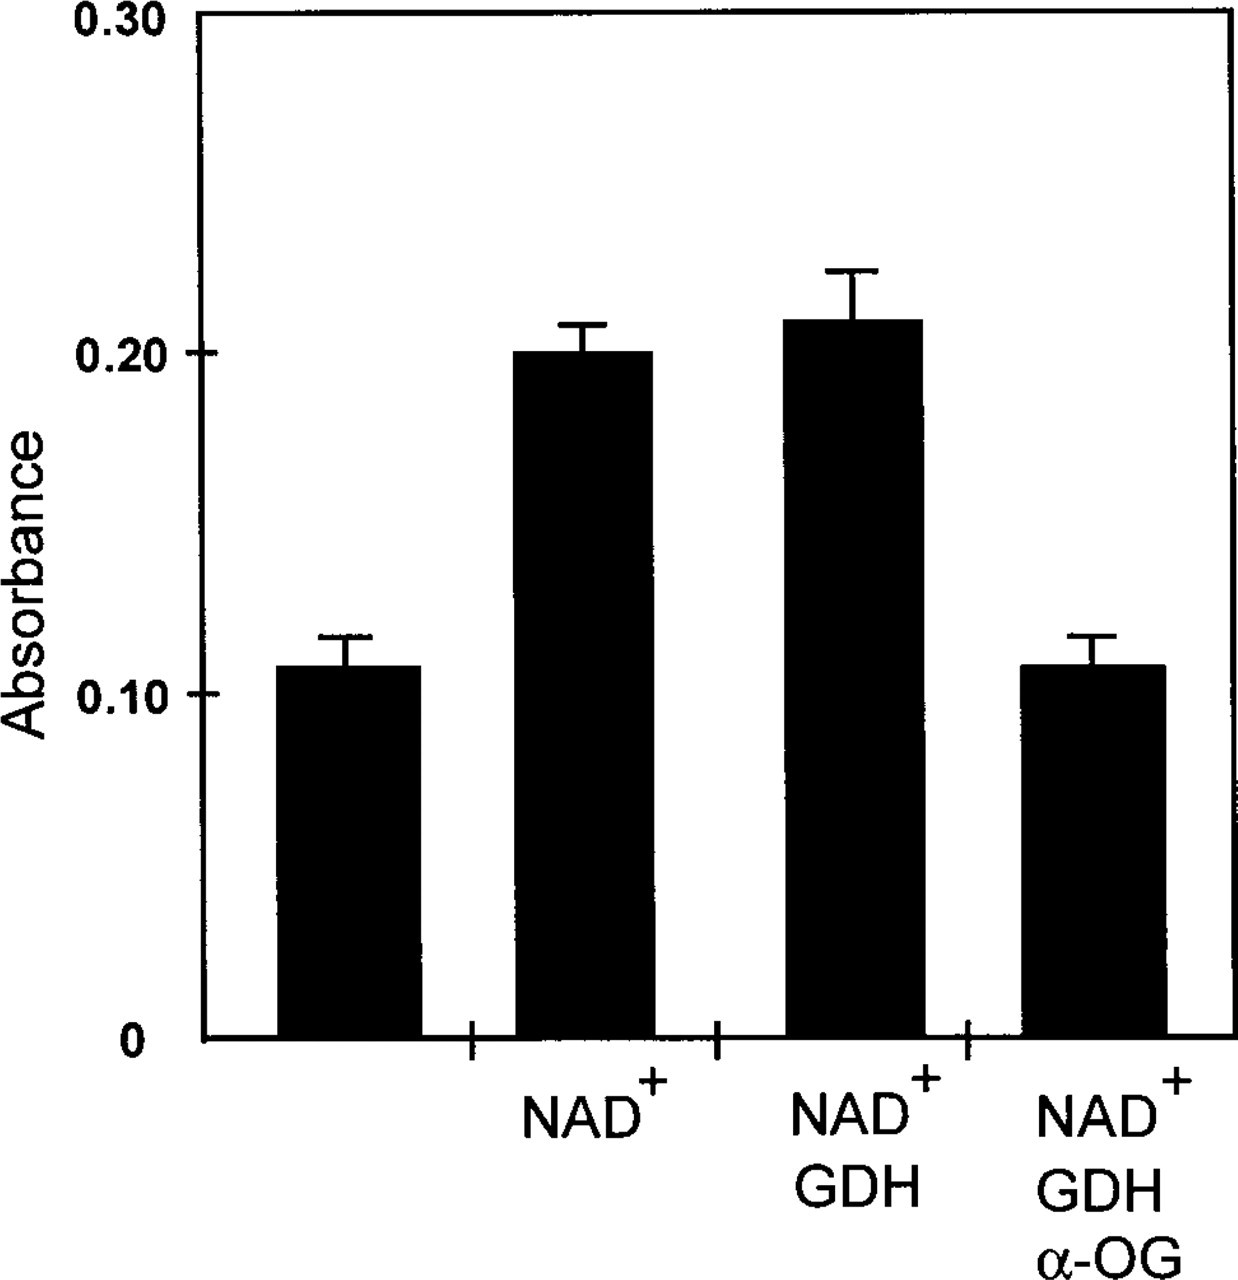
Formazan production in cryostat sections of liver of a fed male rat without additions (bar 1) and after addition of 4 mM NAD+ (bar 2), 4 mM NAD+ and 150 U GDH/ml (bar 3) or 4 mM NAD+, 150 U GDH/ml and 30 mM α-OG (bar 4) to the incubation medium. Formazan production was measured at 585 nm using the Vickers M85a cytophotometer after 20-min incubation at 37C. Addition of 30 mM α-OG to the medium in the presence of NAD+ and GDH reduced formazan formation to background levels.
Because differences between test and control absorbance values per pixel were small, images of glutamate distribution patterns were too “noisy” to reliably calculate cellular glutamate concentrations. To obtain reliable glutamate concentrations in periportal and pericentral hepatocytes, additional approaches were taken. In the first approach, 10 periportal and 10 pericentral zones were selected in corresponding test and control sections, each zone being 100 pixels (= 670 μm2) in size. Glutamate concentrations in periportal and pericentral zones were calculated by subtracting absorbance values of test and control sections. This approach confirmed that glutamate concentrations were higher periportally than pericentrally in fed adult male rats (Figure 8A). In the second approach, glutamate concentrations were estimated in zones of low, intermediate, and high GDH activity representing periportal, intermediate, and pericentral zones of the liver lobule, respectively (cf. Figure 1). Glutamate concentrations in zones of low, intermediate, and high GDH activity were estimated by subtracting the summed absorbance values of the corresponding zones in test and control reactions and dividing these values by the number of pixels overlying each of these zones. The results of this approach are shown in Figure 8B and Figures 9B, 9D, 9F, and 9H). The findings obtained with both approaches were comparable, except that the second procedure also yielded information on glutamate concentrations in intermediate zones that could not be delineated properly in the first approach.
In fed adult male rat livers, periportal zones contained highest concentrations of glutamate (14 mM). The values in pericentral zones were 40% lower (9 mM; Figures 8 and 9). In livers of fasted adult male rats, glutamate concentrations in periportal and intermediate zones were in the same range as those found in fed rats, whereas glutamate concentrations in pericentral zones increased to 13 mM (Figures 8 and 9).
We elaborated the second approach further because the immunohistochemical results showed higher glutamate concentrations not only in periportal zones but also in a small rim of hepatocytes around central veins (Figure 7B). To measure the concentration of glutamate in this small rim (Figures 1 and 7B), the density slice of the NIH image program was used to select the upper 10% of absorbance values in pericentral zones. This selection indeed corresponded to the small rim that expresses the glutamate-consuming enzyme GS. The rim of hepatocytes contained higher glutamate concentrations than the adjacent pericentral hepatocytes (11 and 15 mM in fed and fasted rats, respectively; Figure 8B), confirming the immunohistochemical distribution pattern of glutamate.
In perinatal rats, hepatic glutamate concentrations were homogeneously distributed. In 19-day-old fetal (Figure 9G) and in 0-day-old neonatal rats, GDH activity was also homogeneously distributed in liver. Hepatic glutamate concentrations were ∼5 mM in these livers (Figures 8A and 9H). In 7-day-old neonatal rats, a clear distinction between pericentral and periportal zones could be made on the basis of the distribution pattern of GDH activity (Figure 9E), but glutamate concentrations in these livers were found to be homogeneously distributed (7 mM; Figures 8 and 9F).
Measurement of Glutamate Concentrations in Isolated Hepatocytes
Isolated periportal and pericentral hepatocytes of fasted adult male rats were incubated in a mixture of amino acids as is present in the portal blood of fed animals and were used to estimate zonal differences in cellular glutamate biochemically. Periportal hepatocytes were enriched in CPS, whereas pericentral hepatocytes were enriched in GS, as expected (Table 1) (Gebhardt and Mecke 1983; Gaasbeek–Janzen et al. 1987). Total hepatocyte preparations, which contain a mixture of periportal and pericentral hepatocytes, showed intermediate activity. Intracellular glutamate concentrations of periportal hepatocytes were higher than those of pericentral hepatocytes, whereas total hepatocyte preparations contained intermediate concentrations (Table 1).
Enzyme histochemical detection of distribution patterns of GDH activity
Discussion
Our study shows that cellular substrate concentrations can be determined in cryostat sections with a quantitative enzyme histochemical method using a colorimetric visualization technique. Glutamate was chosen as the test substrate because it is present in fairly high concentrations and shows a heterogeneous distribution pattern in rat liver (Boon et al. 1991) (Figures 7 and 8; Table 1). Furthermore, antibodies against glutamate were available (Pow and Crook 1993) to verify the histochemical findings. Our data clearly show that the glutamate concentration is higher in periportal than in pericentral hepatocytes of fed adult male rats. Fasting induces an increased glutamate concentration only in hepatocytes of pericentral zones. A very useful aspect of the present method is that it can be applied to small tissue samples, such as fetal and neonatal organs, which are too small to allow tissue fractionation. However, several methodological problems that we have encountered in the present study have to be addressed before the method can become widely applicable.
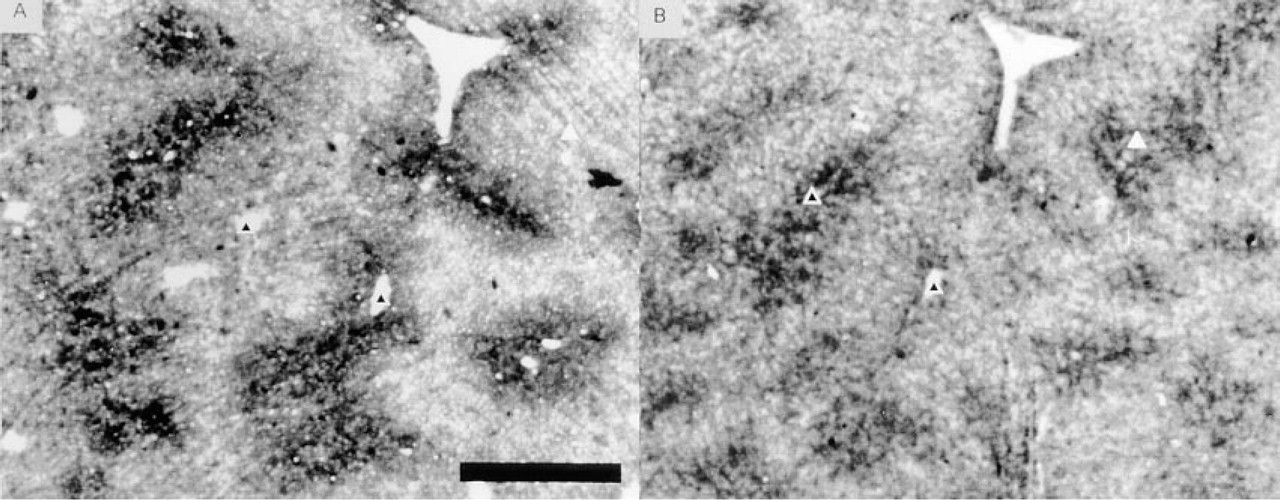
Digital images of immunohistochemically determined glutamate distribution pattern
Evaluation of the Enzyme Histochemical Method
An important issue to be considered is that it takes time to freeze tissues in such a way that they can be analyzed histochemically. We have tried to evaluate the effects of this delay by analyzing glutamate concentrations in isolated periportal and pericentral hepatocytes, i.e., by separating these two populations of hepatocytes before freezing rather than the other way around as is done in histochemical assays. The cells were exposed to a mixture of amino acids as is found in the portal vein after feeding (Meijer et al. 1985). Under these conditions, glutamate concentrations in isolated periportal cells were comparable to those found with the enzyme histochemical analysis in fed rat liver (Figures 8 and 9; Table 1). This finding suggests that we were sufficiently rapid in freezing the liver to avoid major changes in glutamate concentrations. The concentrations that we found biochemically and histochemically in periportal zones were similar, but our histochemical estimate of glutamate concentrations in pericentral hepatocytes was threefold higher than that in isolated pericentral hepatocytes. However, the biochemical assay is complicated by the presence of an upstream periportal compartment which makes the composition of the blood to which pericentral hepatocytes are exposed in vivo different from that in the portal vein with respect to amino acid composition, acid/base balance (Benedetti et al. 1993), and oxygenation (Thurmann and Kaufmann 1985). It has been demonstrated that these parameters affect intracellular amino acid concentrations, including glutamate (Boon and Meijer 1988; Boon et al. 1991). The fact that we found a high concentration of glutamate, both immunohistochemically (Figure 7B) and enzyme histochemically in a distinct pericentral rim of GS-positive hepatocytes, also suggests that the tissue was fixed sufficiently rapidly to determine glutamate concentrations reliably.
The major methodological drawback of the histochemical method to measure local substrate concentrations encountered thus far appears to be the failure to inactivate enzymes in cryostat sections without causing redistribution of substrates (Figure 4). Water in such sections evaporates very rapidly, and the resulting desiccated proteins prove to be extremely stable even at high temperatures. Some reported substrate measurement procedures on cryostat sections rely solely on heat inactivation at 100C for 10 min to inactivate cellular enzymes (Mueller–Klieser et al. 1988; Walenta et al. 1990). These assays have to be looked on with reservation with respect to specificity because, in our hands, only 50% of GDH is inactivated in such sections (Figure 4). When this is the case for other enzymes as well, final reaction product may include a (substantial) contribution from conversion of various endogenous substrates present in the tissue by other (partially) active enzymes. Because of the resulting lack of specificity of the assay, estimations of local substrate concentrations may turn out to be too high. Preservation of zonation of the remaining enzyme activity in heat-inactivated sections may result in substrate distribution patterns that resemble those of enzyme activities. For ATP measurements using bioluminescence, this is probably not the case because of the direct and specific conversion of ATP in the presence of luciferin and oxygen by firefly luciferase (Mueller–Klieser and Walanta 1993). This was confirmed by parallel NMR spectroscopy measurements by Mueller–Klieser et al. (1990). However, for measurements of local glucose and lactate concentrations with bioluminescence, interference of other enzymes converting endogenous substrates may occur because glucose and lactate concentrations are linked to bioluminescence via NADPH or NADH production. Nevertheless, parallel control studies showed a good correlation between glucose and lactate concentrations as measured in situ with bioluminescence and in vitro with standard biochemical techniques (Paschen et al. 1981; Mueller–Klieser and Walanta 1993).
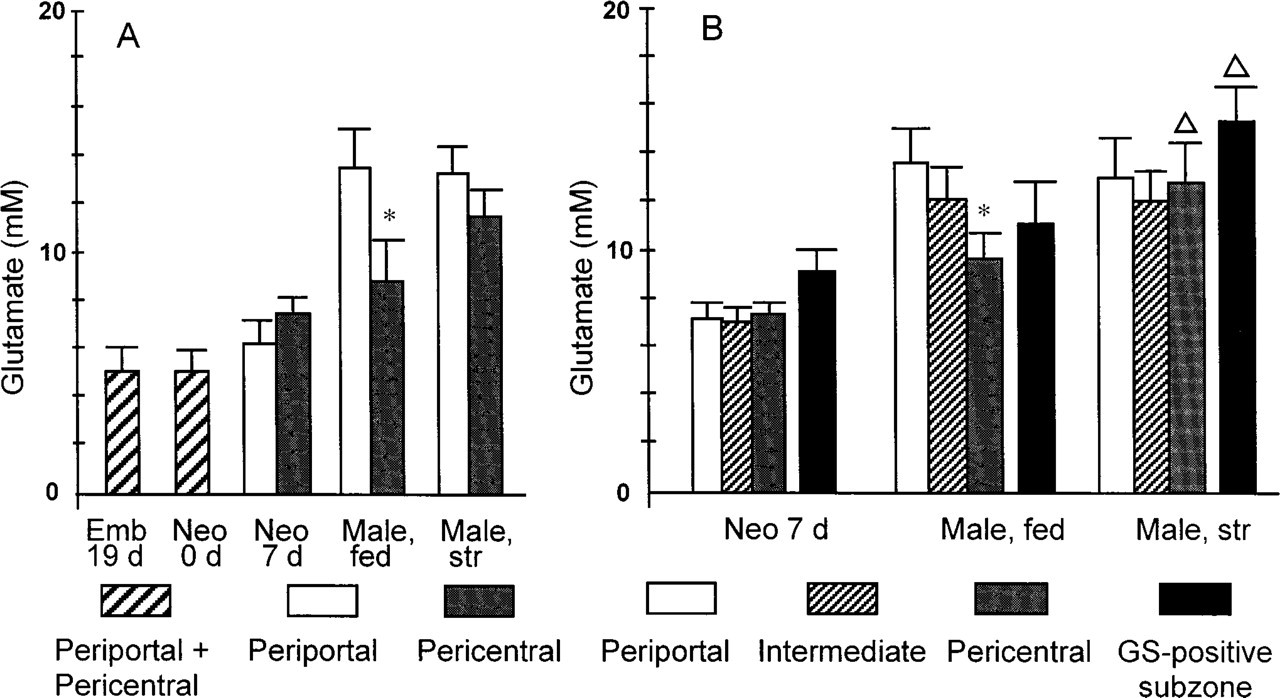
Differences in glutamate concentrations in periportal, intermediate, and pericentral zones of rat liver at different developmental stages. The concentrations shown in A represent mean ± SEM of spot measurements (100 pixels) in 10 periportal and 10 pericentral zones in three different livers per group of animals. The concentrations in B represent the mean ± SEM of glutamate measurements in zones with low, intermediate, and high GDH activity. Highest glutamate concentrations in pericentral zones (the upper 10% of the glutamate-dependent absorbance values) were found in the GS-positive hepatocytes that are directly adjacent to central veins. Statistical analysis (Student's t-test) revealed significant differences between pericentral and periportal glutamate concentrations (∗) and between glutamate concentrations in corresponding zones of fed and fasted rats (Δ). The level of significance was taken as p = 0.05. Emb 19 d, embryonic day 19; Neo 0 d, neonatal 0 days; Neo 7 d, neonatal 7 days; Male, fed, adult male rat normally fed; Male, str, adult male rat starved for 24 hr.
In the present study we were able to obviate these problems by using α-oxoglutarate and a favorable equilibrium of GDH reactants to assess glutamate-independent NADH production and hence to specifically determine tissue glutamate-dependent formazan production (Jonker et al. 1995). In comparing sensitivity of the present formazan production method with the bioluminescence method, it has to be concluded that the latter is ∼10-fold more sensitive (2 mM vs 200 μM) (Mueller–Klieser and Walanta 1993). Therefore, our method is well suited for substrate measurements provided that concentrations in the millimolar range are present.
An unanticipated finding was that GDH added to the incubation medium, even at high concentrations, did not contribute to glutamate-dependent formazan production in the tissue sections (Figure 5). This finding was not expected because glutamate and GDH interacted without apparent diffusion problems in the gelatin model sections (Figures 2 and 3). Unimpeded diffusion was also found for glucose-6-phosphate and glucose-6-phosphate dehydrogenase in gelatin model sections (Koopdonk–Kool and Van Noorden 1995). Apparently, substrates diffuse from the substrate-containing gelatin sections into the enzyme-containing gelatin sections. The lack of effects of addition of exogenous GDH when tissue sections are analyzed therefore suggests that glutamate in tissue sections is largely bound, probably to glutamate-metabolizing enzymes. This phenomenon limits the applicability of the method to tissues in which glutamate and GDH are colocalized. As an example, we could easily demonstrate glutamate in the cerebellar Purkinje cells with immunohistochemistry, but because these cells do not contain GDH activity cellular glutamate could not be visualized by enzyme histochemistry (data not shown). Similar problems are also known to exist in enzyme histochemical assays that depend on the presence of auxiliary enzymes in the incubation medium (Frederiks et al. 1988). Nevertheless, the finding that in fed rats the highest glutamate concentration was found in periportal zones, i.e., the zones with the lowest GDH activity, and the lowest glutamate concentration in pericentral zones, i.e., the zones with the highest GDH activity, rules out the possibility that the distribution of glutamate reported here reflects the hepatocellular GDH content.
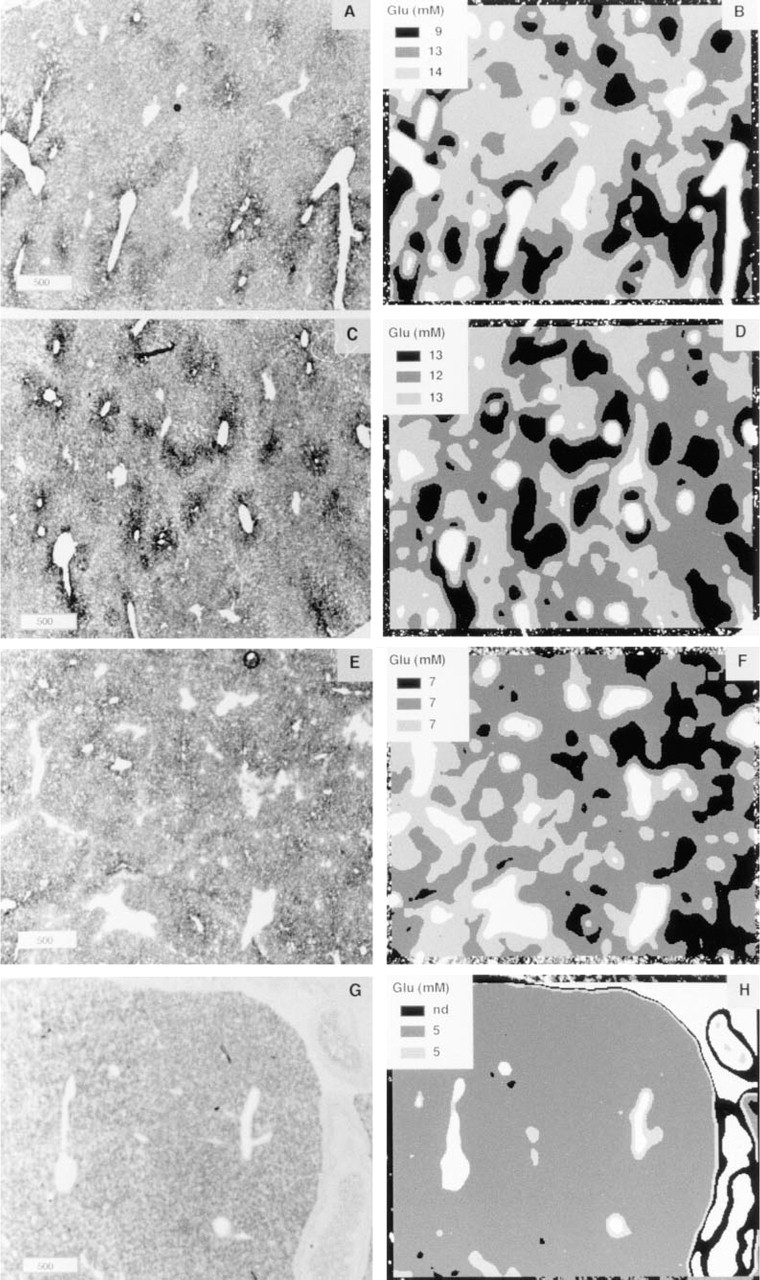
Distribution patterns of GDH activity and glutamate concentrations in the liver of rats in different developmental stages.
The fact that glutamate is firmly bound to tissue components is probably the reason why spatial resolution in tissue sections enables discrimination of the single GS-positive hepatocyte layer around central veins of approximately 40 μm in diameter (Figures 8 and 9). In gelatin model sections, lateral diffusion was rather significant. Koopdonk–Kool and Van Noorden (1995) reported a spatial resolution of only 150 μm in these model sections.
The glutamate measurements on gelatin-model sections revealed a constant recovery of glutamate at concentrations higher than 2 mM in 8-μm-thick gelatin sections. The relatively low conversion of approximately 60% is most likely due to the catalysis by GDH of an equilibrium reaction which is strongly in favour of glutamate synthesis (Burton and Krebs 1953):
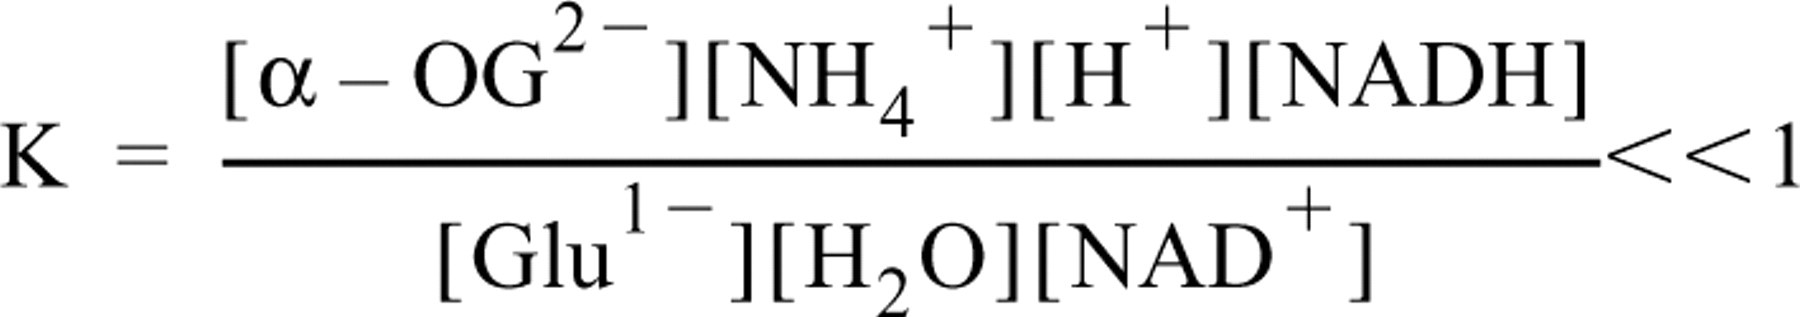
Variations of the concentrations of exogenous NAD+, PMS, and NBT did not result in a higher recovery. This indicates that the ratio NADH/NAD+ was constant at different glutamate concentrations, most likely because the reducing equivalents of NADH were effectively captured by the PMS–NBT system (Van Noorden and Butcher 1989). Furthermore, the pH was well buffered, implying that [H+] was also constant. A further increase in the degree of conversion can therefore only be obtained by capturing α-OG2- or NH4 +. This conclusion implies that the degree of conversion depends largely on the equilibrium of the reaction under investigation. In conventional assays, glutamate is always determined at high pH (pH 9) to decrease the [NH4 +]/[NH3] ratio and in the presence of hydrazine to trap α-oxoglutarate (Frieden 1959). However, both a pH higher than 8.0 and addition of hydrazine resulted in formazan formation in the medium. In accordance with these arguments, measurements of the concentration of glucose-6-phosphate in gelatin model sections (using glucose-6-phosphate dehydrogenase) showed a considerably higher conversion (approximately 85%) (Koopdonk–Kool and Van Noorden 1995). Notwithstanding the relatively low substrate conversion, our method is applicable for measurement of local glutamate concentrations in liver tissue, because they were in the range of 5–16 mM.
Activity of CPS and GS and intracellular glutamate concentrations in periportal and pericentral hepatocytes and total hepatocytes preparations of fasted adult male ratsa
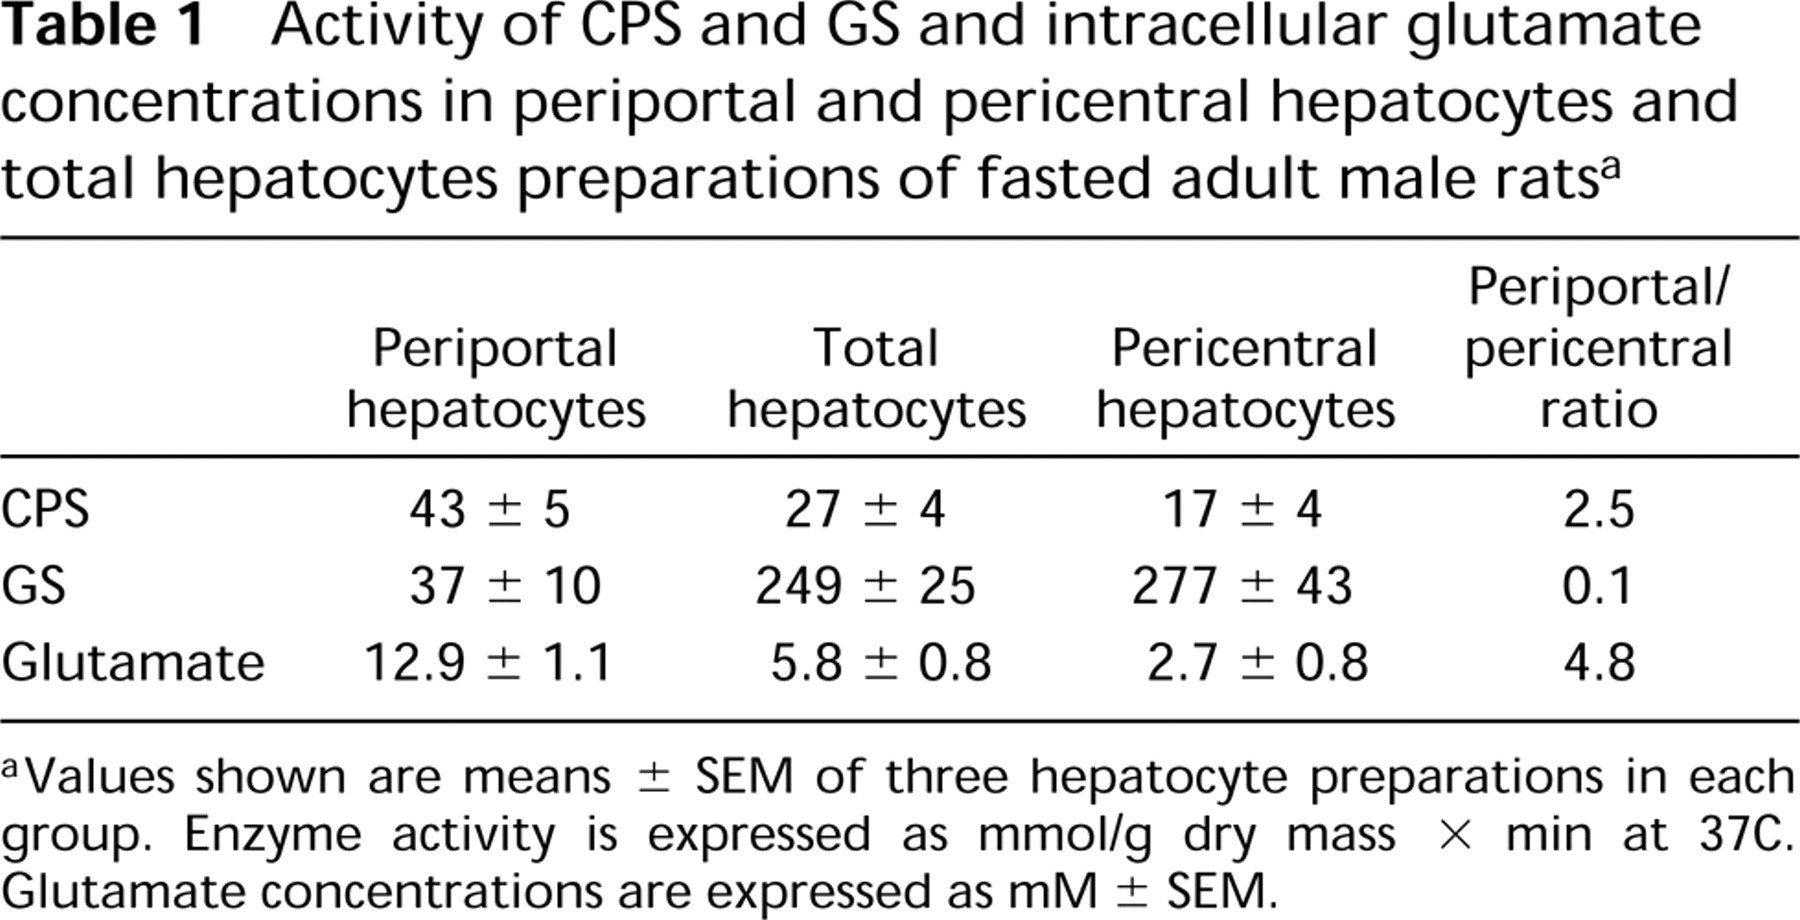
Values shown are means ± SEM of three hepatocyte preparations in each group. Enzyme activity is expressed as mmol/g dry mass × min at 37C. Glutamate concentrations are expressed as mM ± SEM.
The strong pH dependency of the reaction (Figure 2) is based on at least two factors. Activation of the dehydrogenase reaction by the allosteric effector ADP occurs at alkaline pH (Stoward and Pearse 1991), whereas NBT reduction is also a pH-dependent phenomenon and occurs more easily at high pH (Altman 1976; Seidler 1991).
The advantage of the enzyme histochemical method in combination with image analysis was that interesting regions could be selected in recorded images and that measurements could be performed afterwards. Furthermore, different image processing approaches could be tested on the same tissue sample, allowing comparison of the results of the different methods applied (Figure 8). The method of affine transformation and subsequent subtraction of the control reactions from the test reactions (Jonker et al. 1995) resulted in a general impression of zones with higher and lower glutamate concentrations (Figure 6). However, the images were “noisy” and registration over larger zones (i.e., at low magnifications) was difficult to achieve due to small changes in the 3D architecture of the vessels over the serial sections. Especially at the edges of central veins and portal tracts, incorrect matching and hence incorrect absorbance values were found regularly (Figure 6B). The method of measuring absorbances in many small areas in periportal and pericentral zones (Figure 8A) was time-consuming and prone to nonrandom selection of samples. The method of measuring absorbances in larger areas based on the distribution pattern of GDH activity (Figures 8B and 9) was rapid and did not require selection of the measuring area by the investigator. In this way, it became possible to measure substrate concentrations in entire sections. However, this approach generates the average concentration of glutamate within an area defined by the level of GDH activity. Hence, it obscured the presence of the relatively high concentration of glutamate in hepatocytes adjacent to central veins. Even though these hepatocytes occupy only 7% of the total area of liver sections, they could easily be detected immunohistochemically (Figure 7). Because detailed 2D absorbance images were stored electronically, the glutamate content in these hepatocytes could still be assessed after the immunohistochemical data became available.
Biological Relevance of Histochemical Measurement of Substrate Concentrations
The major advantage of biochemical methods to analyze tissues is that they are based on established and validated techniques, whereas their major drawback is the lack of spatial resolution. Virtually the opposite is true for histochemical methods. From this perspective, biochemical and histochemical methods should therefore be used as complementary rather than as alternative methods. Biochemical measurements of glutamate in purified periportal hepatocytes are in good agreement with the enzyme histochemical and immunohistochemical data of intact liver tissue (cf. Figures 7 and 8A; Table 1). On the other hand, a clear discrepancy between biochemical and enzyme histochemical measurements of glutamate was found in pericentral hepatocytes, particularly in the hepatocytes immediately surrounding the central vein. This rim of cells with a relatively high glutamate concentration was not identified in the isolated pericentral cell population (Table 1) or by the standard histochemical spot assays (Figure 8A) but is clearly identified by the approach presented in Figure 8B and delineated at the cellular level by the immunohistochemical method (Figure 7B). Apparently, the cellular environment of these hepatocytes in vivo differs substantially from that present in the biochemical assay. It has been known for more than 10 years that this rim of cells contains a very high concentration of GS (Gebhardt and Mecke 1983; Gaasbeek Janzen et al. 1987). The presence of a high flux through GS in the pericentral rim of hepatocytes is considered to be an efficient trap for ammonia to prevent it from (re-)entering the systemic circulation. One of the remaining questions surrounding the activity of this enzyme was the supply of glutamate to be converted to glutamine. Our data show that the local cellular concentration of substrate for GS is sufficient but also that it is generated only in the GS-containing cells. Interestingly, the higher cellular concentration of glutamate in the GS-positive cells co-localizes with the dicarboxylic acid transporter activity demonstrated by Stoll et al. (1991).
Footnotes
Acknowledgements
We are grateful to Drs D.V. Pow and D.K. Crook (Department of Physiology and Pharmacology, University of Queensland, Brisbane, Australia) for kindly providing the antibody against glutamate, to Dr W.M. Frederiks for fruitful discussions, to Mr C. Gravemeyer and Mr C. Hersbach for excellent (computer) photographic support, and to Ms T.M.S. Pierik for careful preparation of the manuscript.